Technical and economical performance of parabolic trough
collector power plant (SEGS VI)
A.ZAARAOUIa,M.L.YOUSFIb,N.SAIDc
a. University Center of Khemis Milian (Labo FIMA), Route de Theniet El-Had,44225 Khemis Miliana, Algeria
b.Unit for Development of Solar Equipment (UDES), Bou Ismail, 42415 Tipasa, Algeria
c.Development Center of Renewable Energies (CDER),B.P. 62, 16340 Bouzareah, Algiers, Algeria
Résumé
Les centrales solaires à concentration sont une excellente alternative à celles conventionnelles surtout dans les pays qui se situent dans la ceinture solaire. Les centrales SEGS installées en Californie ont fait l'objet de plusieurs études. Dans ce travail, nous proposons l'étude et la simulation de la SEGS VI pour son implémentation en Algérie. Un modèle numérique a été établi en utilisant le logiciel TRNSYS. Quatre sites ont été retenus pour la simulation. Les résultats obtenus nous ont permis de calculer le prix du kWh pour les sites sélectionnés. En se basant particulièrement sur le LEC le plus faible, nous avons retenu pour l'implémentation d'une telle centrale le site de Béchar.
Abstract
Concentrating solar power plants are an excellent alternative to conventional ones particularly in countries that lie in the Sun Belt. SEGS plants installed in California were the subject of several studies. In this work, we propose the study and simulation of the SEGS VI for its implementation in Algeria. A numerical model was developed using TRNSYS. Four sites were selected for simulation. The results have enabled us to calculate the price per kWh for selected sites. Based particularly on LEC lowest, we selected for the implementation of such a central site of Bechar.
Key words:
Solar thermal power plant; TRNSYS simulation; parabolic trough collector; Renewableenergy; SEGS VI.
1.
Introduction
In the last decade, increasing concern regarding the CO2 emission during energy generation. environmental
problems has created considerable awareness about reducing Therefore, the new energy policy in electricity sector encourages the maximum use of renewable or the so-called ‘‘green energy’’ sources such as water, wind and solar [1]. Today, renewable energies provide 19% of the world’s electricity [2]. The assessment of the emissions of solar power systems shows that they are particularly well suited for the reduction of greenhouse gases and other pollutants, without creating other environmental risks or contamination. Each square meter of collector surface can avoid as much as 250–400 kg CO2 emissions per year [3]. During September 2003 a START (Solar Thermal Analysis, Review and Training) team composed of IEA/Solar PACES representatives
and observers from Germany and the United State, visited Algeria. The Mission host was the New Energy Algeria (NEAL) located in Algiers. The purpose of the START mission was to brief NEAL and the invited experts from the Ministry for Energy and Mines (MEM), the Algerian power sector and the interested industrials, on the current techno-economic status of solar thermal technologies and discusses the next steps in building Algeria’s first large solar thermal power plant. With 2,381,741km² of land area, Algeria is by far the largest country of the Mediterranean over 70% of its area is south situated at 20° latitude. According to a study of the German Aerospace Agency, Algeria has with 1,787,000 km² the largest long term land potential for concentrating solar thermal power plants. According to the irradiation maps presented by CDER (Centre de Développement des Energies renouvelables), total annual direct normal irradiation (DNI) ranges from 2100 kWh/m²/yr to over 2700 kWh/m²/yr and is considered among the best insolates areas in the world. Within its policy of climate and environment protection, the Algerian Ministry for Energy and Mines fully supports the objective of the CSP (concentrating solar power) Global Market Initiative (GMI) to facilitate and expedite the building of 5,000 MWe of CSP worldwide over the next ten years. The Government of Algeria has committed itself to develop solar energy as its main renewable energy source for covering 5% of the national electricity demand by 2010 [4]. Incentive premiums for CSP projects are granted within the framework of Algeria’s new Decree 04-92 of March 25th, 2004 relating to the costs of diversification of the electricity production. According to the current power expansion planning of the MEM, the capacity targets for CSP power implementation in Algeria are 500 MW of new ISCCS (integrated solar combined cycle system) plants until 2010 [4]. As a first step 150 MW integrated solar combined cycle system (30 MW is devoted to solar), is under construction. In order to study and follow up this kind of system, it is helpful to have a simulation tool. As it appears in the literature, many models have been elaborated [6],[10] for SEGS system but these models were either unavailable or intended only for design calculations or control studies. For this reason, we developed a model of SEGS VI plant under TRNSYS environment, which allows us to simulate and evaluate the performances of this system under Algerian climate. This system can be installed to supply electricity to people who are lacking electricity in the Algerian rural and deserted areas.
2.
Site selection
The feasibility of selecting solar electric generating systems facilities in Algeria is contingent upon the identification of sites well suited to the technology. Desirable physical characteristics of a favourable SEGS site include [3]: i) high direct radiation level; ii) flat topography; iii) suitable water supply; IVi) access to electric transmission facilities; Vi) Availability of auxiliary fuel supplies.
Additionally, socio-political issues such as existing land use and cost, potential environmental and cultural impacts, and local public acceptance can strongly influence the feasibility of a SEGS project [3]. Many of these characteristics are similar to the conventional power plants, except for solar radiation levels, extensive land area needs, the much reduced importance of air emissions, fuel delivery, and fuel and waste handling. Hence, the evaluation of the site criteria is important and sensitive step in the assessment of SEGS potential in Algeria.
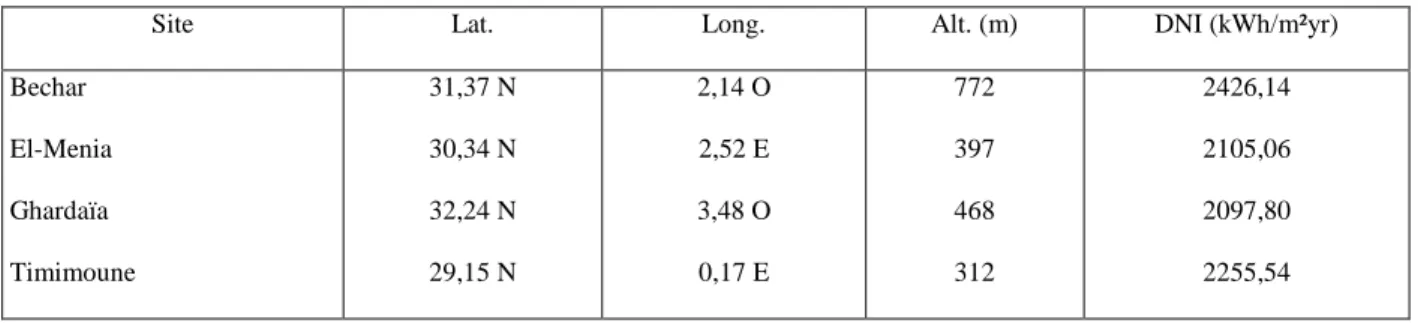
To design and operate any SEGS it is necessary to have reliable meteorological or satellite data. In the present paper, four sites were chosen (see table II) for the simulation due to the availability of their meteorological data in METEONORM software, their relatively high direct normal irradiance (DNI) (all sites are ≥ 2000 kWh/m²yr) and their accessibility to road and electrical network.
TABLE 1. - Selected sites for the simulation.
Site Lat. Long. Alt. (m) DNI (kWh/m²yr)
Bechar El-Menia Ghardaïa Timimoune 31,37 N 30,34 N 32,24 N 29,15 N 2,14 O 2,52 E 3,48 O 0,17 E 772 397 468 312 2426,14 2105,06 2097,80 2255,54
3.
Solar field model
The parabolic trough collector based on the model of Lippke, uses an integrated efficiency equation to account for the different fluid temperature at the field inlet and outlet of the collector field [5]. It calculates the demanded mass flow rate of the heat transfer fluid to achieve a user- defined outlet temperature Tout by:
) T cp.(T Q m in out net − = & (1) Using: heatloss abs net Q Q Q = − (2) The absorbed power is given by:
(
)
c trk avl tot abs A .DNI.F .F .1-BM.η Q = (3)The thermal efficiency of the LS-2 collector can be calculated by [7]:
( ) DNI ∆T ∆T 3 1 ∆T . ∆T D. 2.DNI ∆T ∆T C. 2 ∆T ∆T B. A K.M.Sh. η 2 in out in out in out in out c − + + + + + + = (4)
When the selective coating of the LS-2 absorber collector is Cermet (Ceramic/Metal) and the annular space is evacuated, the empirical factors are given as follow [8]:
A = 73.3, B = -0.007276, C= -0.496, D = -0.0691
The incidence angle modifier K can be calculated with the angle of incidence θ in degrees as follow [6]:
( )
( )
2 θ 0.00003137 θ 0.0003512 ) cos(θ K= − − (5)An analytical description of the heat losses in the trough field is not easy to find, since all losses such as heat transfer through the pipes isolations, losses in connections, fixings and other circuit components have to be considered [7].
In the operation of a distributed solar power plant, the heat losses in all the piping are Important and have to be included in the model. Additionally, the heat loss in the expansion vessel, which has a large surface area, should be included in the calculation. The heat loss can be calculated by [8]:
+ + + = 550 T T . Q 686 T T .A Q Q out in essel ExpansionV in out eff Piping HeatLosses (6) Finally, the efficiency of the solar field ηfield can be calculated by:
trk eff net field
.F
DNI.A
Q
η
=
(7)4.
Power plant model
The power plant, as shown in Figure 1, is a Rankine cycle with reheat and feed water heating. For simplicity, each heat exchanger network, consisting of preheater (economizer), steam generator (boiler) and superheater is treated as a single heat exchanger [8].
Fig. 1. Flow diagram for power cycle. The numbered vertical cylinders (#1 – 3, 5 – 6) represent closed feed water heaters, while heater #4 represents the deaerator [8].
The power cycle is modeled assuming all components are adiabatic and operating at steady states. Changes in potential and kinetic energy of fluid streams are assumed to be negligible. It is assumed that all the steam generated provides useful work through the turbine, i.e., gland steam production as well as steam losses through line leaks are neglected. Also, negligible changes in the fluid state between the outlet of one component and the inlet of the next are assumed. All power cycle equations are based on mass and energy balances over each fluid stream through each component. Heat exchangers are modeled using an effectiveness-NTU approach. Turbine stages and pumps are modeled in terms of their isentropic efficiencies. The heat exchanger sizes and isentropic efficiencies are determined from full-load design data and adjusted for part-load operation as a function of steam mass flow rate. The gross system efficiency ηsystem is defined as the ratio of the gross power output to the net heat absorbed by the heat transfer fluid:
net gross system
Q
W
η
=
&
(8)5.
Simulation
The use of simulation tools when planning renewable independent power projects minimizes the risks of these projects. Simulation tools can also help to find the best project site for a given technology or the best technology for a given site [6]. The simulation of both solar field and power plant is done by using STEC (Solar Thermal Electric Component v2.2) library under TRNSYS 15 software for a typical year in hourly time steps. For this study, the necessary properties applied in the model can be drawn from the technical description [10]. Whereas, water-steam conditions throughout the Rankine cycle are given for solar only operation mode, and are considered as reference conditions
6.
Results and discussions
The dailly (equinox and solstices) and the annual (typical year) results of the simulation for Bechar's site, are represented bellow.
1) Daily results - For the equinox:
0 10 20 30 40 50 60 1 2 3 4 5 6 7 8 9 1011 12 13 1415 16 1718 19 20 2122 23 24 Time (hours) 0 100 200 300 400 500 600 700 800 900 1000 System efficiency (%) Solar field efficiency (%) Gros s power output (MW) Direct normal irradiance (W/m²)
Fig. 2. March 21st 0 5 10 15 20 25 30 35 40 45 50 1 2 3 4 5 6 7 8 9 10 11 12 13 14 15 16 17 18 19 20 21 2223 24 Time (hours) 0 100 200 300 400 500 600 700 800 900 System efficiency (%) Solar field efficiency (%) Gross power output (MW) Direct normal irradiance (W/m²)l
Fig 3. September 21st
- For the solstices:
0 10 20 30 40 50 60 1 2 3 4 5 6 7 8 9 10 1112 1314 15 1617 18 19 20 2122 23 24 Time (hours) 0 100 200 300 400 500 600 700 System efficiency (%) Solar field efficiency (%) Gros s power output (MW) Direct normal irradiance (W/m²)
Fig 4. June 21st 0 5 10 15 20 25 30 35 1 2 3 4 5 6 7 8 9 101112131415161718192021222324 Time (hours) 0 100 200 300 400 500 600 700 800 900 1000 Sys tem efficiency (%) Solar field efficiency (%) Gross power output (MW) Direct norm al irradiance (W/m ²)
Fig 5. December 21st
2) Annual results
Figure 6 illustrates the annual efficiency of the solar field which is about 40.91%.
0 10 20 30 40 50 60 1 8760 Time (hours) S ol a r fi e ld e ff ic ie n c y ( % )
Fig. 6. Annual efficiency of the solar field
Figure 7 shows the time evolution of the annual generated power. The annual electricity generation is approximately proportional to the DNI. The maximum power reached is 32 MW. 0 5 10 15 20 25 30 35 1 8760 Time (hours) G ro s s p o w e r o u tp u t (M W )
Fig. 7. Annual power output of the system
Figure 8 shows the variation of the efficiency of the system during the year. The average annual efficiency is about 12%. 0 2 4 6 8 10 12 14 16 18 1 8760 Time (hours) S y s te m e ff ic ie n c y ( % )
7.
Economical study
The economical considerations of utilising the solar energy for electric generation are the most important aspect in selecting the proper technology to be used in any project and location [3]. If appropriate location is chosen, solar thermal power plants will be economically viable options for the production of electricityA major consideration in the assessment of the SEGS viability is the analysis of the cost of the electrical energy produced by the system. The lowest cost of energy produced determines the best choice; however, the lowest cost does not mean the best efficiency.
Power plants are compared upon the basis of their Levelized Electricity Cost (LEC), which depends mainly on the capital cost of the plant, annuity factor, annual operation and maintenance costs, the annual production amount of electricity and the plant life. The capital cost for solar mode only is about 3,008 $/kWe [11] (inflation rate was included), and the operation and maintenance cost is assumed to be 3% of the capital cost. Thus, the LEC of the selected sites is shown in the table2:
TABLE 2. - LEC of selected sites.
Site DNI (kWh/m²yr) Annual electricity production (MWh) LEC ($/kWh) Bechar 2426,14 49139.8 0.19 Timimoune 2255,54 46343.4 0.20 El-Menia 2105,06 42659.1 0.22 Ghardaïa 2097,80 41053.1 0.23
8.
Conclusion
The SEGS VI plant model provides detailed state-property predictions for both solar field and conventional power Rankine cycle during solar-only operation. This model is used for evaluating the daily and annual performance of such plant under Algerian climate. Four sites were investigated: Bechar, Timimoune, El-Menia and Ghardaïa. Bechar's site is recommended based on LEC value. Also, cost reduction along with significant opportunities for reducing the LEC of parabolic trough power plants were mentioned in this paper. Under various realistic scenarios, SEGS plants appear to have the potential to directly compete with fossil power.Unfortunately, the reality is much more complex, thus the determination of an economically optimised project for a given site does not only depend on the solar irradiation but also on many others influencing parameters.Solar Electricity Generating Systems are needed to meet the growing electricity demand and are also well suited for replacing the fossil resources to reduce global emissions.
References
[1] M.A.H. El-Sayed, "Solar supported steam production for power generation in Egypt", Energy Policy
33(2005)1251–1259.
[2] World Energy Outlook, IEA, 2nd edition, Paris, France 2002.
[3] O. Badran, M. Eck, "The application of parabolic trough technology under Jordanian climate", Renewable
Energy, 31(2006)791–802.
[4] M. Geyer, Report on the Solar PACES START Mission to Algeria, September 14-18, 2003.
[5] R. Pitz-Paal, S.A. Jones, “A TRNSYS Model Library for Solar Thermal Electric Components (STEC),” A
Reference Manual, Release 2.2, 2000.
[6] F. Lippke, "Simulation of the Part-Load Behavior of a 30 MWe SEGS Plant", SAND95-1293, Sandia
[7] V. Quaschning, R. Kistner and W. Ortmanns, "Simulation of Parabolic Trough Power Plants", 5th Cologne
Solar Symposium, Cologne, 21 June 2001, pp. 46-50.
[8] A.M. PATNODE, "Simulation and Performance Evaluation of Parabolic Trough Solar Power Plants",
Master of Science thesis, University of WISCONSIN, MADISON, 2006.
[9] David W. Kearney, Charles E. Miller, "SEGS VI: Technical Evaluation of Project Feasibility", Submitted to
Luz Solar Partners VI, January 1988.
[10] N. Blair, R. Cable, S. A. Jones, R. Pitz-Paal, and P. Schwarzboezl, “TRNSYS Modeling of the SEGS VI Parabolic Trough Solar Electric Generating System.”, Proceedings of Solar Forum 2001, April 21-25, 2001, Washington, DC.
[11] H. Price, D. Kearney, "Reducing the cost of energy from Parabolic Trough Solar Power Plants", National
![Fig. 1. Flow diagram for power cycle. The numbered vertical cylinders (#1 – 3, 5 – 6) represent closed feed water heaters, while heater #4 represents the deaerator [8]](https://thumb-eu.123doks.com/thumbv2/123doknet/13347752.402143/4.892.308.595.148.382/diagram-numbered-vertical-cylinders-represent-heaters-represents-deaerator.webp)
