HAL Id: hal-02863272
https://hal.archives-ouvertes.fr/hal-02863272
Submitted on 10 Jun 2020
HAL is a multi-disciplinary open access
archive for the deposit and dissemination of sci-entific research documents, whether they are pub-lished or not. The documents may come from teaching and research institutions in France or abroad, or from public or private research centers.
L’archive ouverte pluridisciplinaire HAL, est destinée au dépôt et à la diffusion de documents scientifiques de niveau recherche, publiés ou non, émanant des établissements d’enseignement et de recherche français ou étrangers, des laboratoires publics ou privés.
Digitization and image-based structure-properties
relationship evaluation of a porous gold micro-electrode
A. Baux, G. Couégnat, G.L. Vignoles, Didier Lasseux, A. Kuhn, C. Carucci,
Nicolas Mano, T.D. Le
To cite this version:
A. Baux, G. Couégnat, G.L. Vignoles, Didier Lasseux, A. Kuhn, et al.. Digitization and image-based structure-properties relationship evaluation of a porous gold micro-electrode. Materials and Design, Elsevier, 2020, 193, pp.108812. �10.1016/j.matdes.2020.108812�. �hal-02863272�
1
Digitization and image-based structure-properties relationship evaluation of a porous gold micro-electrode
A. Baux1*, G. Couégnat2, G. L. Vignoles1*, D. Lasseux3, A. Kuhn4, C. Carucci5, N. Mano5, T.
D. Le6
1
Univ. Bordeaux, Laboratoire des Composites ThermoStructuraux (LCTS), UMR 5801 CNRS, Univ. Bordeaux, CEA, Safran, 3, Allée de la Boétie, 33600 Pessac, France
2
CNRS, Laboratoire des Composites ThermoStructuraux (LCTS), UMR 5801 CNRS, Univ. Bordeaux, CEA, Safran, 3, Allée de la Boétie, 33600 Pessac, France
3
CNRS, Institute of Engineering and Mechanics (I2M), UMR 5295, CNRS, Univ. Bordeaux, Esplanade des Arts et Métiers, 33405 Talence Cedex, France
4
Bordeaux INP, Institute of Molecular Sciences (ISM), UMR 5255, CNRS, Univ. Bordeaux, Bordeaux INP, 16, Avenue Pey Berland, 33607 Pessac, France
5
CNRS, Centre de Recherche Paul Pascal (CRPP), UMR 5031, CNRS, Univ. Bordeaux, 115, Avenue du Dr Albert Schweitzer, 33600 Pessac, France
6
Univ. Lorraine, Laboratoire Énergies et Mécanique Théorique et Appliquée (LEMTA), UMR 7563, CNRS, Univ. Lorraine, 2, Avenue de la Forêt de Haye - 54500 Vandœuvre-lès-Nancy, France
*Corresponding authors. E-mail: [email protected] ; [email protected]
Abstract: The advantage of using porous materials for biofuel cells and biosensors is their
very large internal surface area (where electron exchange takes place) compared to the overall material volume, yielding much larger current densities than on a bare solid electrode of the same size. However, limitations occur because of mass transfer resistance through the pores. We describe here a bottom-up approach to optimize the design of such materials, through the analysis and modeling of their porous structure. Electrodes prepared by replicating stacked Langmuir-Blodgett films, with 1-µm diameter interconnected spherical pores, were studied. Since pore window dimensions are around 100 nm, Focused Ion Beam-Scanning Electron Microscopy (FIB-SEM) has been performed to obtain a 3D reconstruction of the porous medium. Then, a determination of the geometrical characteristics has been achieved through image analysis. The structure of the sphere packing, the shape and size of the connections between spheres, the distances between spheres, the sphere diameters and the specific surface area have been analyzed. The porous medium is close to a face-centered cubic arrangement of spherical pores, but several deviations from ideality are present: missing pores (point defects),
2
stacking errors (dislocations), and incomplete connection between spheres (only 50% of the ideal sphere connections are present). The consequence of such defects on transport are studied through image-based simulations of mass diffusion in the actual porous medium and in similar ideal media.
Keywords: porous material, FIB-SEM, digitization, defects, pore network
Highlights:
Porous gold micro-electrodes were digitized in 3D using Focused Ion Beam /
Scanning Electron Microscopy and image processing.
The morphology and topology of the porous network are described by various
indicators.
The medium derives from a Face-Centered Cubic arrangement of spherical pores,
but it contains defects.
Defects are missing spheres and dislocations ; moreover, only one-half of the
expected connectivity is achieved.
Image-based computations allow quantifying a relatively low impact of the defects
on the effective reactant diffusion coefficient.
1. Introduction
The demand for new technologies of energy harvesting tools, together with the quest of a significant increase of their efficiency, is dramatically increasing, in particular for miniaturized devices. Among them, high performance batteries, bio fuel cells and in vivo
implantable active or passive medical electrical devices are the most important [1,2]. For such
systems, porous electrodes represent a very attractive solution as they allow a very high specific surface where electron transfer takes place while maintaining a small geometric external surface of the device, hence increasing the electrical energy transfer per unit volume. In fact, electron exchange that occurs at the surface of the electrode in contact with the fluid containing the reagents can be significantly enhanced if the area of this interface is increased. From this point of view, the use of a porous medium to form the solid skeleton of the electrode is a very appealing concept as very large ratios of the interface area to the volume of the medium can be achieved. With such materials, electrical currents one or two orders of magnitude larger than those obtained with a classical bare electrode having the same
3
geometrical external dimensions can be obtained [3,4]. Some very interesting techniques,
based on silica bead templates with a Langmuir-Blodgett deposition step followed by electroplating of a conducting material and beads dissolution, have been elaborated to
synthesize porous materials with a typical pore size on the order of the micrometer [5]. Most
of the time, in particular for bio-devices, actual electrode operation relies on complex physical and electrochemical processes that are taking place within the porous structure. These devices operate on the basis of complex enzymatic electrochemical redox reactions coupled to mass
transfer of substrates (glucose and O2) and electron transfer from/to the pore surfaces [6]. The
current pace of development of this type of electrode has been slowed down by a major limitation related to the numerous variables and interrelated factors to be controlled, yielding a broadly empirical approach for the design of such materials. The global performance of the electrode is intimately related to the choice of the reagents and their insertion within the pore structure but, above all, to the architecture of the material at the pore-scale. This contribution is dedicated to a bottom-up approach to optimize the design of porous electrode materials devoted to biofuel cells and biosensors. Recent results obtained with some ideal media representative of inverse opals (replicas of Body-Centred Cubic (BCC), Face-Centred Cubic
(FCC) and Simple Cubic (SC) arrangements of overlapping spherical pores) [7] show that
numerical tools are at hand for a material optimization study. They can be used in a more ambitious virtual material approach that can be implemented with the help of some characterization and numerical tools. Indeed, it is important to better understand what are the possible differences between the idealized porous material that is envisaged through the synthesis technique, i.e. an inverse opal with FCC structure, and the actual one achieved experimentally, and what is the impact of such differences on the performances of the materials. Next, having a realistic numerical representation of an actually achievable material will be a precious guide to the design and optimization of its architecture.
A determination of the geometrical characteristics of the porous medium can be achieved through image acquisition and analysis. Since pore dimensions of the porous electrode lie around 1000 nm, three techniques may be envisaged: i) X-ray tomographic imaging is possible using nano-tomography. Porous gold electrodes have been successfully characterized
with this technique [8]. ii) Transmission Electron Microscopy (TEM) tomography is also
reported as a technique giving access to the 3D arrangement of spherical objects in an opal or
inverse opal [9], and of pores in foams [10]. iii) Focused Ion Beam-Scanning Electron
4
and meso-scale structures. With FIB-SEM, the specimen surface is stripped by an ion beam and imaged by a SEM installed orthogonally to the FIB. The lateral resolution is governed by the SEM, while the depth resolution, i.e. the FIB milling direction, is determined by the
thickness of the stripped thin layer [11]. This method has been employed in the literature for
digitizing nanomaterials [12-14]. For instance, Holzer et al. used FIB-SEM to analyse the
nanostructure of a porous BaTiO3 ceramic with a high volume fraction of fine porosity [15].
Since the end of the last millennium, FIB-SEM has progressively found use in biological research in order to cut open and get access to internal biological structures or to prepare thin
lamella for imaging [16]. This method has been also used to study nanostructural
modifications of Li-ion battery cathodes during electrochemical cycling [17] or for the 3D
reconstruction of a porous electrode for fuel cell [18]. Terao et al. [19] have developed an
accurate method for 3D reconstruction of microstructures to analyse mass transport phenomena in microporous layers (MPLs). The proposed method involves the use of FIB-SEM tomography. Numerical calculations of the structural and mass transport properties of MPLs were conducted using the reconstruction results and these computations were found to be in good agreement with experimental results, demonstrating the accuracy of this method. However, it has to be noted that, in FIB-SEM studies, specific image processing procedures
may need to be developed [20].
In the present work, the choice has been made to use the FIB-SEM technique, as it is compliant with the image resolution accuracy and quality required to characterize the porous gold electrodes. The idea here is to numerically characterize the distribution of the spherical pores of the electrode. To have the highest possible specific surface area, it is necessary to get
a pore arrangement as close as possible to an FCC packing, with a solid fraction of 74 % [21].
Throughout this work, the gap between the ideal network and the real material is analysed, in terms of microstructure, and its influence on the mass transfer properties will be studied. This is made possible thanks to the collection and thorough analysis of a large amount of geometrical, morphological and topological data, unprecedented to our knowledge for this type of inverse opal-like materials. In a first part, the image acquisition and processing methods is presented. Then, the morphology and topology of the porous network is described by various indicators. Finally, image-based computations allow evaluating the impact of the defects on the effective mass transfer properties.
5
2. Porous gold electrode synthesis and image acquisition
The porous electrodes were made using the Langmuir Blodgett technique [22]. A colloidal
template of monodisperse silica beads with a diameter of around 1.1 µm was deposited layer
by layer on a cylindrical gold wire with a diameter of 250 µm [23]. Templating was followed
by electrodeposition of a conducting material (gold) [24]. Finally, the silica template was
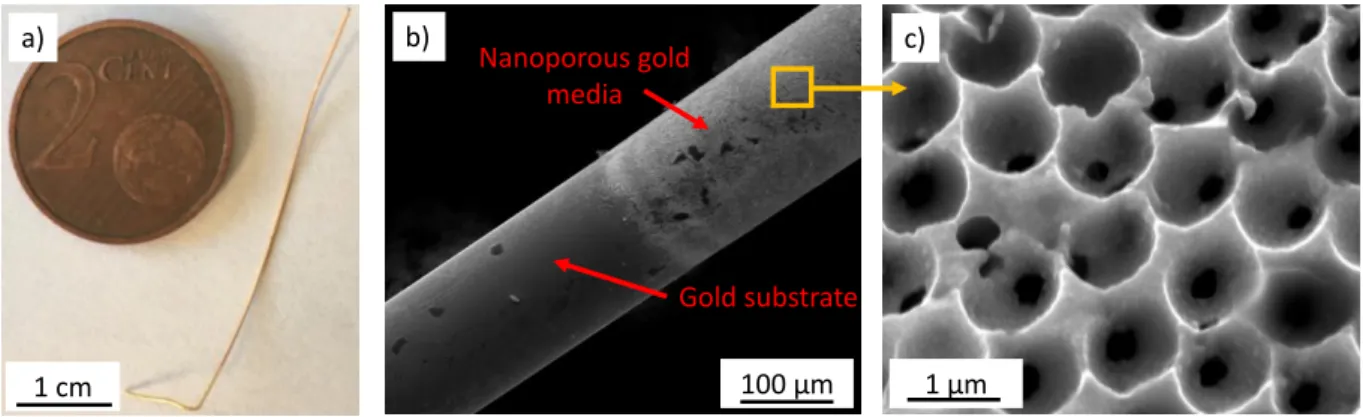
dissolved with hydrofluoric acid (5 min), leaving interconnected open pores. A macroscale photograph of the resulting porous gold electrode with 1.1 µm diameter pores (around 4 cm
long) is represented in Fig.1.a. Additionally, a Scanning Electron Microscope (FEI Quanta
400 FEG, equipped with both Secondary Electron (SE) and back-scattered electron (BSE)
detectors) was used to observe the surface of the porous gold medium (Fig.1.b,c). The
structure contains some degree of disorder due to local arrangement defects; radii of the windows connecting the pores are also locally variable.
The first step of the work discussed hereafter is to obtain a 3D image of a part of the porous gold media. Since pore dimensions are lying around 1000 nm, FIB-SEM has been preferred.
Fig. 1. (a) photograph of the gold electrode, (b) SEM image (Secondary Electron, SE) showing the difference of the microstructure between the substrate and the porous zone, (c) SEM image (SE) of the porous zone.
The FIB-SEM instrument uses a localized ion beam to progressively erode the selected sample. Its FIB column is used to achieve very flat surfaces of a sample for later submission to a SEM imaging process. In addition, FIB imaging can be used to image the sample directly by detecting electrons emitted either by the ion beam or the electron beam. For a given sample volume, the goal is to obtain as many images as possible of the progressively polished surface to increase the quality of the 3D reconstruction. In the present case, the analysis was carried out at the “Centre de micro-caractérisation Raymond Castaing” in Toulouse. We used a Helios NanoLab600i (ThermoFisher - FEI) double beam microscope combining a field emission electron gun (FEG) and a gallium ion column capable of delivering up to 65 nA of
1 µm 1 cm Gold substrate Nanoporous gold media a) b) c) 100 µm
6
current at 30 kV. The analyzed volume of the porous gold electrode is around 253 μm3. Six
hundred successive polished surface images were acquired with a spacing of 25 nm, for a total acquisition time of 14 h. As a result, only a very small part of the porous network out of the 4 cm long electrode could be observed. The maximum resolution of the images is 12.5 nm/voxel. Some analyses were performed on sub-sampled images (25 nm/voxel). The main expected difficulty was the possible crushing of the pore walls during the ion beam polishing step. However, this phenomenon was not observed. The first step is to protect the area of interest in order to limit the damage caused by the gallium ion beam. To do so, a 1 µm protective platinum layer is deposited on the electrode surface. Then, the high-resolution image series could be acquired. An example of a SEM cross-section image, obtained after ion
beam cutting, is reported in Fig 2.a. In Fig 2.b, it can be seen that a significant number of
spherical pore walls contain holes, which indicated the existence of connections between them.
Fig.2. (a) example of a cross section obtained by FIB-SEM analysis, showing the platinum (Pt) protective layer (b) zoom on figure (a) highlighting connections between spheres through holes (red dots).
After acquiring the image stack, some processing was carried out to reconstruct the 3D porous network. The series of 600 images was realigned to compensate (i) the angle between the FIB and SEM columns (52°), (ii) the drift encountered during acquisition (due to temporary loss
2 µm
1 µm
a)
b)
Pt layer
holes
7
of focus, environmental problems, ...), and (iii) a difference of resolution in the plane and depth of the image (parallelepipedic pixels). Realignments were performed using the method
described by Wierzbicki et al. [25], implemented in the Fiji [26] freeware in the
« stackreg » and « transformJ » plug-ins. To improve the final quality of the images, a bilateral filter was used.
3. Segmentation of the images and morphological analysis
The second step is to segment pores and the solid phase in the SEM images. In the present case, a classical thresholding is not well adapted. Indeed, images do not correspond to serial sections and there is an important depth of field: this would result in “shine-through” artifacts
[20]. Hence, segmentation by learning, using the free software Ilastik [27],was performed
on the 600 2D images of the stack, in a short CPU time after a brief training phase (Fig. 3).
Ilastik has the capability to perform the segmentation process in a full 3D manner. Yet, in our work, the segmentation process has been performed slice by slice, i.e. using only 2D information. Each expected phase is initially informed using a rough manual labelling (see e.g. Fig 3a). Then, a limited number of descriptors are selected (related to the local value of gray level and its derivatives, i.e. gradient, Laplacian, Hessian) and are convoluted with Gaussian filters of increasing size. Based on the manual segmentation and on these descriptors, Ilastik learns an optimal classification using a decision tree approach, here using a random forest algorithm.
The unlabelled pixels are then classified using the learned decision tree.
The manual input can be very sparse (Fig 3a). In our particular case, it was sufficient to annotate only a single slice, before successfully applying the segmentation to the 599 remaining slices. A final post-processing was achieved with an opening (erosion-dilation) to eliminate isolated pixels.
Fig.3. (a) example of hand-made operation required to train the Ilastik software to segment an SEM image (blue: solid, yellow: pores), (b) results of the segmentation by learning on the same slice.
8
The last step of the process was to collect the 3D reconstruction of the porous network by assembling all the successive segmented cross-sections. To do this, a home-made Python script was developed on purpose. After a hole-filling morphological operation, the 3D image was labelled. In order to analyze each entity separately, a watershed operation is performed
[28]. The Sub-Network of the Oversegmented Watershed (SNOW) method published by
Gostick [29], was employed together with the “SciPy” [30] and “SciKit-Image” [31]
Python modules. The SNOW method has the advantage of eliminating useless maxima of the distance image; moreover, it allows working with labels during watershed segmentation. After border cleaning (deletion of the unexploitable zones such as platinum coating and incomplete spheres), removal of small volumes (connected subsets with a volume less than a given critical value, corresponding to the third of the average volume of the labelled entities), and relabeling the remaining subsets, the digitized image is considered as ready for subsequent statistical analysis. The analysed pore space forms a single connected set, i.e. all the pores are fully in contact. Isolated pores, which indeed correspond to segmentation artefacts or border effects, i.e. incomplete spheres, were removed before the subsequent
morphological analysis. Due to the non-ideal segmentation (cf. Fig. 3.b where all the pores
are not perfectly segmented), the porosity of the initial porous network is underestimated
(network = 0.62).
This porous network was decomposed in 819 exploitable subsets which roughly correspond to each of the original silica beads from which the structure was templated. Each subset was assimilated to a sphere of equivalent volume and can be analyzed separately. The average
volume of these spherical pores is 0.75 ± 0.02 µm3
(with a resolution of the image of
12.5 nm per voxel). The average equivalent radius of the spheres is 560 ±
15 nm, i.e. a diameter of about 1.12 ± 0.03 μm (Fig.4). This value is in close match with the
experimental data: a monodisperse distribution of silica beads with a mean diameter of 1.20 ±
9
Fig. 4. Distribution of the diameters of the spheres.
From the obtained segmentation in labeled spheres, and using the tools reported in [29], it was
also possible, to delineate the throats between the pores, i.e. what is usually referred to as the pore “windows” or “connections”. Their number, shape and morphology are paramount parameters for the quantification of mass transfer. The average number of connections per sphere was also computed. All the calculations were performed on the overall image; however, to avoid bias and get accurate values, the spheres at the edges of the image were discarded. In the entire image, 2557 connections were detected and the average number of
connections per sphere network is 6.51 ± 1.90 (Fig. 5). In an ideal FCC packing, the
coordination is expected to be 12. A smaller number is the sign of the presence of defects such as vacancies and dislocations, resulting from the Langmuir-Blodgett process and from
the gold electrodeposition step. In Fig. 6, 3D representations of the porous network structure
are reported. In Figs. 6.a,b, all the connections between spheres are represented, while, in fig.
6.c the different labelled entities are shown. The different layers of spheres resulting from the
Langmuir-Blodgett process can be easily distinguished in this figure. The typical FCC
off-plane alignment is also clearly visible (Fig. 6.c). The top view (Fig. 6.b) shows that the
perfect hexagonal packing in the layers is not entirely respected.
0 50 100 150 200 250 300 350 [1,08 ; 1,09[ [1,09 ; 1,10[ [1,10 ; 1,11[ [1,11 ; 1,12[ [1,12 ; 1,13[ [1,13 ; 1,14[ [1,14 ; 1,15[ [1,15 ; 1,16[ Nu mb e r of sp h e re s Spheres diameter (µm) 1.085 1.095 1.105 1.115 1.125 1.135 1.145 1.155
10
Fig. 5. Distribution of the number of connections network per sphere for the initial porous network.
Fig. 6. Representation of the connections between spheres (a) viewed perpendicular to the spheres stacking direction, (b) in top view, (c) 3D reconstruction of the porous network, with a typical FCC off-plane alignment highlighted in yellow.
The difference between the number of connections and neighbors is visually confirmed by
Fig. 7 which represents a cross-section of one of the five bead layers. In an ideal compact
layer, the in-plane coordination number is 6, whereas in this example only 2 to 4 in-plane
connections are visible. Some vacancies and dislocation cores are highlighted in fig. 7.a. The
distribution of the distances to the connected neighbors of each subset was also studied (Fig.
8). This amounts to calculating the length of the segments associated to the 2557 connections
between spheres in Figs. 6.a,b, i.e. the center-to-center distances between connected spheres.
Actual medium Spher es s tacki ng di rect ion a) b) Typical FCC off-plane alignment c)
11
The average distance is 1.21 ± 0.08 µm, which is roughly 0.1 µm larger than the computed mean sphere diameter. To analyze the orientation of the connections in details, the distribution was separated into two subsets corresponding respectively to the in-plane connection lengths of a bead layer (equatorial connections) and the out-of-plane connection lengths (polar
connections) (Fig. 9.).
Fig. 7. (a) cross-section of a sphere layer, showing the arrangement defects, (b) zoom showing the difference between the number of connections per sphere and the number of neighbors.
Fig. 8. Distribution of the connection lengths between the spheres.
The mean length of the equatorial connections is 1.18 µm ± 0.08, smaller than the mean length of the polar connections which is 1.24 µm ± 0.08 µm. This analysis confirms a deviation from an ideal FCC stack for which all the connections would have the same length.
In Fig. 10, the lengths of all the connections are represented as a function of the out-of-plane
component. In a perfect FCC stack, the angle between all the connections is 60°, which
6 close neighbors but only 2 connections Arrangement defects: essentially vacancies Dislocation cores
a)
b)
1 .15 1.25 1.35 1.45 1.55Length of the connections (µm)
0.40 0.35 0.30 0.25 0.20 0.15 0.10 0.05 0 Freque ncy (%)
12
corresponds to out-of-plane components of and . In our case, the distribution is quite
close to these values. But as seen in Fig.10.b, the difference between the equatorial and polar
connection lengths causes shifts between beads layers.
Fig. 9. Distributions of (a) equatorial and (b) polar connection lengths.
Fig. 10. Statistical representations of the connections between spheres. (a) Scatter plot of the connection lengths vs. their polar angles, (b) 3D representation of the density of connections vs. their orientations.
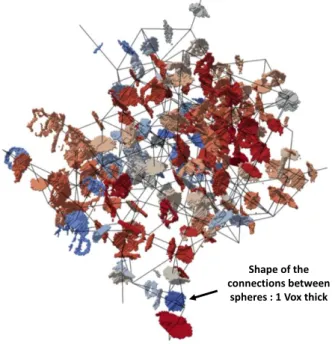
Still following the methods proposed by Gostick [29], it is also possible to extract the shape
of the “connections” between the spherical pores, performing a morphological dilation of the surface of the connections by one voxel. The type of representation that can be obtained on a
sub-image (only 142 connections) is shown in Fig. 11. A distribution of the surface of the
connections was produced on the entire image (Fig. 12.) from which the average surface, Sc,
was deduced. Considering the connections as disks, the value of their average equivalent
radius, , is 195 ± 25 nm, i.e. is approximately 35 % of the equivalent radius of
the spheres ( . This surface of the window S
c is a paramount parameter for the
≤ 2 0 .3 7 (2 0 .3 7 , 2 0 .9 5 6 6 6 6 6 7 ] (2 0 .9 5 6 6 6 6 6 7 , … (2 1 .5 4 3 3 3 3 3 3 , 2 2 .1 3 ] (2 2 .1 3 , 2 2 .7 1 6 6 6 6 6 7 ] (2 2 .7 1 6 6 6 6 6 7 , … (2 3 .3 0 3 3 3 3 3 3 , 2 3 .8 9 ] (2 3 .8 9 , 2 4 .4 7 6 6 6 6 6 7 ] (2 4 .4 7 6 6 6 6 6 7 , … (2 5 .0 6 3 3 3 3 3 3 , 2 5 .6 5 ] (2 5 .6 5 , 2 6 .2 3 6 6 6 6 6 7 ] (2 6 .2 3 6 6 6 6 6 7 , … (2 6 .8 2 3 3 3 3 3 3 , 2 7 .4 1 ] (2 7 .4 1 , 2 7 .9 9 6 6 6 6 6 7 ] (2 7 .9 9 6 6 6 6 6 7 , … (2 8 .5 8 3 3 3 3 3 3 , 2 9 .1 7 ] > 2 9 .1 7 0 50 100 150 200 250 300 Equatorial lengths ≤ 2 1 (2 1 , 2 1 .4 6 6 6 6 6 6 7 ] (2 1 .4 6 6 6 6 6 6 7 , 2 1 .9 3 3 3 3 3 3 3 ] (2 1 .9 3 3 3 3 3 3 3 , 2 2 .4 ] (2 2 .4 , 2 2 .8 6 6 6 6 6 6 7 ] (2 2 .8 6 6 6 6 6 6 7 , 2 3 .3 3 3 3 3 3 3 3 ] (2 3 .3 3 3 3 3 3 3 3 , 2 3 .8 ] (2 3 .8 , 2 4 .2 6 6 6 6 6 6 7 ] (2 4 .2 6 6 6 6 6 6 7 , 2 4 .7 3 3 3 3 3 3 3 ] (2 4 .7 3 3 3 3 3 3 3 , 2 5 .2 ] (2 5 .2 , 2 5 .6 6 6 6 6 6 6 7 ] (2 5 .6 6 6 6 6 6 6 7 , 2 6 .1 3 3 3 3 3 3 3 ] (2 6 .1 3 3 3 3 3 3 3 , 2 6 .6 ] (2 6 .6 , 2 7 .0 6 6 6 6 6 6 7 ] (2 7 .0 6 6 6 6 6 6 7 , 2 7 .5 3 3 3 3 3 3 3 ] (2 7 .5 3 3 3 3 3 3 3 , 2 8 ] > 2 8 0 50 100 150 200 250 300 Polar lengths 1.00 1.03 1.06 1.09 1.12 1.15 1.18 1.21 1.24 1.27 1.30 1.33 1.36 1.39 1.42 1.45 1.48 Equatorial connections 300 250 200 150 100 50 0 1.00 1.03 1.06 1.09 1.12 1.15 1.18 1.21 1.24 1.27 1.30 1.33 1.36 1.39 1.42 1.45 1.48 Polar connections 300 250 200 150 100 50 0 N u m b e r o f co n n ec ti o n s N u m b e r o f co n n ec ti o n s a) b) Length (µm) Length (µm) 1.52 1.42 1.32 1.22 1.12 1.02 Le n gth of the c on n e ctio n s (µ m) -1 -0.75 -0.5 -0.25 0 0.25 0.5 0.75 1 Out-of-plane component x y z a) b) Shift between planes FCC FCC FCC
13
evaluation of mass transfer capability of the network. The variation of the normalized
window’s diameter, dc/ds (where ds is the sphere diameter) as a function of the normalized
distance between the centers of two spheres a/ds is represented in Fig. 13. For example, a
normalized connection size of 0.15 yields a/ds = 0.989, and for 0.30, a/ds = 0.954.
Fig. 11. Representation of the shape of the connections between spheres on a sub-image (with only 142 connections) of the initial porous network.
Fig. 12. Distribution of the surface of the connections between the spheres of the initial porous network. Shape of the
connections between spheres : 1 Vox thick
10 20 30 40 Surface (Vox²) Fr ac ti on (%)
14
Fig. 13. Normalized window size as a function of the normalized distance between the centers of two connected spheres.
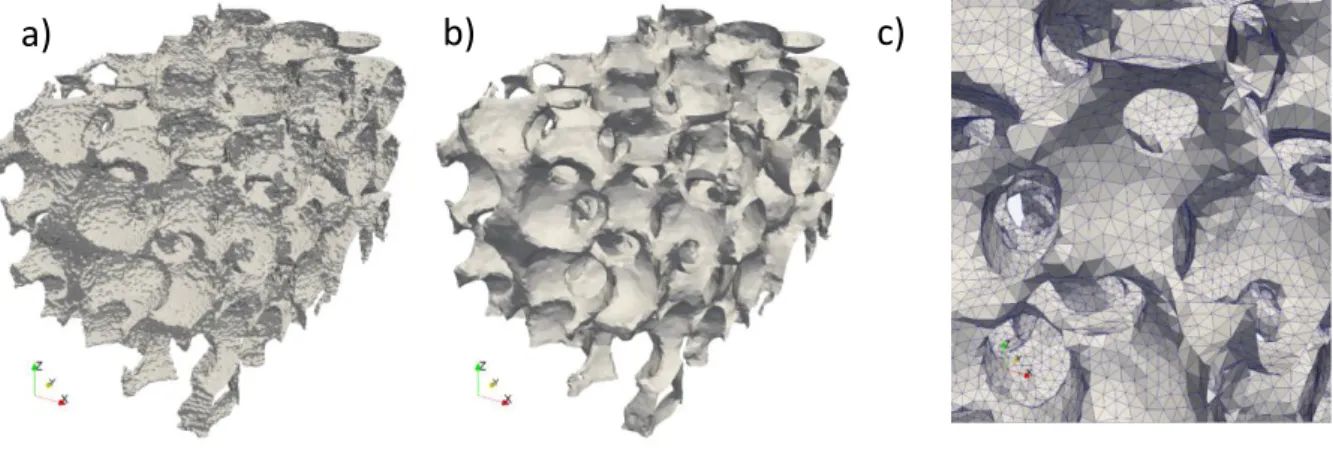
Only 3 % of difference between the distances (or the diameters of the spheres) is necessary to have a variation from 15 % to 30 % of the normalized diameter of the connections. For spheres of about 1 µm, this makes a variation of 30 nm, which is roughly the image resolution. The size of the connections estimated by image analysis is therefore quite sensitive to the segmentation that is made (in addition to the "rough" aspect of the detected surfaces). Another important parameter for the quantification of the electrode performance is the specific surface area. The larger the surface, the better the electron transfer, unless diffusion limitation occurs. In order to compute the specific surface area of the porous network, three steps are necessary: (i) the iso-surface is extracted with a simplified marching cube (SMC)
method [32] (Fig. 14.a); (ii) the total surface mesh is re-discretized (smoothed) by applying a
Hausdorff distance correction algorithm [33] and converted using the “mmg” module [34].
Fig. 14. (a) Extraction of the iso-surface by a Simplified Marching Cube algorithm, (b) smoothed surface after remeshing, (c) zoom on a part of the surface mesh.
To alleviate the effect of the unwanted "roughness" of the isosurface, we performed a remeshing of the initial pixel-wise mesh obtained by the marching cube algorithm, again
dc /ds
a/ds
c)
15
using the “mmg” software. The smoothing level is controlled by setting a maximal Hausdorff distance
parameter that imposes the maximal distance between the piecewise linear boundary representation (i.e. the smoothed mesh) and the reconstructed ideal boundary obtained by locally fitting a quadratic surface to the initial isosurface. Here, we have smoothed the isosurface using increasing values of the Hausdorff parameter, until the value of the surface area did not vary significantly (∆S/S < 0.5%). All the reported values of surface area have been obtained using a value of 7 voxels for the Hausdorff parameter, which was sufficient to remove the roughness of the marching cube output while keeping features with
larger wavelength. At this stage, the surface mesh is created (Fig. 14.b); (iii) finally, all
triangle areas forming the mesh (Fig. 14.c) are summed up. Considering the entire image, the
calculated specific surface area is 4.13 ± 0.30 μm-1
. This value is to be compared to the experimental specific surface area obtained experimentally from electrochemical
measurements which is 4.02 ± 0.41 µm-1. This is in excellent agreement with the value
computed from the image, the slight difference resulting from the large roughness of the initial image.
In summary, the main porous network features can be described as follows: (i) the structure derives from an FCC stack, including the characteristic A-B-C-A layer stacking pattern, (ii) defects are present in the quasi-compact layers: dislocation cores (cycles with 5 spheres) or vacancies (cycles with 6 spheres), or bi-vacancies, (iii) spherical pores are only partly connected to each other: roughly 1 connection every 2 neighbors; (iv) the connection windows have an equivalent radius roughly 1/3 of the sphere radius.
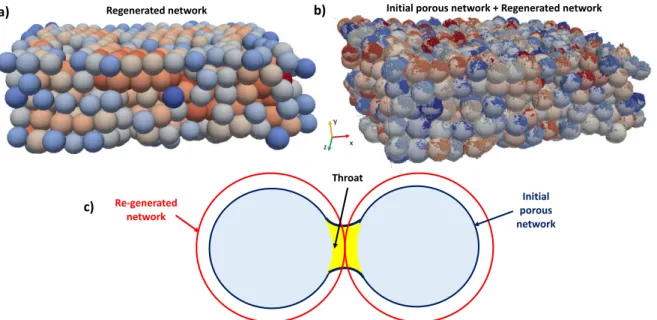
From the list of all sphere center positions and radii, it is possible to generate a stack of
perfect spheres arranged exactly as in the actual 3D image (Fig. 15.a). We assimilate each of
the 819 entities (of the initial porous network) to a sphere whose center is at the mass center of the entity and which has the same volume as the entity. Due to the large numerical roughness observed on the initial image, it was not possible to generate a network of perfect spheres having the same specific surface area as the initial porous network. The volume equivalence is less sensitive to the presence of undesired blobs resulting from segmentation errors. With this approximation, the volume of the regenerated spheres is greater than the actual volume of the beads because the throats between the spheres are integrated in the
volume of the regenerated spheres (Fig. 15.c). However superimposing the initial porous
16
Fig. 15. (a) Numerically regenerated spheres stacking, (b) superposition between the initial and the regenerated networks, (c) schematic representation of throats suppression.
The same analysis has been performed on this “modified” porous medium. The porosity is
= 0.787, larger than an ideal FCC stack without inter-penetration of spheres (74 %) as a
result of dislocation cores and vacancies. As expected, the mean equivalent radius of the
spheres is about 668 ± 17 nm, i.e. a diameter of about 1.34 ± 0.03 μm, larger than the
mean pore radius of the initial porous network. The connection distribution of the regenerated
network (Fig. 16) is quite similar to that of the initial porous network (cf. Fig. 5). In this case,
the number of connections rege is 6.84 ± 2.20. For this regenerated network, the mean
normalized connection size ( ) is 0,435. Note that some 5% of the connections have
been lost during this reconstruction procedure. To compute the specific surface area of the regenerated network, a mesh was created with the same procedure as before (see fig. 14). It
contains 5,566,527 triangles and 26,325,391 elements (Fig.16 .b). As was also expected, the
specific surface area is 2.02 ± 0.30 μm-1, smaller than the value for the initial porous
network. a) b) v Throat Initial porous network Re-generated network
Regenerated network Initial porous network + Regenerated network
17
Fig. 16. Distribution of the number of connections network per sphere for the regenerated porous network
In Table 1 a summary of the morphological properties of both the initial and regenerated networks is reported.
Table. 1. Morphological properties of the initial porous and regenerated networks.
Network Porosity Mean sphere radius (nm) Number of connections Connections equivalent radius (nm) Specific surface area (µm-1) Initial 0.620 562 ± 15 6.5 ± 1.90 195 ± 25 4.13 ± 0.30 Regenerated 0.787 668 ± 17 6.84 ± 2.20 288 ± 96 2.02 ± 0.30
This regenerated network can be used to compare its properties with those of an ideal FCC stack. Knowing the sphere volume, the specific surface area, the porosity and the mean normalized connection size between spheres, it is possible to generate perfect FCC stacks with morphological properties similar to the regenerated network. The first perfect FCC stack (FCC-1) has the same porosity and the same mean sphere radius, but has a different normalized connection size (20.75 % instead of 43.5 % for the regenerated network) and
specific surface area (3.03 µm-1 using the mesh in Fig.17.c instead of 2.02 µm-1). The second
perfect FCC stack (FCC-2) has the same specific surface and porosity as the regenerated network, but has a different sphere mean radius (1037 nm) and normalized connection size (20.75 %). Finally, the third perfect FCC stack (FCC-3) has the same specific surface and mean radius of the spheres as the regenerated network, but has a different porosity (0.910) and
normalized connection size (41.2 %). All the properties are described in Table. 2. The idea is
to compare the diffusion properties between the regenerated network and the ideal FCC stacks.
18
Table 2. Morphological properties of the perfect FCC stacks.
Network Porosity Mean sphere radius (nm) Normalized connection size (%) Specific surface area (µm-1) Regenerated 0.787 668 43.5 2.02 FCC-1 0.787 668 20.75 3.03 FCC-2 0.787 1037 20.75 2.02 FCC-3 0.910 668 41.2 2.02
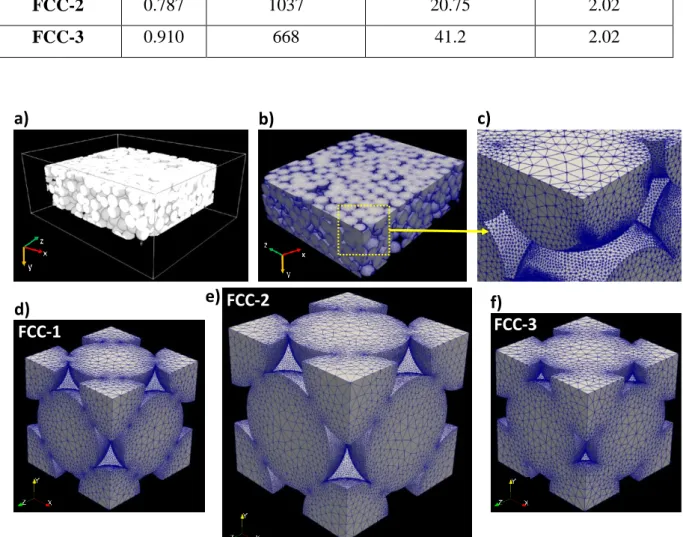
Fig. 17. (a) 3D representation of the regenerated network, (b) 3D representation of the corresponding 3D mesh, (c) zoom on a part of this mesh, (d,e,f) meshes of ideal unit cells FCC-1, FCC-2, FCC-3, respectively.
a) b) c)
d) e) f)
FCC-1 FCC-3
19
4. Computation of the effective diffusion coefficients
The effective diffusive transport properties of the actual porous network, the re-generated network and the three perfect simulated FCC arrangements were computed for sake of comparison. The quantity of interest for such a comparison is the dimensionless effective
diffusivity :
,
where is the average diffusion coefficient obtained in the computation and is the
liquid-phase diffusion coefficient. It is common practice to state that:
where is the porosity, is the “tortuosity factor for binary diffusion” and is the
“formation factor” [35]. The tortuosity factor, , is usually larger than 1 [36] and many
authors propose that where is the geometrical tortuosity, i.e. the ratio of the total
length of a tubular pore to its end-to-end straight distance, if a tubular pore can be defined to
represent the porous medium [37,38]. This approach may be valid for an empirical estimate of
the diffusion coefficient in an isotropic structure. However, the purpose here is to perform a more accurate determination of the (tensorial) effective diffusivity. This is carried out by
employing the Monte-Carlo/Random Walk (MC/RW) technique [39] . The tensorial effective
dimensionless diffusivity is obtained as the limit, for many walkers and long walk times, of the covariance matrix of the centered displacements , divided by the walk time, according to
Einstein’s formula [40,41]:
the factor appearing here because walkers are only allowed in the fluid part of the image.
Ito-Taylor random walks were used, in which every space step is computed according to
[42]:
where is the time step and is a vector of 3 random centered Gaussian deviates with unit
variance. The random walkers were only allowed to move in the fluid phase of binarized images and the solid/void interface was discretized according to the Simplified Marching
Cube method [43]. This algorithm was used in diffusion/surface reaction/ablation simulations
20
simulations of chemical vapor infiltration (CVI) [45]. A specific handling of walker
reintroductions after exiting the image by one face allows implementing a “weak periodicity”
boundary condition [39] , in which only the global flow exiting a given image boundary is
equated to the global flow entering the opposite boundary, instead of specifying a node-to-node flux or concentration equality in traditional numerical methods for homogenization or volume-averaging. The advantage is that averaging on non-periodic images can be performed without artificial alignment of the eigendirections on the principal axes (as obtained when applying symmetry boundary conditions) nor flux modifications linked to the superposition of non-identical opposed faces (as obtained when applying periodic boundary conditions). For the computation, 25,000 random walkers were used in the fluid phase, i.e. in the
connected spheres, walking through the images during a dimensionless time = 1.2 (where
is the image edge size). One third of the total height of the electrode was enough to obtain converging results. The resulting tensors were analyzed and the eigenvalues and eigenvectors of the principal transport directions of fastest, intermediate and slowest heat transfer were obtained.
Results are presented in Table 3. For the initial porous network, as explained previously and
due to the non-ideal segmentation, the pore volume fraction is underestimated. This can be explained by the large surface roughness and the presence of residual “solid” islands in the
void spheres (Fig. 18.), which slow down diffusion throughout the porous network.
Table 3. Computed diffusive transport properties of the actual porous network, of the regenerated network and of the perfect FCC arrangements. “(x,y)” means that the eigenvector has a large x component and a non-negligible y component. Effective dimensionless fluid diffusivity (± 0.05) Anisotropy ratio Eigenvectors Pore vol.
fraction Dir1 Dir2 Dir3
Dir2/ Dir1
Dir3/
Dir1 slow mid fast Initial porous network 0.620 0.26 0.27 0.30 1.04 1.15 (z,y) (y,z) x Re-generated network 0.787 0.51 0.57 0.58 1.12 1.14 y (x,z) (z,x) FCC-1 0.787 0.55 0.55 0.55 1 1 Isotropic FCC-2 0.787 0.49 0.49 0.49 1 1 Isotropic FCC-3 0.910 0.74 0.74 0.74 1 1 Isotropic
21
This is not the case for the regenerated network where the roughness is close to zero and the interior of the spheres is void. In this case, the pore volume fraction is very close to that
obtained in the previous analysis and, as can be seen in Fig. 19.b, random walkers can easily
diffuse throughout the porous space. Consequently, the hindrance on diffusion is essentially due to the porosity and connectivity effects. A mild diffusion anisotropy is observed, with only a 14 % increase of diffusivity in the fastest direction with respect to the slowest one. The
eigenvectors are plotted in Fig. 19.a. As expected, diffusion is slower in the spheres stacking
direction (‘y’) and the fastest direction almost coincides with an alignment of spherical pores (dotted line in the figure). The intermediate direction has an eigenvalue very close to the fastest one, denoting a quasi-isotropy in the directions perpendicular to the original beads
stacking.
Fig. 18. An example of random walk in the initial porous network.
22
Fig. 19. (a) Regenerated network used for mass transfer calculation with principal transport directions. The dotted line highlights a direction of spherical voids alignment. (b) Example of a random walk through the regenerated network.
This is to be compared with the perfect simulated FCC arrangements, where diffusion is isotropic. The values for the regenerated network are very close to those for 1 and FCC-2. The results for the ideal FCC packings agree with the work of Le et al. which reported the variation of the normalized effective diffusion coefficient versus the pore connection window
size for a perfect FCC stack [7]. The effective dimensionless fluid diffusivity of FCC-3 is
larger than that of the regenerated network. This can be explained by the much larger porosity of this arrangement.
Summarizing the results, it is confirmed that the regenerated network derives from an FCC stack of spherical pores, but contains some defects and features only one-half of the expected connectivity. Rather counterintuitively, this lack of local connectivity does not induce a significant impact on the effective mass transfer properties. This suggests that an ideal FCC packing, having the same porosity as the actual structure, maybe a relevant representation to determine its effective diffusivity. Anisotropy maybe accounted for by considering an arrangement that remains periodic but departs from the FCC structure. The effect of the pore surface roughness, which was disregarded during the regeneration of the network using equivalent spheres, requires more attention as its impact on the specific surface area, and hence on the redox reaction process, is expected to be of major importance.
5. Conclusion
23
A bottom-up approach to optimize the design of porous materials for biofuel cells and biosensors was described in this work, through the analysis and modeling of their porous structure and transport properties. Gold electrodes with 1.1-µm diameter interconnected spherical pores in an inverse opal structure were studied. Firstly, 2D images of the porous electrode were acquired by FIB/SEM analysis. After several steps of image processing, a 3D reconstruction of the gold porous electrode was obtained. A numerical morphological analysis allowed obtaining the porosity, the bead size distribution, the orientation of the stacking defects, the number, size and shape of the connections between spheres and the specific surface area of the porous material. From this information, it was possible to generate a stack of perfect spheres arranged exactly as in the 3D image of the real electrodes. It was shown that the regenerated network derives from an FCC stack of spherical pores, but it contains some defects (vacancies and dislocation cores) and has only one-half of the expected connectivity. The effective solute diffusivity in the real material was computed and compared with three perfect FCC stacks having similar morphological indicators, showing a large similarity in particular in terms of the effective diffusivity coefficients, even though the connectivity between pores is much less, highlighting that the effect of porosity is of major importance.
Next steps of this work will be to carry out some electrochemical calculations on 3D meshed images (initial and regenerated networks, as well as perfect FCC stacks) in order to confirm that the distribution of the porous network can be assimilated to that of a perfect FCC stack. In particular, the effect of the specific surface area, related to the pore roughness, will have to be addressed while modeling the reactive process. It would be also interesting to analyze the influence of the pore size distribution on the mass transfer properties.
Finally, this study has revealed that it is possible to push further an optimization process on
the electrode structure. The design can involve variations of the pore size, including in a single electrode, i.e. with porosity gradients. The present results show that starting with idealized views of the envisaged structure can suffice to produce interesting evaluations of the performance of the electrode; however, computer generation of faulted, quasi-close packings
of spheres being available [46,47], more realistic virtual electrodes can be created and tested.
ACKNOWLEDGEMENTS
This work was financially supported by ANR (French National Agency for Research) in the framework of the MOMA (Modeling of porous electrodes for an Optimized MAterial design)
24
project (ANR-17-CE08-0005) through a Post-doc grant to A. B. The authors are grateful to C. Josse from the Institute of Micro-characterization Raymond Castaing in Toulouse, for FIB-SEM images acquisition.
REFERENCES
[1] X. Xiao, H. Xia, R. Wu, L. Bai, L. Yan, E. Magner, S. Cosnier, E. Lojou, Z. Zhu, A. Liu, Tackling the challenges of enzymatic (Bio) fuel cells, Chem. Rev. 119 (2019) 9509-9558.
[2] N. Mano, A. de Poulpiquet, O2 reduction in enzymatic biofuel cells, Chem. Rev. 118
(2018) 2392-2468.
[3] A. Walcarius, A. Kuhn, Ordered porous thin films in electrochemical analysis, Trends in Anal. Chem. 27 (2008) 593-603.
[4] R. Szamocki, S. Reculusa, S. Ravaine, P. N. Bartlett, A. Kuhn, R. Hempelmann, Tailored mesostructuring and biofunctionalization of gold for increased electroactivity, Angew. Chem. Int. Ed. 45 (2006) 1317–1321.
[5] J. Elias, M. Gizowska, P. Brodard, R. Widmer, Y. DeHazan, T. Graule, J. Michler, L. Philippe, Electrodeposition of gold thin films with controlled morphologies and their applications in electrocatalysis and SERS, Nanotechnology, 23 (2012) 255705-255713.
[6] L. Zhang, C. Carucci, S. Reculusa, B. Goudeau, P. Lefrançois, S. Gounel, N. Mano, A. Kuhn, Rational design of enzyme-modified electrodes for optimized bioelectrocatalytic activity, ChemElectroChem. 6 (2019) 4980-4984
[7] T. D. Le, D. Lasseux, X. P. Nguyen, G. L. Vignoles, N. Mano, A. Kuhn, Multi-scale modeling of diffusion and electrochemical reactions in porous micro-electrodes, Chem. Eng. Sci. 173 (2017) 153-167.
[8] Y. C. K. Chen-Wiegart, S. Wang, Y.-S. Chu, W.-J. Liu, I. McNulty, P. W. Voorhees, and D. C. Dunand, Structural evolution of nanoporous gold during thermal coarsening, Acta Mater. 60 (2012) 4972-4981.
[9] B.-H. Huang, C.-C. Wang, C.-H. Liao, P.-W. Wu, and Y.-F. Song, Structural characterization of colloidal crystals and inverse opals using transmission X-ray microscopy, J. Coll. Interf. Sci. 426 (2014) 199-205.
[10] E. Biermans, S. Bals, E. Beyers, D. Wolf, J. Verbeeck, P. Cool, and G. Van Tendeloo,
Electron tomography of mesostructured cellular foam silica, In: Luysberg M., Tillmann K.,
Weirich T. (eds), Procs. EMC 2008 : 14th European Microscopy Congress 1–5 September 2008, Aachen, Germany, pp. 301-302, ISBN: 978-3-540-85156-1. Springer, Berlin, Heidelberg, 2008.
25
[11] K. Hagita, T. Higuchi, H. Jinnai, Super-resolution for asymmetric resolution of FIB-SEM 3D imaging using Al with deep learning, Sci. Reports, 8 (2018) 1-8.
[12] K. Hu, M. Ziehmer, K. Wang, E. T. Lilleodden, Nanoporous gold: 3D structural analyses of representative volumes and their implications on scaling relations of mechanical behaviour,
Phil. Mag. 96 (2016) 1-14.
[13] K. R. Mangipudi, V. Radisch, L. Holzer, C. A. Volkert, A FIB-nanotomography method for accurate 3D reconstruction of open nanoporous structure, Ultramicroscopy. 163 (2016) 38-47.
[14] K. R. Mangipudi, E. Epler, C. A. Volkert, On the multiaxial yielding and hardness to yield stress relation of nanoporous gold, Scripta Mater. 146 (2018) 150-153.
[15] L. Holzer, F. Indutnyi, P. Gasser, B. Munch, M. Wegmann, Three-dimensional analysis
of porous BaTiO3 ceramics using FIB nanotomography, J. Microsc. 216 (2004) 84-95.
[16] C. Kizilyaprak, J. Daraspe, B.M. Humbel, Focused ion beam scanning electron microscopy in biology, J. Microsc. 254 (2014) 109-114.
[17] B. Song, T. Sui, S. Ying, L. Li, L. Lu, A. Korsunsky, Nano-structural changes in Li-Ion battery cathodes during cycling revealed by FIB-SEM serial sectioning tomography, J. Mater. Chem. A 3 (2015) 18171-18179.
[18] J. Joos, T. Carraro, A. Weber, E. Ivers-Tiffée, Reconstruction of porous electrodes by
FIB-SEM for detailed microstructure modeling,J. Power Sources 196 (2011) 7302-7307.
[19] T. Terao, G. Inoue, M. Kawase, N. Kubo, M. Yamaguchi, K. Yokoyama, T. Tokunaga, K. Shinohara, Y. Hara, and T. Hara, Development of novel three-dimensional reconstruction method for porous media for polymer electrolyte fuel cells using focused ion beam-scanning electron microscope tomography, J. Power Sources, 347 (2017)108-113.
[20] M. Salzer, T. Prill, A. Spettl, D. Jeulin, K. Schladitz, and V. Schmidt, Quantitative comparison of segmentation algorithms for FIB-SEM images of porous media, J. Microsc. 257 (2015) 23-30.
[21] S.I. Stoeva, B. L.V. Prasad, S. Uma, P. K. Stoimenov, V. Zaikovski, C. M. Sorensen, K. J. Klabunde, Face-Centered Cubic and Hexagonal Closed-Packed Nanocrystal Superlattices of Gold Nanoparticles Prepared by Different Methods, J. Phys. Chem. B 107 (2003) 7441-7448.
[22] K. B. Blodgett, Films built by depositing successive monomolecular layers on a solid surface, J. Am. Chem. Soc. 57 (1935) 1007-1022.
[23] S. Reculusa, M. Heim, F. Gao, N. Mano, S. Ravaine, A. Kuhn, Design of catalytically active cylindrical and macroporous gold microelectrodes, Adv. Funct. Mater. 21 (2010)
691-26
698.
[24] R. Szamocki, Synthèse contrôlée d’électrodes macroporeuses pour des applications électrocatalytiques, PhD manuscript, Bordeaux University , n° 3275, 2006.
[25] R. Wierzbicki, C. Kobler, M. R. B. Jensen, J. Lopacinska, M. S. Schmidt, M. Skolimowski, F. Abeille, K. Qvortrup, K. Molhave, Mapping the complex morphology of cell interactions with nanowire substrates using FIB-SEM, PLOS One 8 (2013) 1-12.
[26] J. Schindelin, I. Arganda-Carreras, E. Frise et al., Fiji: an open-source platform for biological-image analysis, Nature Meth. 9 (2012) 676-682.
[27] Ilastik, the interactive learning and segmentation toolkit, https://www.ilastik.org/.
[28] J. Roerdink, A. Meijster, The watershed transform: definitions, algorithms and parallelization strategies, Fundam. Inform. 41 (2000) 187-228.
[29] J. Gostick, Versatile and efficient pore network extraction method using marker-based watershed segmentation, Phys. Rev. E 96 (2017) 23307-23323.
[30] SciPy software, https://scipy.org/. Page consulted Oct. 2, 2019.
[31] S. van der Walt, J. L. Schönberger, J. Núñez-Iglesias, F. Boulogne, J. D. Warner, N. Yager, E. Gouillart, T. Yu and the SciKit-Image contributors. SciKit-Image: Image processing in Python. PeerJ 2, e453 (2014). DOI:10.7717/peerj.453
[32] M. Donias, G. L. Vignoles, C. Mulat, C. Germain and J.-F. Delesse, Simplified marching cube: an efficient discretization scheme for simulation of deposition/ablation in complex media, Comput. Mater. Sci. 50 (2011) 893-902.
[33] N. Aspert, D. Santa-Cruz, T. Ebrahimi, MESH: measuring errors between surfaces using the Hausdorff distance, in: Proceedings of the IEEE International Conference on Multimedia and Expo, 26-29 Aug 2002, Lausanne, Switzerland, vol. 1, pp. 705-708, ISBN: 978-0780373051, IEEE Press, Piscataway, NJ, 2002. http://www.mesh.epfl.ch.
[34] MMG platform: Robust, Open-Source & Multidisciplinary software tools for remeshing, https://www.mmgtools.org/. Consulted Oct. 2, 2019.
[35] M. M. Tomadakis and S. V. Sotirchos, Transport Properties of Random Arrays of Freely Overlapping Cylinders with Various Orientation Distributions, J. Chem. Phys. 98 (1993) 616-626.
[36] M. M. Tomadakis and S. V. Sotirchos, Ordinary and Transition Regime Diffusion in Random Fiber Structures, AIChE J. 39 (1993) 397-412.
[37] P. Grathwohl, Diffusion in Natural Porous Media: Contaminant Transport, Sorption/Desorption and Dissolution Kinetics, Kluwer, Boston, 1998.
27
[38] B. Ghanbarian, A. G. Hunt, R. P. Ewing, and M. Sahimi, Tortuosity in Porous Media: A Critical Review, Soil Sci. Soc. Am. J. 77 (2013) 1461-1477.
[39] G. L. Vignoles, A hybrid random walk method for the simulation of coupled conduction and linearized radiation transfer at local scale in porous media with opaque solid phases, Int. J. Heat Mass Transf. 93 (2016) 707-719.
[40] A. Einstein, Investigations on the Theory of the Brownian Movement (Translated by A.D. Cowper), Dover Edition, Berlin, 1956.
[41] S. Chandrasekhar, Stochastic problems in physics and astronomy, Rev. Mod. Phys. 15 (1943) 1–89.
[42] W. Kinzelbach, G. Uffink, The random walk method and extensions in groundwater modelling, In: Bear J., Corapcioglu M.Y. (eds) Transport Processes in Porous Media. NATO ASI Series (Series E: Applied Sciences), vol 202. Springer, Dordrecht, 1991, pp. 761–787. [43] G. L. Vignoles, M. Donias, C. Mulat, C. Germain, J.F. Delesse, Simplified marching cubes: an efficient discretization scheme for simulations of deposition/ablation in complex media, Comput. Mater. Sci. 50 (2011) 893-902.
[44] J. Lachaud, G. L. Vignioles, A Brownian Motion simulation technique to simulate gasification and its application to ablation, Comput. Mater. Sci. 44 (2009) 1034-1041.
[45] G. L. Vignoles, W. Ros, I. Szelengowicz, C. Germain, A Brownian motion algorithm for tow scale modeling of chemical vapor infiltration, Comput. Mater. Sci. 50 (2011) 1871-1878. [46] C. Kloss, C. Goniva, A. Hager, S. Amberger, S. Pirker, Models, algorithms and validation for opensource DEM and CFD-DEM, Progr. Comput. Fluid Dyn., an Int. J. 12(2/3) (2012) 140-152.
[47] Y. Gu, A. Ozel, and S. Sundaresan, Rheology of granular materials with size distributions across dense-flow regimes, Powder Technol. 295 (2016) 322-329.