HAL Id: halshs-01131900
https://halshs.archives-ouvertes.fr/halshs-01131900
Submitted on 15 May 2020
HAL is a multi-disciplinary open access
archive for the deposit and dissemination of sci-entific research documents, whether they are pub-lished or not. The documents may come from teaching and research institutions in France or abroad, or from public or private research centers.
L’archive ouverte pluridisciplinaire HAL, est destinée au dépôt et à la diffusion de documents scientifiques de niveau recherche, publiés ou non, émanant des établissements d’enseignement et de recherche français ou étrangers, des laboratoires publics ou privés.
Mapping Malaria Risk in Dakar, Senegal
Sébastien Oliveau, Marion Borderon, Alphousseyni Ndonky, Richard Lalou
To cite this version:
Sébastien Oliveau, Marion Borderon, Alphousseyni Ndonky, Richard Lalou. Mapping Malaria Risk in Dakar, Senegal. GI_Forum 2014. Geospatial Innovation for Society, Wichmann-Verlag, pp.192-196, 2014, 978-3-87907-545-4. �10.1553/giscience2014s192�. �halshs-01131900�
Mapping Malaria Risk in Dakar, Senegal
Marion BORDERON, Sébastien OLIVEAU, Alphousseyni N'DONKY and Richard LALOU
UMR 7300 ESPACE, Aix-en-Provence / France · [email protected]
This contribution was double-blind reviewed as extended abstract.
Abstract
Independent entomological variables and human socio-economic characteristics can influence the risk of malaria infection in urban areas, yet the imbalanced spatial distribution of infection remains in question. There is often a lack of simultaneous consideration of the factors responsible for the transmission of parasites. This work examines interactions between the entomological profile of urban places and their socio-economical characteriza-tion through the implementacharacteriza-tion of a geographic informacharacteriza-tion system (GIS) database.
1 Introduction
Urban malaria does not follow classic schemes of epidemic diffusion and therefore requires a particular focus (MOUCHET et al. 2004). With more than 3 million inhabitants, Dakar can no longer be ignored in the geography of malaria in Senegal. Given various economic and practical factors, health indicators are not currently available in Dakar and without these indicators, the diffusion of the disease is impossible to track. Individual monitoring is not yet a possibility and the required details are too expensive to obtain (Plasmodiums genetic analysis is necessary to distinguish imported and endogenous origin of malaria cases). The use of proxy indicators may allow us to overcome these obstacles (BECK et al.
1994).
This work is the result of a three-year multi-disciplinary research program based on extensive GIS data sets to explore the urban environment in order to identify hot spots of malaria risks. The challenge was to visualize potential sites at risk using incomplete and/or indirect data. GIS was used as a tool to analyse this kind of data and to link different sources in a given territory over various temporal periods.
2 Materials
One of the main characteristics of less developed countries is the difficulty to obtain good population data. Nevertheless, some existing data can be exploited, opening new horizons for research. Senegal is no exception to this rule. Censuses are useful resources, but scale and the quality of data are often problematic. Aggregated data integrated into a GIS system can be useful to compensate for these deficits (See for example MERCHANT et al. 2011,
GUILMOTO et al. 2002).
Vogler, R., Car,A., Strobl,J. & Griesebner,G. (Eds.) (2014): GI_Forum 2014. Geospatial Innovation for Society. © Herbert Wichmann Verlag, VDE VERLAG GMBH, Berlin/Offenbach. ISBN 978-3-87907-545-4.
Mapping Malaria Risk in Dakar, Senegal 193
Data from satellite imagery are becoming more readily available with spatial and temporal resolution that can be helpful not only to characterize the landscape but also as proxy variables for the characterization of the urban environment. Although these images do not directly produce socio-economic data, a number of extrapolations from their analysis can be produced (see notably DUREAU et al. 1989).
The 2002 (published in 2006) and 1988 (which has remained largely unused) census data for Dakar is available in a digital format, distributed by the National Agency of Statistics and Demography. Its integration into a GIS system was conducted by N’DONKY (2011) in
the context of an IRD (“Institut de Recherche et de Développement”) research program. The first process identified the quality data which could be used in a socio-spatial analysis of the agglomeration of Dakar.
There have been numerous studies involving satellite imagery, limiting the need to rely on aerial photos used by VERNIÈRE (1978). This work is now being applied to health issues, particularly to malaria (for example MACHAULT et. al. 2012).
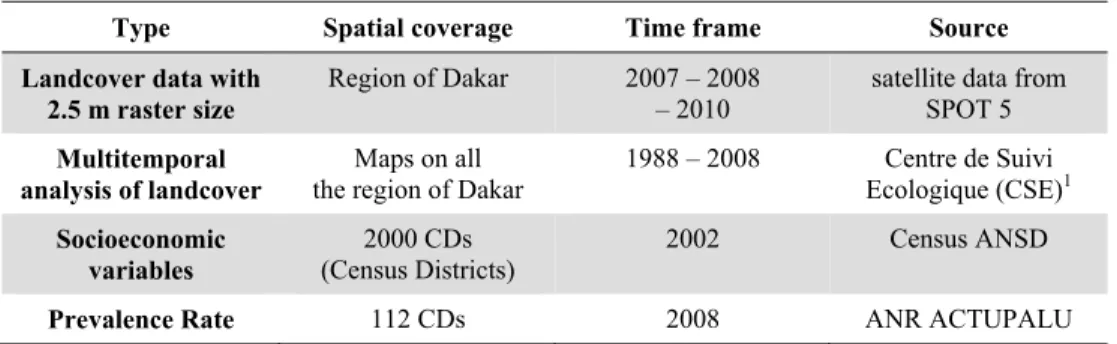
The following table shows the main data available for this article.
Tab. 1: Preliminary Data sources for Dakar metropolitan area
Type Spatial coverage Time frame Source
Landcover data with 2.5 m raster size
Region of Dakar 2007 – 2008 – 2010
satellite data from SPOT 5
Multitemporal analysis of landcover
Maps on all the region of Dakar
1988 – 2008 Centre de Suivi Ecologique (CSE)1 Socioeconomic variables 2000 CDs (Census Districts) 2002 Census ANSD
Prevalence Rate 112 CDs 2008 ANR ACTUPALU
3 Methods
In order to map the estimation of malaria risk on a fine scale, we have constructed two indicators which correspond respectively to the hazard and the vulnerability in the case of this infection. According to the classic equation of risk, we assume that the intersection of these indexes allows us to approach the epidemic profile of the territories. The first indicator gives information about the hazard through entomological data; this provides information on the presence of the vector. On an aggregated scale, precise and localized data have been extrapolated in order to give a model for the number of Anopheles bites per person, and per night (the Human-Biting Rate – HBR) in Dakar’s urban area (MACHAULT
et al. 2012). It is aggregated to the district level and can be available at a finer scale. There are some limitations for this indicator in our study area because we have this estimate only for 1495 Census Districts.
The second indicator that we have proposed is built with the help of the census dataset. The census data includes 160 variables which are divided into five major categories and 17 subcategories. These five major groups incorporate the classic categories found in the literature to characterize household social vulnerability. Several exploratory analyses were conducted to reduce and synthesize the information contained in the data. PCA (Principal Components Analysis) was performed on each of the 17 categories to allow the analysis. Subgroups were developed through an expert approach (using previous knowledge at each time step of the exploratory method). A clustering was carried out to construct homogenous groups with distinct classifications. The clustering by means of the k-means method provided the distance of each individual at the center of gravity of its class. These results are mapped (BORDERON 2013).
These two indicators of malaria infection exposition have been confronted by the bivariate LISA (BiLISA) method. The results are completed by the assessment of the co-localization existing between the entomological profile of census districts and their social vulnerability profile. The biLISA method allows a comparison between the spatial structure of land use by mosquitoes with human social components. This process highlights the spatial clusters where a combination of factors exists.
Furthermore, the prevalence rate was used as a third indicator in order to validate the statistical model. Estimated prevalence rates from the rainy season in 2008 and available after a survey conducted as part of a program (ACTUPALU) were used to check the consistency of the mapping of malaria risk in Dakar. This malariometric index was calculated as the estimation of the percentage of thick blood smears carrying a plasmodium in 50 sites studied during the ACTUPALU program. A thick blood smear for malaria parasite research and a dried blood filter paper spot were collected from each volunteer. Sixty households in each site (3,000 households for the 50 sites) were selected. The first criterion for household selection was the presence of at least one child aged between 2 to 10 years. After collecting family consent, the families completed questionnaires including socio-demographic information, household lifestyle, education level, income, and the access mode to healthcare facilities. Parasite prevalence varied from one study site to another, ranging from 0 to 7.41%. No plasmodium carriers were found in fifteen sites.
4 Results
The BiLISA Moran's I “gives an indication of the degree of linear association (positive or negative) between the value for one variable at a given location and the average of another variable at neighbouring locations. BiLISA is a correlation between two different variables in an area and in nearby areas” (ANSELIN et al. 2002).
Mapping Malaria Risk in Dakar, Senegal 195
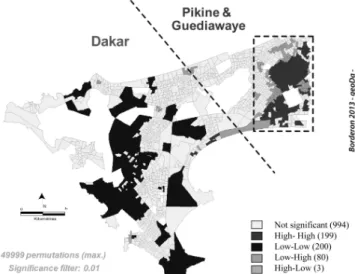
Fig. 1: BiLISA cluster map in Dakar, Senegal
There was not a high co-localization between the evaluated HBR and the socio-economical profile of the inhabitants. Likewise, at the superior scale, an average HBR can be explained for a large part (43%) by an average social profile of nearby census districts. The spatial coherence which exists between profiles leads to several interpretations. The notion of “poverty traps” for example can be a good summary of the places of accumulation of vulnerabilities, where people with “limited capabilities” live in some areas which border high HBR (BORDERON 2013). Restricted to areas where landscapes are "pathogens", people may have no choice or no control of their environment. In contrast, the city dwellers with low vulnerability reside mainly in the center of the peninsula and are farther from Anopheles bites.
Fig. 4: Prevalence rate according to the BiLISA
typology
The prevalence rate is recalcula-ted by the typology provided by the BiLISA results. With an average of 1.2 % of infected peo-ple in the CDs of the area study, we can see that the prevalence rate is much higher in the CDs with high SoVI and high HBR. The red clusters could be con-sidered as the hotspot of malaria risk of infection.
5
Conclusion and Outlook
This kind of multi-source GIS allows stakeholders involved in urban health management to precisely map the spatial extension of malaria. In the current context of pre-elimination of malaria in Senegal, these results are fundamental. If malaria in urban areas is quite low (in 2008, for example, with a minimal prevalence rate of 2%) (DIALLO et al. 2012), the
distribution remains spatially heterogenic. This heterogeneity is partly due to poverty traps which concentrate the three hosts of malaria pathogens. Taking the logic of "target programs” of the protocol of Hyogo, it is interesting to accurately locate the high circulation areas of the parasite.
References
ANSELIN,L.,SYBARI,I.&SMIRNOV,O. (2002), Visualizing Multivariate Spatial.
Correla-tion with Dynamically Linked Windows. Urbana, IL: University of Illinois, Urbana-Campaign.
BECK, L. R., RODRIGUEZ, M. H., DISTER,S. W.,RODRIGUEZ, A.D., REJMANKOVA, E.,
ULLOA, A., MEZA, R. A., ROBERTS, D. R., PARIS, J. F. & SPANNER, M. A. (1994),
Remote sensing as a landscape epidemiological tool to identify villages at high risk for malaria transmission. Am. J. Trop. Med. Hyg., 51 (3), 271-280.
BORDERON, M. (2013), Why here and not there? Developing a spatial risk model for malaria in Dakar, Senegal, Source, n°17. Social Vulnerability and the United Nations University Institute for Environment and Human Security (UNU-EHS), 108-120. DIALLO,A.,NDAM,N.T,MOUSSILIOU,A.,DOS SANTOS,S.,NDONKY,A.,BORDERON,M.,
OLIVEAU, S., LALOU, R. & LE HESRAN, J. Y. (2012), Asymptomatic Carriage of
Plasmodium in Urban Dakar: The Risk of Malaria Should Not Be Underestimated. PLoS ONE, 7 (2), e31100.
GUILMOTO,C.Z.,OLIVEAU,S. &VINGADASSAMY, S. (2002), Un système d’information géographique en Inde du Sud : Théorie, mise en œuvre et applications thémati-ques, Espace, Populations et sociétés, Lille, 147-163.
MACHAULT, V., VIGNOLLES, C., PAGES, F., GADIAGA, L., TOURRE, M. Y., GAYE, A.,
SOKHNA, C., TRAPE, J. F., LACAUX, J. P. & ROGIER C. (2012), Risk mapping of Anopheles gambiae s.l. densities using remotely-sensed environmental and meteoro-logical data in an urban area. Dakar, Senegal, PLoS One, 7 (11).
MERCHANT,E.R.,DEANE,G.D.&GUTMANN,M.P. (2011), Navigating Time and Space in
Population Studies. Springer.
MOUCHET, J., CARNEVALE, P., COOSEMANS, M., JULVEZ, J., MANGUIN, S., RICHARD
-LENOBLE,D.&SIRCOULON J. (2004), Biodiversité du paludisme dans le monde. John
Libbey Eurotext, Montrouge, 428 p.
N’DONKY,A. (2011), Contextes spatiaux et recours aux soins en cas de fièvre chez l’enfant de 2 à 10 ans dans l’agglomération de Dakar, thèse de doctorat en géographie de l’Université Cheikh Anta Diop, Dakar, Sénégal (non publié).
VERNIERE, M. (1978), Méthode de mesure quantitative de la croissance urbaine dans
l’espace et dans le temps. Exemple d’une banlieue de Dakar (Sénégal), Photo-interprétation, 1, 34-55.