HAL Id: hal-00270953
https://hal.archives-ouvertes.fr/hal-00270953
Submitted on 8 Apr 2008
HAL is a multi-disciplinary open access archive for the deposit and dissemination of sci-entific research documents, whether they are pub-lished or not. The documents may come from teaching and research institutions in France or abroad, or from public or private research centers.
L’archive ouverte pluridisciplinaire HAL, est destinée au dépôt et à la diffusion de documents scientifiques de niveau recherche, publiés ou non, émanant des établissements d’enseignement et de recherche français ou étrangers, des laboratoires publics ou privés.
Labor Hoarding In Russia: Where Does It Come From?
Rouslan Koumakhov, Boris Najman
To cite this version:
Rouslan Koumakhov, Boris Najman. Labor Hoarding In Russia: Where Does It Come From?. Econo-metric Society world congress, Aug 2000, Seattle, United States. �hal-00270953�
Labor Hoarding In Russia:
Where Does It Come From?
By: Rouslan Koumakhov and Boris Najman
William Davidson Working Paper Number 394
October 2001
Labor Hoarding In Russia:
Where Does It Come From?
Rouslan Koumakhov, Boris Najman1
Rouslan Koumakhov
Forum, Université Paris X-Nanterre, bat. K 200, avenue de la République, 92001 Nanterre Cedex
Tel.: 331 53 61 21 82 fax: 331 40 97 71 83
Boris Najman Delta-ENS 48, boul. Jourdan 75014 Paris
Tel.: 331 42 19 07 91 fax: 331 43 13 63 10
June, 2000
1Suggestions and comments are welcome: [email protected], [email protected] We want to thank Mathilde Maurel, Georges de Ménil, Jean-François Nivet and Dominique Redor for their extensive help and devotion in this research. A preliminary version of the paper was presented at the Econometric Society world congress in Seattle in August 2000.
University of Nanterre Paris X; Delta, Ecoles des Hautes Etudes en Sciences Sociales. This paper is financed through CNRS (ROSES University of Paris I, MSE, 106-112, bd. de l'Hôpital 75647 Paris cedex 13).
The paper focuses on the labor "hoarding" problem in Russian. We studied two forms of "hoarding": unpaid leaves and short-time work. Our research is based on the Russian
Longitudinal Monitoring Survey (RLMS) database. The paper exploits individual panel data
between 1994 and 1996.
We show that unpaid leaves and short-time work do not represent a form of hidden unemployment. Both types of labor "hoarding" reflect the nature of employees' professional competencies. First, unpaid leaves concern primarily the employees with firm-specific knowledge, while short-time work affects strongly unskilled workers. Second, external mobility is mostly related to young people and unskilled blue-collar workers while employees with specific competencies do not change jobs so much.
The paper insists on significant internal adjustments which are taking place through unpaid leaves and short-time work. This explains why there has been no massive unemployment in Russia until now.
In conclusion, Russian labor market is characterized rather by internal flexibility than by labor "hoarding".
Key words: labor market, internal adjustments, flexibility, Russia, skills. JEL classification: J2, C23, P23
Introduction
One of the surprises of the Post-Soviet transformation is the relationship between output and labor: in the context of dramatic output fall in 1991-1997 there was still no open mass unemployment and no large decrease in employment1 in Russia. To explain this puzzling result, different Russian and Western economists and sociologists draw our attention to the enterprise level, pointing out, in particular, "labor surplus", or "labor hoarding" as "guilty" practices which prevent reallocation and restructuring process in Post-Soviet economy. Two forms of labor "retaining", i.e. "administrative" (forced unpaid or partially paid) leave and short-time (reduced hours) work, are at the center of much of economic studies.
Two main problems arise from this reasoning.
First, the labor hoarding hypothesis seems to contradict the evidence of the high labor mobility in the enterprise data (Gimpelson et Lippoldt 1997) which is also stated in various survey studies (Smirnov 1998). The intensive labor rotation, which in itself points at the reallocation process, rejects the overhang idea: not only managers "hoard" labor by limiting employment reductions, but they try to replace separated workers by "outsiders".
Second, and more generally, we do not know why Russian enterprises should hoard labor.
Commander et al. (1995) insist on the social functions of the Russian firms: "And the decision to enforce severance may further be complicated because in a large number of cases firms are the source of a broad range of benefits and income supports for workers. Loss of employment likely implies loss of access to such benefits, frequently with no clear alternative suppliers" (p. 157-158). Layard and Richter (1994) evoke "paternalistic" behavior as one of the reasons for the job keeping.
This argument does not seem to be satisfactory.
First, social support cannot be considered as a reason of labor retaining, since we still do not understand the reasons of "paternalistic" commitment. Notice that the social support argument was advanced from the viewpoint of employees, but not from the viewpoint of firms. Why might managers keep social functions in the face of the drastic and continuous shocks to output? In other terms, explaining the patterns of "abnormal" behavior by another "abnormal" pattern which in turn has to be explained does not add a lot to our understanding.
Second, since hiring rates remain rather high managers cannot be committed only to "their" employees but to all workers they engage regularly from external labor market which does not seem very realistic.
1 Between 1994 and 1996, labor macro data shows a decline of employment by 1.9 millions (3.1 % of the total
employment), and similarly the unemployment (ILO definition) increased by about 1 million people (1.8 % of the labor force), (Russian Economic Trends, 1999).
Notice, that the "technological" solution proposed by Commander et al. (1995) can neither be considered as satisfactory: if technological rigidities restrain the amount of labor adjustment, employee-retaining is no more justified by "overhang" or "hoarding" 2.
In this paper, we analyze two forms of labor "retaining": "administrative" leave and reduced hours. Focusing our attention on these issues is justified by two main reasons.
First, both forms are often treated, though not empirically analyzed, as an evidence of hidden unemployment. For instance, Commander et al. (1995) characterize Goskomstat figures and the World Bank survey data on involuntary leave or short-time work as "a crude measure of the current employment overhang": "we can see that releasing the marginally employed into unemployment would have raised the unemployment rate by at least 300 percent" (p. 157). In the same vein, Standing (1994, 1996, 1998) who considers reduced hours and unpaid leaves as hiding the "real" unemployment state, argues that employees put on "administrative" leave have "minimal or no prospect of being recalled" (Standing 1994, p. 37)3.
Second, the choice of issues as unpaid leaves and short-time work is linked to the data we have utilized.
The data source in this paper is a survey of individuals and households (Russia Longitudinal Monitoring Survey, RLMS)4. We used and constructed variables on individuals and households (see appendix 4 and 5 for the definitions and measurement of variables) and enterprise characteristics, while focusing on the 1994-1996 sample in order to follow the same individuals all over the period. We studied people between 15 and 72 years old, the sample is composed 4607 persons.
One may say that the dataset which refers to individuals is not relevant to consider the issues of labor hoarding as, contrary to firm surveys, it does not contain information on enterprises.
We can counter-argue that the RLMS survey allows us to identify clearly a large set of variables related to the individual behavior within the enterprise and reflecting the firm policies towards their employees. This is, in particular, the case of unpaid leave and short-time work5 that can be directly measured from the RLMS database. After all, we have no evidence that information reported by employees on this issues is less valuable than data given by managers in the firm surveys.
Moreover, data provided by individuals could be more precise in some cases. For example, a lot of employment practices are not formally documented within a firm and/or applied on the workshop or team level. Therefore, managers (and especially top-managers,
2 See Fay and Medoff (1985) for the general argument and Clarke (1998) for the Russian case.
3 Linz (1988) suggests also that unpaid leaves could be considered as a "signal of management's commitment to maintaining employment levels" (p. 15) without giving any explanation for the "job rights" keeping.
4 This survey stands as part of an international research project conducted jointly by the University of Chapel
Hill (USA), the Institute of Sociology, Russian Academy of Sciences and the Russian Institute of Nutrition.
5 We have measured short-time work as the time spent on primary work under 120 hours per month. As for
i.e. those who respond usually to the firm survey) may count only "official" leaves or working-hours' reductions, thus seriously underestimating the extent of a real labor "retaining". As for an individual, he faces directly these practices, which allows measuring them more accurately in the corresponding questions.
Finally, a firm survey usually do not contain any information on the individuals after they quitted enterprise, it can only report data on hirings and separations. Thus, such issues as unemployment or job-to-job movements, crucial for our paper are ignored. On the contrary, the RLMS database allows us to highlight these issues, for it follows the same individuals inside and outside the firms.
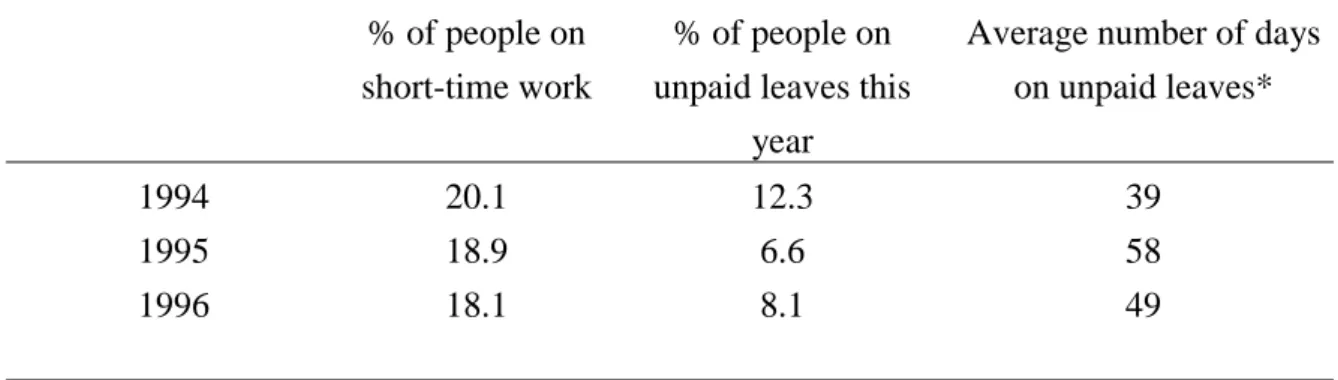
In fact, from 1994 to 1996 Russian labor market face a large reallocation of workers through short-time work and unpaid leaves (see table 1). The survey data shows an important reduction in working time. For instance the number of days –about 50 days– on unpaid leaves correspond to a 20 % reduction in the total working days over a year6.
Table 1: Employment enterprise policies (in % of employed population)
% of people on short-time work
% of people on unpaid leaves this
year
Average number of days on unpaid leaves*
1994 20.1 12.3 39
1995 18.9 6.6 58
1996 18.1 8.1 49
Sources: RLMS, rounds V, VI, VII
* On average per person on "Unpaid leaves".
The structure of this paper is as follows.
We start by testing the "hidden unemployment" hypothesis: do "administrative" leave and short-time work represent preliminary states of unemployment? (Section I). We analyze then the determinants of these two practices (Section II) and the relationship between job-to-job mobility and labor-retaining (Section III). Finally we discuss our findings and propose corresponding conclusions (Sections IV, V).
I. Do "administrative" leave and reduced hours represent preliminary states of unemployment?
There can be two-fold relationship between the forms of labor "hoarding" and unemployment. First, if workers put on unpaid leave or short-time work have "minimal or no project of being recalled", one should find a higher probability of becoming unemployed for these workers. In order to measure unemployment, we choose the data on self-reported
unemployment. This definition is voluntary large in order into account all forms of unemployment. We did not want to underestimate the unemployment phenomenon.
Second, the high risk of unemployment that both forms of labor "retaining" are supposed to "hide" should be reflected in corresponding subjective perception of the current job position. Such perception is an important characteristic of individual behavior with respect to
unemployment. For instance, people that have few job opportunities are obviously more likely to accept various employment policies, in terms of work disciplining or labor adjustment. We measure this "subjective" characteristic using the RLMS data which
contained two following questions7: "Are you afraid of losing your job?" and "How certain are you that you will be able to find a work, no worse than your present job?"
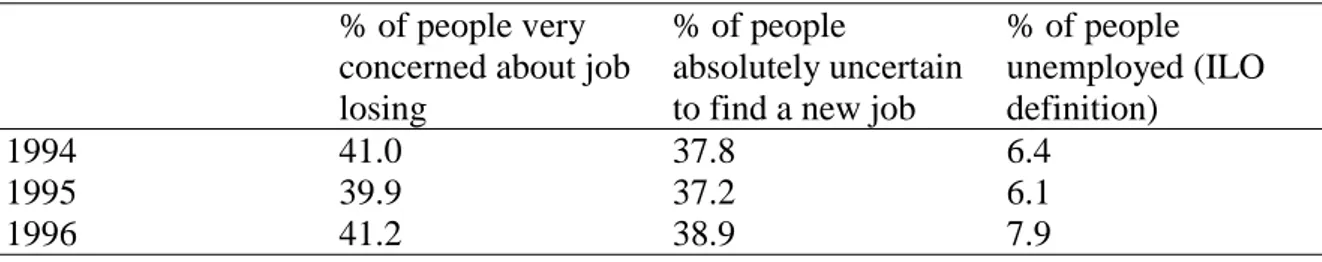
We start by a general picture of the unemployment threat without any relation with the problem of labor hoarding. Table 2 gives corresponding percentages – of subjective
perceptions and unemployment – for the total sample of individuals between 1994 and 1996 (on the basis of the RLMS data ). One may see that while the rate of unemployment (ILO definition) is rather low, especially in 1994-1995, the "subjective" perception of
unemployment risk is high. People in general are very concerned about job losing and of not finding another one. This result suggests that at least a large part of employees could be subject to a permanent and strong pressure on behalf of managers who are able to impose them different "precarious" employment practices.
Table 2: employment expectations of the employees (in % of employed people) and unemployment (in % of the labor force, ILO definition)
% of people very concerned about job losing
% of people
absolutely uncertain to find a new job
% of people unemployed (ILO definition) 1994 41.0 37.8 6.4 1995 39.9 37.2 6.1 1996 41.2 38.9 7.9
Sources: RLMS, Rounds V, VI, VII
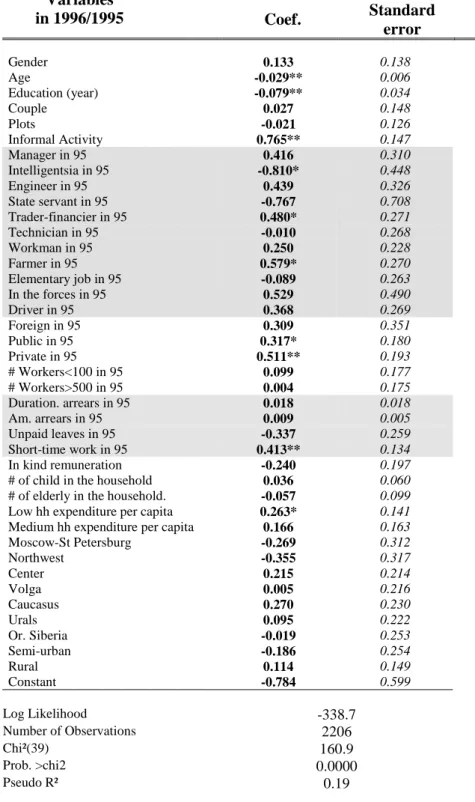
We study now actual and perceived risks of unemployment in relation with unpaid leaves and reduced hours. We examine the ordered probit (Greene, 1993, p.672-676) of "subjective" variables and the simple probit (Greene, 1993, p. 643-655) for unemployment controlling for all our individual, households and enterprise variables.
There are four main results emerging from regressions in Tables 3 and 4:
(i) Employees who had experience with unpaid leaves are more afraid of losing their job and not to find a new job corresponding to their specialization, in case of eventual job loss.
(ii) For the short-time experience, the "subjective" perception is quite on the opposite. (iii) There is no evidence that inflows in unemployment in 1996 are related to having been put on unpaid leaves in 1995.
7 In the questionnaire, the evaluation of these “subjective” perceptions is marked from 1 to 5. In table 2, we
(iv) By contrast, there is a strong positive relation between short-time-working in 1995 and becoming unemployed in 1996.
Given these results, we can try to answer the main question of this section: can we state that both forms of employment practices, i.e. "administrative" leave and short-time work, represent preliminary states of unemployment? As for unpaid leaves, the answer is No: even if unpaid-leave-workers feel more vulnerable regarding their job opportunities, there is no proof that in reality these workers are facing higher risk of unemployment than other groups of workers. As for the practice of reduced hours, contrary to "administrative" leaves, the preliminary answer is Yes: short-time work may represent a preliminary stage of the unemployment.
We will now shadow these conclusions since the results of the regressions in Tables 3 and 4 provide us one more important finding. Both forms of employment practices studied here imply a kind of internal paradox. Workers who experience first form, unpaid leaves, are rather afraid of losing their job, but in reality few of them are likely to become unemployed. Workers who experience the second form, short-time work, are more likely to become unemployed but they are far more optimistic regarding their future job opportunities.
In the following considerations we try to propose a comprehensive understanding of this double paradox.
(i) Consider workers who experienced unpaid leaves. Their fear of unemployment provides a part of explanation why a large part of workers accept this "precarious" state of employment. Unpaid leaves could be, therefore, used as a means of pressure by managers. However, this instrument of disciplining is not likely to be utilized in actual managerial strategies. Otherwise, the outflows from "administrative" leaves into unemployment would be much more intensive. Hence, this form of employment policies, and only this form, i.e.
unpaid leaves, is consistent with the generalization made by Commander et al (1995) : "In short, managers appear to have discretionary powers with respect to wages and employment, but they evidently choose not to exert them to enforce large employment separations or restructuring" (p. 178).
We suggest that the workers' "attachment" to the firm could be largely due to their firm-specific skills. On one hand, those who accept unpaid or partially paid leaves are afraid of not finding a workplace that conforms to their professional competencies outside the borders of their "enterprise of origin"8. On the other hand, firms in general are neither interested in releasing those employees whom they select for this practice and who accept it. It seems that managers are not sure, that they could easily replace specialized workers through the market, therefore, these workers are been kept within the firms. Thus, unpaid leaves translate via the role of firm-specific skills the process of mutual "attachment" between corresponding workers and enterprises.
We can, therefore, formulate the following hypothesis:
H1: the practice of putting employees on unpaid leaves is closely related to the firm-specific skills of these workers.
(ii) Consider short-time workers now. If unemployment risk appear to be a real threat for this group of workers in general, it is somewhat shadowed by the "subjective" perception of this risk: short-time workers are not afraid of losing job or of not finding another job. Notice, that in general, the determinants of "subjective" variables seem to correspond rather accurately to the reality9. The relative "optimism" of short-time workers suggests that at least a part of them may experience good opportunities on the labor market. This in itself does not
8 This seems to be a more coherent explanation of why employees stay within firms than a "personal identity"
argument suggested by Layard and Richter (1994).
9 Thus, the perception concerning losing or finding a job is fare better for people involved in informal activities.
Is also better for male, for inhabitants urban settlements, and especially for the one from Moscow and really worse for those with low level of expenditures per capita.
seem surprisingly given the above-mentioned high inter-firm mobility in Russia. As Clarke (1998) pointed out, "the result of the very high rate of hiring is that redundancy and
unemployment are not the threat that they would otherwise be" (p 45). This seems to indicate that short-time-workers behavior is strongly heterogeneous and that the heterogeneity is in accordance with employment opportunities.
We can, therefore, propose a second hypothesis:
H2: Short-time workers differ by professional segments which translate different outside job options.
In order to corroborate these hypotheses, we address two issues.
First, we need to study more deeply the characteristics of workers who were faced with administrative leaves or short-time work. In Section II we examine the determinants of both practices, controlling for professional qualifications which we consider as an indicator of skill specificity.
Second, if unemployment risk differs by professional segments of employees, it is necessary to analyze the likely relationship between job opportunities and labor segmentation. Section III focuses on the characteristics of the job-to-job mobility with respect to unpaid leaves and reduced hours. As before, the role of firm-specific skills is directly addressed.
Table 3: Probability to be certain of losing job or not to be able to find one in 1995 (Ordered probit regression)
How concerned are you that you might lose your job?
How certain are you that you will be able to find work? Variables in 1995 Coef. Standard error Coef. Standard error Gender -0.265** 0.060 -0.522** 0.060 Age 0.002 0.002 0.012** 0.002 Education (year) -0.019 0.014 -0.015 0.014 Couple 0.037 0.063 0.013 0.064 Plots -0.039 0.058 0.108* 0.059 Informal Activity -0.205* 0.106 -0.260** 0.105 Manager -0.406** 0.133 -0.517** 0.138 Intelligentsia -0.260** 0.109 -0.471** 0.111 Engineer 0.016 0.134 -0.041 0.138 State servant -0.156 0.156 -0.302* 0.157 Trader-financier 0.068 0.135 -0.292* 0.137 Technician 0.063 0.106 -0.305** 0.107 Workman 0.020 0.095 -0.207* 0.097 Farmer 0.051 0.133 -0.107 0.137 Elementary job -0.066 0.108 -0.258** 0.109 In the forces -0.079 0.251 0.163 0.256 Driver -0.108 0.128 -0.155 0.130 Foreign -0.108 0.147 -0.240 0.149 Public -0.124* 0.070 -0.051 0.070 Private -0.162* 0.082 -0.102 0.083 # Workers<100 -0.062 0.073 -0.184** 0.074 # Workers>500 -0.003 0.071 -0.174** 0.072 Duration. arrears -0.006 0.010 0.023* 0.011 Am. Arrears -0.001 0.003 -0.003 0.003 Unpaid leaves 0.361** 0.104 0.367** 0.104 Short-time work -0.168** 0.063 -0.152** 0.064 In kind remuneration -0.041 0.090 0.082 0.091
# of child in the household. 0.033 0.028 -0.024 0.028
# of elderly in the household -0.016 0.044 0.044 0.044
Low hh. expenditure per capita 0.227** 0.055 0.241** 0.055
Medium hh. expenditure per capita -0.039 0.069 0.096 0.069
Moscow-St Petersburg -0.378** 0.116 -0.415** 0.118 Northwest -0.134 0.120 -0.111 0.122 Center -0.096 0.095 -0.043 0.096 Volga 0.082 0.095 -0.028 0.096 Caucasus -0.110 0.106 -0.220* 0.108 Urals -0.005 0.098 -0.061 0.099 Or. Siberia 0.255* 0.115 0.039 0.115 Semi-urban 0.458** 0.103 0.474** 0.102 Rural 0.214** 0.071 0.350** 0.072 µ(1) -1.430** 0.250 -1.452** 0.253 µ(2) -0.860** 0.249 -0.914** 0.251 µ(3) -0.583** 0.249 -0.515* 0.251 µ(4) 0.009 0.249 0.223 0.251 Log Likelihood -3151 -3059 Number of Observations 2190 2167 Chi² (39) 200.9 361.6 Prob. >chi2 0.0000 0.0000 Pseudo R² 0.03 0.056
Notes: Dependent variable Sources: Panel data from RLMS, Rounds V, VI, VII y=1 if the person is not concerned at all by losing job in 1995 y=1 if the person is absolutely certain to find in 1995 y=2 if the person is not very concerned by losing job in 1995 y=2 if the person is fairly certain to find in 1995 y=3 if the person is both yes and no y=3 if the person is both yes and no to find in 1995 y=4 if the person is a little concerned by losing job in 1995 y=4 if the person is fairly uncertain to find in 1995 y=5 if the person is very concerned by losing job in 1995 y=5 if the person is absolutely uncertain to find in 1995
Legend: *= statistically significant at the 5% level **= statistically significant at the 1% level
Reference variables: Clerk; Semi-public, # of employees between 100 and 500, High household expenditures per capita, Occidental Siberia and
Table 4: Probability to be unemployed (Self reported) in 1996 (probit regression) Variables in 1996/1995 Coef. Standard error Gender 0.133 0.138 Age -0.029** 0.006 Education (year) -0.079** 0.034 Couple 0.027 0.148 Plots -0.021 0.126 Informal Activity 0.765** 0.147 Manager in 95 0.416 0.310 Intelligentsia in 95 -0.810* 0.448 Engineer in 95 0.439 0.326 State servant in 95 -0.767 0.708 Trader-financier in 95 0.480* 0.271 Technician in 95 -0.010 0.268 Workman in 95 0.250 0.228 Farmer in 95 0.579* 0.270 Elementary job in 95 -0.089 0.263 In the forces in 95 0.529 0.490 Driver in 95 0.368 0.269 Foreign in 95 0.309 0.351 Public in 95 0.317* 0.180 Private in 95 0.511** 0.193 # Workers<100 in 95 0.099 0.177 # Workers>500 in 95 0.004 0.175 Duration. arrears in 95 0.018 0.018 Am. arrears in 95 0.009 0.005 Unpaid leaves in 95 -0.337 0.259 Short-time work in 95 0.413** 0.134 In kind remuneration -0.240 0.197
# of child in the household 0.036 0.060
# of elderly in the household. -0.057 0.099
Low hh expenditure per capita 0.263* 0.141
Medium hh expenditure per capita 0.166 0.163
Moscow-St Petersburg -0.269 0.312 Northwest -0.355 0.317 Center 0.215 0.214 Volga 0.005 0.216 Caucasus 0.270 0.230 Urals 0.095 0.222 Or. Siberia -0.019 0.253 Semi-urban -0.186 0.254 Rural 0.114 0.149 Constant -0.784 0.599 Log Likelihood -338.7 Number of Observations 2206 Chi²(39) 160.9 Prob. >chi2 0.0000 Pseudo R² 0.19
Notes: Sources: Panel data from RLMS, Rounds V, VI, VII
Dependent variable: Legend:
y=1 if the person is unemployed in 1996 (self reported) *= statistically significant at the 5% level
y=0 if not **= statistically significant at the 1% level
Reference variables: Clerk; Semi-public, # of employees between 100 and 500, High household expenditures per capita, Occidental
II. Determinants of "administrative" leave and short-time work.
II.1. Detail analysis of the results.
We start this Section by analyzing the probability to be put on unpaid leaves and on short-time work controlling for all individual, household and enterprise variables. For this purpose we use simple probit model (Greene, 1993, p.646-655).
Table 5 provides regression results. First of all, we found out some common determinants of both employment policies: the probability to be put on short-time work or unpaid leaves is higher for female worker and for those involved in informal activities.
Other basic results are the following.
(i) Duration of wage arrears has a positive impact on the probability of being concerned by the "administrative" leave during the current year and no impact on the probability of being on short-time work.
(ii) Education influence is negative for "administrative" leave and has no impact on short-time work.
(iii) Young age increases the probability to have a reduced-hours work and does not play any role for the "administrative" leaves.
(iv) Particular professions increase or decrease both probabilities. For instance, elementary job – without any qualification – and belonging to intelligentsia increase the probability of short-time work while being a farmer plays in the opposite sense. Other professions, workmen and engineers, increase the probability to be on "administrative" leaves.
Table 5: Probability to be on Short-time work job or on Unpaid leaves in 1996 (probit regression)
Short-time work Job Unpaid leaves
Variables in 1996 Coef. Standard error Coef. Standard error Gender -0.212** 0.085 -0.355** 0.105 Age -0.007* 0.003 0.001 0.004 Education (year) -0.011 0.020 -0.058* 0.026 Couple 0.036 0.088 0.120 0.113 Plots 0.187* 0.087 0.201* 0.103 Informal Activity 0.249* 0.138 0.205 0.161 Manager -0.382 0.336 -0.079 0.460 Intelligentsia 0.418** 0.150 -0.039 0.212 Engineer 0.100 0.200 0.840** 0.219 State servant 0.226 0.215 0.232 0.269 Trader-financier 0.116 0.177 -0.206 0.249 Technician 0.089 0.153 0.038 0.200 Workman 0.043 0.146 0.438** 0.177 Farmer -0.721** 0.275 -0.443 0.334 Elementary job 0.468** 0.156 -0.172 0.219 In the forces -0.448 0.504 0.237 0.520 Driver -0.218 0.244 0.094 0.276 Foreign -0.449* 0.259 -0.062 0.248 Public -0.005 0.112 -0.302** 0.119 Private 0.071 0.126 0.066 0.133 # Workers<100 0.036 0.104 -0.267* 0.134 # Workers>500 -0.013 0.104 0.042 0.121 Duration. arrears 0.018 0.013 0.040** 0.013 Am. arrears 0.000 0.003 0.000 0.003 In kind remuneration -0.092 0.123 -0.020 0.140
# of child in the household -0.064 0.044 -0.010 0.054
# of elderly in the household -0.036 0.066 0.075 0.078
Low hh expenditure per capita 0.041 0.087 0.282** 0.111
Medium hh expenditure per cap. 0.075 0.100 0.272* 0.126
Moscow-St Petersburg 0.143 0.165 0.296 0.210 Northwest 0.228 0.177 -0.575* 0.302 Center 0.101 0.145 -0.014 0.185 Volga -0.069 0.147 0.038 0.187 Caucasus -0.237 0.163 0.477** 0.193 Urals -0.006 0.147 0.163 0.183 Or. Siberia 0.169 0.170 0.053 0.229 Semi-urban 0.008 0.150 0.276 0.168 Rural -0.009 0.111 -0.272* 0.145 Constant -0.688* 0.366 -1.138** 0.466 Log Likelihood -842.9 -524.0 Number of Observations 1922 2205 Chi²(37) 95.5 148.7 Prob. >chi2 0.0000 0.0000 Pseudo R² 0.054 0.125
Sources: Panel data from RLMS, Rounds VII Notes:
Dependent variable:
y=1 if the person is on short-time work or unpaid leaves in 1996 y=0 if not
Legend: *= statistically significant at the 5% level
**= statistically significant at the 1% level
Reference variables: Clerk; Semi-public, # of employees between 100 and 500, High household expenditures per capita, Occidental Siberia andUrban Settlement
II.2. Preliminary conclusions.
(i) We can observe some distinct signs of the segmentation of employees. However, this segmentation is not reduced to conventional division blue collars vs. white collars or low skills vs. high skills. The probability of short-time work is important for elementary professions, but for the intellectuals as well10. Both workmen and engineers are likely to be concerned by the practice of unpaid leaves. In other words, if one considers both policies – unpaid leaves and short-time work – as "precarious" states for the employees, there is no evidence that the blue-collar workers are a particularly disgraced group.
Not only these findings corroborate heavily the hypothesis (H2) formulated in the previous section but they even extend it: labor segmentation according to professional qualification is not limited to the division within the pool of short-time workers but characterizes those employees who faced unpaid leaves as well.
(ii) The relation between elementary qualification and short-time work suggests that both forms of employment practices are rather different and even opposite regarding the reasons of labor "retaining". Elementary workers are less qualified, most of them do not have any specific skills while it is just the opposite for the basic characteristics of the employees who had been put on "administrative" leave. The fact that the probability to be on unpaid leaves is higher for engineers and workmen seems to be related to their specific competencies within the firm, while short-time workers do not have any firm-attachment in terms of skills.
This confirms our first hypothesis (H1) related to the relationship between the forms of labor "retaining" and the nature of employees' competencies.
(iii) Thus, the forms of labor "retaining" appear as forms of internal adjustment, which affect differently workers according to their profession. If this is the case, labor demand of Russian firms differs by professional competencies, which gives us a new argument to suggest that the external the mobility of employees will probably be linked to their profession.
We need now to investigate the mobility itself in order to find the impact of our two proxies of labor "hoarding" on job-to-job mobility.
10 However intellectual professions are usually working outside the enterprise, they are probably on short time
not because of the enterprise employment policy but rather because of their own activity, as teacher for instance.
III. Labor "retaining" policies and job-to-job mobility.
III. 1. Three measures of external mobility
Until now, we have considered exits from enterprises as being mainly limited to inflows in unemployment, which is only one component of external labor mobility. We shall consider now another component of this mobility: movement across the jobs.
Measuring this component using the RLMS database is not evident. Thus, labor turnover defined as hiring plus separations could not be calculated using households' or individual data. Earle and Sabrianova (1999) argue that the RLMS data does not allow us to estimate (external) labor mobility because of "ambiguity in the explicit question on job-changing" (p. 11). In fact, with this question11 we actually could not distinguish individuals staying within the enterprise from individuals moving outside.
Nevertheless, measuring external mobility on the basis of the RLMS survey is possible by using three types of variables. We have searched to measure more precisely job to
job mobility. In our paper, it differs from the activity to activity mobility12; and is restricted
to primary wage-earning job.
First, we "filtered" the information provided by the "ambivalent" question mentioned above with the data on professional mobility and we constructed on this basis a dummy variable "New job". This approach appeared as justified, as we have found out in the regression that "New job" depended positively on some variables that usually characterize the labor turnover in Russia (see III.2).
Second, using the RLMS data we can define the date of entry in the firm as an information of mobility. We constructed dummy variables "Change job" for people changing firm between 1994 and 1995, between 1995 and 1996 as well as over the all period (1994-1996)13. We checked that these people did really work the year before they changed job14.
Third, we defined another variable measuring the tenure of a person within a firm. We constructed two dummies of less than one year of tenure and less than three years (see table 6). The interest of the "Tenure" variable is double. First, it allows measuring external mobility. Second, as a measure of firm-specific competencies, it allows us to directly test the stated above conclusions on the importance of the firm-specific skills.
The "New job" and the "Change job" dummies are explained by lagged independent variables, while the "Tenure" dummies are explained by contemporary independent variables. "Backward" and "forward" analysis could be conducted using these dummies in a simple
11 The question is "tell me, please, did you change your place of work or profession by comparison with
December of last year?"
12 See B.Najman, A. Pailhé (2000) where the external labor mobility in Russia is defined as "activity to activity"
movement which includes formal employment, informal and individual activities, plots, and multi-activity.
13 Workers changing enterprise either in 1995 or in 1996.
14 We also checked that in every year chronology of entrance in the enterprise is coherent. For example in 1996
probit model (Greene, 1993, p.646-655). All dummies reflect employees' behavior in relation
with their skills. The more workers stay within "their" firm the more they get firm-specific competencies.
The following table (6) presents the extent of the job-to-job mobility (in terms of percentage and number of people) according to RLMS data. We observe a high percentage of people with low tenure (12-15 % with less than one year and 34-35% with less than three years). This suggests a high job-to-job mobility. The variables "Change job" and "New job" reflect somehow these results. We should stress that RLMS data probably largely underestimate the labor mobility because in the panel data we are following people which are not moving geographically.
Table 6: Job to Job Mobility in Russian Firms (in number of people and %)
YES Yes (as a % of total) NO Changed Job Between 1994 and 1995 262 11.5% 2013 Changed Job Between 1995 and 1996 284 12.3% 2014 Changed Job Between 1994 and 199615 500 20.1% 1984 New job in 1996 342 12.9% 2315
Tenure less than 1 year in 1994 420 15.0% 2376
Tenure less than 3 years in 1994 981 35.1% 1884
Tenure less than 1 year in 1996 322 12.3% 2289
Tenure less than 3 years in 1996 883 33.8% 1536
Sources: RLMS, rounds V, VI, VII
III. 2. Results
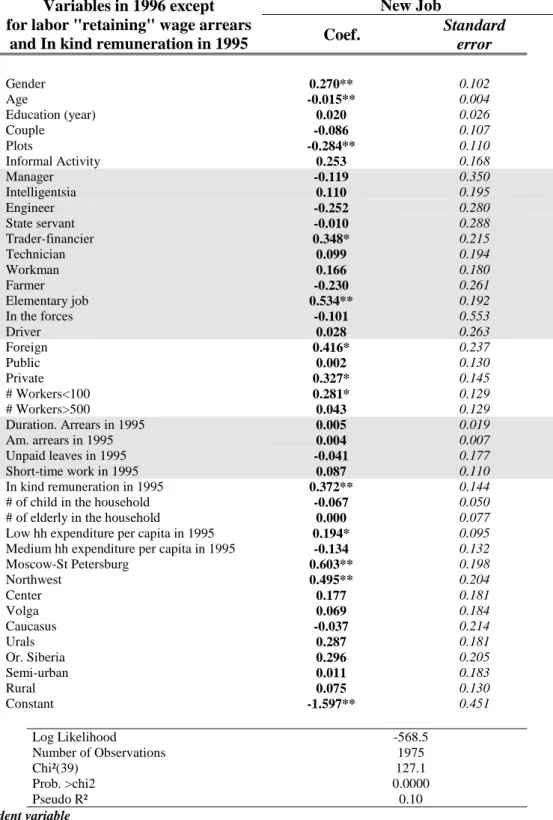
The regression results are presented in Tables 8-11 and summarized in Table 7.
(i) The determinants of "New job" are closely related to the main characteristics of the labor mobility rotation in Russia. For instance, it follows from the Goskomstat data and the case studies (Gimpelson and Lippoldt 1997, Smirnov 1998) that young men with no qualification are the bulk of Russian high mobility. It is the same for our study: having a new job in 1996 is negatively correlated with age (young people have more chances), and positively with one profession, elementary workers. Moreover, the "New job" movement is
linked to the other signs of extreme labor mobility in Russia, such as working in the small, private or foreign firms and living in particular regions like Moscow and St-Petersburg.
Notice also the positive correlation of the "New job" variable with the substitution of remuneration "in kind" (goods or services) for the pay in money16.
(ii) The key determinants of the "Change job" variable are close to those of "New job", thus confirming most of characteristics of external mobility revealed by analyzing the latter variable. The probability of moving across jobs is higher for young, male, and elementary workers. In 1995-1996, changing job is highly probable for the inhabitants of Moscow and St-Petersburg for employees in foreign firms and those accepting In kind remuneration in lieu of wage pay.
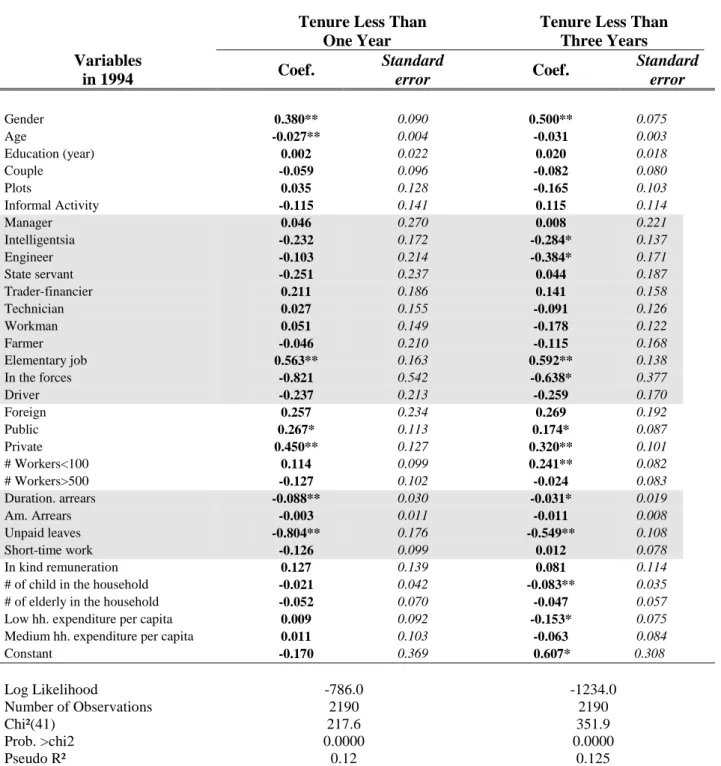
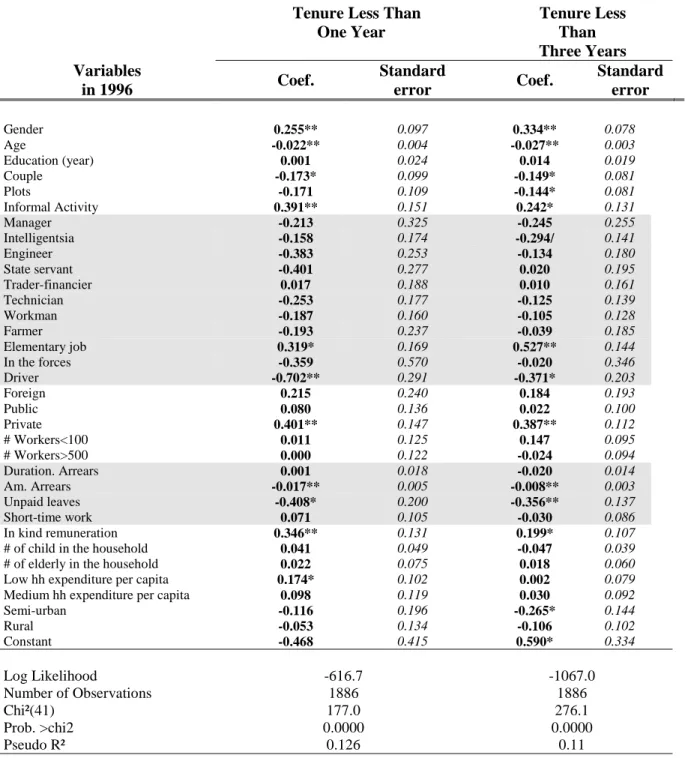
(iii) Both variables of tenure in 1996, less than one year and less than three year, are positively correlated with "traditional" determinants of mobility (being young, male, and elementary worker) and being employed in private firm. Tenure is negatively correlated with the amount of wage arrears and experience of unpaid leaves and positively to the "demonetisations" of remuneration. Tenure of less than three years is negatively correlated with intelligentsia, and positively with employment in a small or private firm. Tenure of less than one year is positively correlated with living in Moscow-St Petersburg.
For 1994, the determinants of both tenure variables are largely similar. The main differences are related to the appearance of negative correlation between being engineer and having a tenure of less than three years.
16 Russian firms generalize more and more the practice of offering goods or services instead of regular wage
Table 7. The main determinants of the job-to-job mobility (see tables 8, 9, 10, and 11)
New job Change job
Short Tenure (in 1994)
Short Tenure (in 1996) +young and male
+elementary job
+small firm +private firm +foreign firm
+In kind remuneration +Moscow-St-Petersburg
+young and male
+elementary job
+foreign firm***
+In kind remuneration*** +Moscow-St-Petersburg***
+young and male -unpaid leaves +elementary job -intelligentsia3 -engineer3 +small firm3 +private firm +public firm -duration of arrears1
+young and male -unpaid leaves +elementary job -intelligentsia3 -driver +small firm3 +private firm3 -amount of arrears
+In kind remuneration
+Moscow-St-Petersburg1
Here "+" and "-" indicate the sign of the correlation
1less than 1 year 3less than 3 years
***Only between 1995 and 1996
III.3. Conclusions.
(i) The positive relation between moving from job to job and elementary workers provides an explanation to why at least one group of short-time workers is not afraid of losing their workplace (see Section I). Being always prepared for job-changing, elementary workers feel secure, since they do not actually face a direct threat of unemployment.
Notice that not all short-timers are prepared to quit the firm as elementary workers. For instance, being female increases the probability of reduced-hours experience, but it is not consistent with the status of a male worker mostly related to external mobility.
Thus, the hypothesis (H2) related to the segmentation of the short-time workers is confirmed regarding outside job options.
(ii) If H1 is correct, that is if it is true that unpaid leaves are related to specific skills, one should expect a positive correlation between unpaid leaves and longer tenure. Our regression results show that this is actually the case for all four tenure variables (in 1994 and in 1996).
(iii) In the same vein, professional structure of external mobility largely confirms this relationship between the nature of employees' skills and the forms of labor "retaining". Our findings show that quits are strongly related to the absence of firm-specific competencies (elementary professions). On the contrary, despite the fact that we have already established the link between staying within a firm and having specific skills (see previous point (ii) on longer tenure and unpaid leaves), the negative correlation between some of the short-tenure variables and employees with specific knowledge (engineers, drivers) still holds. The Hypothesis 1 is again confirmed.
(iv) The wage arrears appear to produce a coherent effect. The duration and the amount of arrears are likely to increase the tenure. We propose a following explanation of this result. Accepting wage arrears is primarily related to the limited job opportunities. Specific skills could play an important role in employees' "tolerant" attitude. Thus, staying in firms with wage debts or accepting to be put on unpaid leaves have the same reasons: this type of employees wish to retain their jobs since they are not sure to utilize their knowledge elsewhere. The positive correlation between the duration of arrears and probability of being on unpaid leaves (see Table 5) seems to support this suggestion.
There is no evidence in the survey that social benefits play a substantial role in the workers’ attachment to the firms with “wage problems”. On the other hand, “demonetisation” of the employment relationship (goods and services instead of monetary wages) provokes immediately separations that, therefore, seem to be voluntary quits.
Table 8: Probability to Have a New Job in 1996 (probit regression)
New Job Variables in 1996 except
for labor "retaining" wage arrears
and In kind remuneration in 1995 Coef.
Standard error Gender 0.270** 0.102 Age -0.015** 0.004 Education (year) 0.020 0.026 Couple -0.086 0.107 Plots -0.284** 0.110 Informal Activity 0.253 0.168 Manager -0.119 0.350 Intelligentsia 0.110 0.195 Engineer -0.252 0.280 State servant -0.010 0.288 Trader-financier 0.348* 0.215 Technician 0.099 0.194 Workman 0.166 0.180 Farmer -0.230 0.261 Elementary job 0.534** 0.192 In the forces -0.101 0.553 Driver 0.028 0.263 Foreign 0.416* 0.237 Public 0.002 0.130 Private 0.327* 0.145 # Workers<100 0.281* 0.129 # Workers>500 0.043 0.129 Duration. Arrears in 1995 0.005 0.019 Am. arrears in 1995 0.004 0.007 Unpaid leaves in 1995 -0.041 0.177 Short-time work in 1995 0.087 0.110 In kind remuneration in 1995 0.372** 0.144
# of child in the household -0.067 0.050
# of elderly in the household 0.000 0.077
Low hh expenditure per capita in 1995 0.194* 0.095
Medium hh expenditure per capita in 1995 -0.134 0.132
Moscow-St Petersburg 0.603** 0.198 Northwest 0.495** 0.204 Center 0.177 0.181 Volga 0.069 0.184 Caucasus -0.037 0.214 Urals 0.287 0.181 Or. Siberia 0.296 0.205 Semi-urban 0.011 0.183 Rural 0.075 0.130 Constant -1.597** 0.451 Log Likelihood -568.5 Number of Observations 1975 Chi²(39) 127.1 Prob. >chi2 0.0000 Pseudo R² 0.10
Notes: Dependent variable
y=1 if the person has a new job in 1996 y=0 if the person had no new job in 1996
Legend:
*= statistically significant at the 5% level Sources: Panel data from RLMS, Rounds V, VI, VII
**= statistically significant at the 1% level
Reference variables: Clerk; Semi-public, # of employees between 100 and 500, High household expenditures per capita,
Table 9: Probability to Have Tenure Under 1 or 3 years in 1994 (probit regression)
Tenure Less Than One Year
Tenure Less Than Three Years Variables in 1994 Coef. Standard error Coef. Standard error Gender 0.380** 0.090 0.500** 0.075 Age -0.027** 0.004 -0.031 0.003 Education (year) 0.002 0.022 0.020 0.018 Couple -0.059 0.096 -0.082 0.080 Plots 0.035 0.128 -0.165 0.103 Informal Activity -0.115 0.141 0.115 0.114 Manager 0.046 0.270 0.008 0.221 Intelligentsia -0.232 0.172 -0.284* 0.137 Engineer -0.103 0.214 -0.384* 0.171 State servant -0.251 0.237 0.044 0.187 Trader-financier 0.211 0.186 0.141 0.158 Technician 0.027 0.155 -0.091 0.126 Workman 0.051 0.149 -0.178 0.122 Farmer -0.046 0.210 -0.115 0.168 Elementary job 0.563** 0.163 0.592** 0.138 In the forces -0.821 0.542 -0.638* 0.377 Driver -0.237 0.213 -0.259 0.170 Foreign 0.257 0.234 0.269 0.192 Public 0.267* 0.113 0.174* 0.087 Private 0.450** 0.127 0.320** 0.101 # Workers<100 0.114 0.099 0.241** 0.082 # Workers>500 -0.127 0.102 -0.024 0.083 Duration. arrears -0.088** 0.030 -0.031* 0.019 Am. Arrears -0.003 0.011 -0.011 0.008 Unpaid leaves -0.804** 0.176 -0.549** 0.108 Short-time work -0.126 0.099 0.012 0.078 In kind remuneration 0.127 0.139 0.081 0.114
# of child in the household -0.021 0.042 -0.083** 0.035
# of elderly in the household -0.052 0.070 -0.047 0.057
Low hh. expenditure per capita 0.009 0.092 -0.153* 0.075
Medium hh. expenditure per capita 0.011 0.103 -0.063 0.084
Constant -0.170 0.369 0.607* 0.308 Log Likelihood -786.0 -1234.0 Number of Observations 2190 2190 Chi²(41) 217.6 351.9 Prob. >chi2 0.0000 0.0000 Pseudo R² 0.12 0.125
Notes: Dependent variable: Sources: Panel data from RLMS, Rounds VI, VII
y=1 if the person had less than (1 or 3) year of tenure in 1994 y=0 if the person had more than (1 or 3) year of tenure in 1994
Regression is run with regional dummies and settlement type dummies. Legend:
*= statistically significant at the 5% level **= statistically significant at the 1% level
Reference variables: Clerk; Semi-public, # of employees between 100 and 500, Occidental Siberia and Urban
Table 10: Probability to Have Tenure Under 1 or 3 years in 1996 (probit regression)
Tenure Less Than One Year Tenure Less Than Three Years Variables in 1996 Coef. Standard error Coef. Standard error Gender 0.255** 0.097 0.334** 0.078 Age -0.022** 0.004 -0.027** 0.003 Education (year) 0.001 0.024 0.014 0.019 Couple -0.173* 0.099 -0.149* 0.081 Plots -0.171 0.109 -0.144* 0.081 Informal Activity 0.391** 0.151 0.242* 0.131 Manager -0.213 0.325 -0.245 0.255 Intelligentsia -0.158 0.174 -0.294/ 0.141 Engineer -0.383 0.253 -0.134 0.180 State servant -0.401 0.277 0.020 0.195 Trader-financier 0.017 0.188 0.010 0.161 Technician -0.253 0.177 -0.125 0.139 Workman -0.187 0.160 -0.105 0.128 Farmer -0.193 0.237 -0.039 0.185 Elementary job 0.319* 0.169 0.527** 0.144 In the forces -0.359 0.570 -0.020 0.346 Driver -0.702** 0.291 -0.371* 0.203 Foreign 0.215 0.240 0.184 0.193 Public 0.080 0.136 0.022 0.100 Private 0.401** 0.147 0.387** 0.112 # Workers<100 0.011 0.125 0.147 0.095 # Workers>500 0.000 0.122 -0.024 0.094 Duration. Arrears 0.001 0.018 -0.020 0.014 Am. Arrears -0.017** 0.005 -0.008** 0.003 Unpaid leaves -0.408* 0.200 -0.356** 0.137 Short-time work 0.071 0.105 -0.030 0.086 In kind remuneration 0.346** 0.131 0.199* 0.107
# of child in the household 0.041 0.049 -0.047 0.039
# of elderly in the household 0.022 0.075 0.018 0.060
Low hh expenditure per capita 0.174* 0.102 0.002 0.079
Medium hh expenditure per capita 0.098 0.119 0.030 0.092
Semi-urban -0.116 0.196 -0.265* 0.144 Rural -0.053 0.134 -0.106 0.102 Constant -0.468 0.415 0.590* 0.334 Log Likelihood -616.7 -1067.0 Number of Observations 1886 1886 Chi²(41) 177.0 276.1 Prob. >chi2 0.0000 0.0000 Pseudo R² 0.126 0.11
Notes: Dependent variable: Sources: Panel data from RLMS, Rounds V, VI, VII
y=1 if the person had less than (1 or 3) year of tenure in 1996 y=0 if the person had more than (1 or 3) year of tenure in 1996 Regression is run with regional dummies
Legend:
*= statistically significant at the 5% level **= statistically significant at the 1% level
Reference variables: Clerk; Semi-public, # of employees between 100 and 500, Occidental Siberia and Urban
Table 11: Probability to change enterprise, between 1994 and 1996 (probit regression) Changed Job Between 1994-1995 Changed Job Between 1995-1996 Changed Job Between 1994-1996 Variables
(are lagged, t-1) Coef.
Standard error Coef. Standard error Coef. Standard error Gender 0.227* 0.104 0.261** 0.101 0.300** 0.087 Age -0.020** 0.004 -0.011** 0.004 -0.019** 0.004 Education (year) 0.077** 0.027 0.022 0.026 0.050* 0.022 Couple -0.054 0.112 -0.185* 0.105 -0.148 0.094 Plots 0.045 0.151 -0.124 0.104 -0.071 0.128 Informal Activity 0.168 0.148 0.334* 0.155 0.239* 0.127 Manager -0.140 0.326 0.176 0.224 -0.254 0.279 Intelligentsia -0.240 0.198 0.061 0.193 -0.201 0.163 Engineer -0.048 0.232 -0.291 0.255 -0.128 0.195 State servant -0.280 0.277 -0.218 0.298 -0.325 0.229 Trader-financier -0.017 0.239 0.208 0.227 0.049 0.194 Technician -0.132 0.191 -0.004 0.188 -0.106 0.155 Workman 0.054 0.177 0.075 0.168 -0.001 0.145 Farmer 0.324 0.234 -0.158 0.243 0.101 0.198 Elementary job 0.359* 0.201 0.372* 0.184 0.369* 0.166 In the forces - - -0.283 0.527 -0.473 0.467 Driver 0.264 0.233 0.034 0.223 0.124 0.197 Foreign 0.218 0.253 0.419* 0.219 0.137 0.216 Public 0.121 0.122 -0.064 0.120 0.071 0.101 Private 0.242* 0.140 0.129 0.137 0.167 0.117 # Workers<100 0.010 0.113 0.208 0.128 0.145 0.097 # Workers>500 -0.169 0.114 -0.003 0.127 -0.056 0.098 Duration. arrears 0.025 0.026 0.023 0.015 0.028 0.022 Am. arrears -0.008 0.013 -0.001 0.007 -0.015 0.012 Unpaid leaves -0.023 0.136 0.109 0.158 0.021 0.112 Short-time work -0.036 0.109 0.151 0.105 -0.075 0.093 In kind remuneration 0.007 0.157 0.300* 0.138 -0.051 0.139
# of child in the household -0.016 0.050 0.013 0.048 0.015 0.042
# of elderly in the household 0.001 0.081 0.109 0.074 0.012 0.066
Low hh. expenditure per capita 0.088 0.106 0.076 0.094 0.060 0.089
Medium hh. expenditure per capita -0.040 0.122 -0.121 0.124 -0.024 0.101
Moscow-St Petersburg 0.066 0.195 0.467** 0.185 0.213 0.162 Northwest -0.250 0.208 0.257 0.196 -0.123 0.171 Center -0.002 0.156 0.020 0.167 -0.080 0.135 Volga -0.255 0.166 0.019 0.167 -0.168 0.139 Caucasus 0.026 0.176 -0.247 0.203 -0.115 0.152 Urals -0.300* 0.170 0.067 0.170 -0.291* 0.142 Or. Siberia 0.177 0.191 0.106 0.195 0.017 0.166 Semi-urban 0.082 0.158 -0.406* 0.205 -0.128 0.144 Rural -0.362** 0.140 -0.055 0.126 -0.204* 0.113 Constant -1.453** 0.439 -1.352** 0.432 -0.784* 0.368 Log Likelihood -574.2 -601.5 -854.0 Number of Observations 1825 1853 1902 Chi²(39) 83.6 102.5 107 Prob. >chi2 0.0000 0.0000 0.0000 Pseudo R² 0.068 0.078 0.059
Sources: Panel data from RLMS, Rounds V, VI, VII
Notes: Dependent variable
y=1 if the person changed enterprise during the period y=0 if the person did not change enterprise during the period Legend:
*= statistically significant at the 5% level **= statistically significant at the 1% level
Reference variables: Clerk; Semi-public, # of employees between 100 and 500, Occidental Siberia and Urban
IV. Discussion.
We can conclude that labor "retaining" mechanism is not homogeneous. Firm's behavior in this domain is linked to the labor segmentation. Each segment is composed by a large group of employees whose characteristics determine the specificity of employment policies. We can thus distinguish two major policies corresponding to different groups of workers (see scheme 1).
(i) "Administrative"-leave-policies reflect firms' efforts to keep employees with specific skills. Most of these workers have no choice since firm-specific competencies are not likely to be employed elsewhere. "Administrative" leaves represent a form of internal
flexibility and they have only a secondary effect on external mobility: keeping firm-specific workers favors pushing elementary workers outside the borders of the firm.
(ii) Short-time work reflects another form of internal flexibility, which is especially, related to continuous, though not always regular demand for elementary professions.
Contrary to the employees endowed with specific competencies, most of elementary workers are not integrated into the enterprise, they can easily quit it, thus playing an important role in the connection between internal mobility (participating in the reduced hours practices) and external mobility (job-to-job changing across the firms).
Finally, the role of wage arrears in the internal labor adjustment is similar to unpaid leaves practices. Wage arrears for both amount and duration of arrears, are likely to be related to long tenure. For employees who have few external opportunities and, therefore, are "locked" within their firm there is practically no other solution than to accept wage arrears. In this case, managers utilize wage arrears as an additional means of internal adjustment. The fact that the probability to be on unpaid leaves is positively correlated with the duration of arrears
supports this interpretation. However, there could be also a problem of wage arrears definition, since employees sent on "administrative" leaves often consider themselves as suffering from wage debts even if formally firms do not owe them any wages.
These results are consistent with the evidence provided by much of case studies (Koshman, 1995; Samara Research Group, 1996): enterprises continue to experience labor shortages when they have to meet orders. Facing extreme uncertainty on the product market managers' reaction consists in using various forms of internal flexibility. Therefore the rational behavior is to create and keep a permanent reserve of human resources every time a firm (or one of its departments or workshops) has to meet a sudden increase in demand.
The question is: in what kind of human resources are Russian enterprises interested? The outlined results allow us to test the "technological" argument (Commander et al. 1995). This argument points out firm-specific nature of human resources and hence the extremely complementary characteristics of labor-capital relation (Grosfeld et al., 1999). Our results show that keeping firm-specific competencies as a part of the firms' strategies
represents a form of internal flexibility, i.e. labor adjustment, which explains relative
employment stability. The distinction between blue collar and white collar employees seems to be undetermined in this context since the firm-specific competencies concern more diversified groups of employees, including in particular engineers and most of workers.
Nevertheless, the firm-specific explanation provides only a part, though important, of understanding relative employment stability.
The results show also that the second form of labor adjustment is related to the evident need to hire "labor in general". In other words, in the context of continuing
degradation of physical capital stock, labor tends to substitute capital which is necessary to face the extreme product market uncertainty. This evidence is also in accordance with the results of different case studies (Donova, 1996). Investment fall in Russian economy creates permanent needs in unskilled workers (or former skilled employees who accept to work as unskilled workers) which firms try to meet by the recourse to the internal mobility (reduced-hours policy) or to the external labor market.
V. Conclusion
• First, what is usually qualified, as labor hoarding seems to represent particular forms of labor adjustment and internal flexibility. Two forms have been investigated in this paper: unpaid leaves and short-time work work.
• Second, unpaid leaves and short-time work correspond to different segments of labor. However, this segmentation is not reduced to a simplified opposition blue collar versus white collar.
• Third, at least these two forms of labor adjustment provide us a robust explanation of labor-output Russian paradox. Both of them stimulate internal labor reallocation.
Scheme 1: Internal Flexibility and External Mobility
Short-time work
Elementary professions
"Mobile"
Unpaid leaves
Engineers
Workmen
"No exit"
Exit
Elementary
Professions
Enterprise A
Unemployment
Enterprise B
Professional Mobility
REFERENCES
Clarke S. (1998), "Structural adjustment without mass unemployment? Lessons from Russia", in S. Clarke (ed.), Structural adjustment without mass unemployment? Lessons from
Russia, Edward Elgar, Cheltanham, pp. 9-86.
Commander S., J. McHale and R. Yemtsov (1995), "Russia", in S. Commander and F. Coricelli (eds.), Unemployment, restructuring and the labor market in Eastern Europe and
Russia, Washington, D.C., The World Bank, pp. 147-191.
Donova I. (1996), "A Miner's Town: From the Problem of Employment to the Problem of Personnel Management", in Clarke S. (ed.), Labor Relations in Transition: Wages,
employment and industrial conflict in Russia, Edward Elgar, Cheltanham, pp. 160-176.
Earle J.S. and K.Z. Sabrianova (1999), "Understanding wage arrears in Russia", - SITE
Working Paper n. 139, Stockholm, January, 56 p.
Fay J.A. and J.L. Medoff (1985), "Labor and Output Over the Business Cycle: Some Direct Evidence", - American Economic Review, vol. 75, n.4 (September) pp. 638-655.
Gimpelson V. and D. Lippoldt (1997), "Labor Turnover in the Russian Economy", in
Labor Market Dynamics in the Russian Federation, OECD Proceedings, Paris, pp. 17-56.
Gimpelson V. and D. Lippoldt (1999), Labor Turnover in Russia: Evidence from the
Administrative Reporting of Enterprises in Four Regions, Transition Economic Series, n. 4,
IHS, Vienne.
Greene, W. H. (1993), Econometric Analysis, Macmillan, second edition, New York. Grosfeld I, Senik-Leygonie C., Verdier T., Kolenikov S., Paltseva E., (1999), "Dynamism and Inertia on the Russian Labor Market. A Segmentation Model", Delta working
paper, n°1999-03, Paris.
Kabalina V.I., I.M. Kozina and I.V. Donova (1996), "Restrukturirovaniye zaniatosti na predpriyatiyakh i razvitiye rynka trouda v Rossii", - Obchestvo i ekonomika, n. 9-10, pp. 112-142.
Koshman M.V. (1995), "Zavod spetsialnogo oborudovania", - In: Gertchikov V.I. et Kochman M.V. (éds.), Sobstvennost' i trudovye otnochenia : varianty transformatsii. Sbornik keisov, IEiOPP, Novosibirsk, pp. 71-104.
Layard R. and A. Richter (1995), "How much unemployment is needed for restructuring: the Russian experience", - Economics of transition, vol. 3, n. 1, pp. 39-58.
Linz S.J. (1998), "Job Rights in Russian Firms: Endangered or Extinct Institution?"
-Comparative Economic Studies, n. 4 (Winter), pp. 1-32.
Najman B. and A. Pailhé (2000), External Labor Mobility in Russia: from Jobs to Plots, paper presented at the 48th. IAES Conference in Montreal, June, 48 p.
Russian Economic Trends (1999), various issues.
Samara Research Group (1996), "Two military-industrial giants", - In: Clarke S. (ed.), The Russian enterprise in transition. Case Studies, Edward Elgar, Cheltenham, Brookfield, pp. 248-332.
Smirnov P. (1998), "The economic development of industrial enterprises and the dynamics and structure of employment", in S. Clarke (ed.), Structural Adjustment without Mass
Unemployment? Lessons from Russia, Edward Elgar, Cheltanham, pp. 186-199.
Standing G. (1994), "Why Measured Unemployment in Russia Is So Low: The Net With Many Holes", - Journal of European Social Policy, 4 (1), pp. 35-49.
Standing G. (1996), "Reviving Lost Souls: Russian Enterprise Restructuring", ILO, Geneva
Standing G. (1998), "Reviving Lost Souls: Russian Enterprise Restructuring", in S. Clarke (ed.), Structural adjustment without mass unemployment? Lessons from Russia, Edward Elgar, Cheltanham, pp. 147-185.
Appendix
APPENDIX 1: Job Tenure average by professions in 1996 Tenure less than 1
year (In % of the total)
Tenure less than 3 years (In % of the total)
Tenure N With Tenure Average years Standard error Total 24 % 41% 8.7 9.3 2711 engineer 18% 31% 12.0 10.6 130 intelligentsia 21% 34% 10.4 10.1 372 workman 23% 39% 9.8 10.0 742 farmer 23% 41% 9.7 10.1 198 technician 19% 37% 9.3 9.2 292 driver 19% 32% 8.8 8.3 125 clerk 26% 40% 8.1 8.6 242 manager 24% 51% 7.0 8.9 46 state servant 21% 48% 6.6 7.1 100 in the forces 12 % 40 % 5.8 4.2 26 trader-financier 34% 56% 5.3 6.5 170 elementary job 40% 60 % 4.6 5.9 268
APPENDIX 2: Tenure within individual and household characteristics in 1996 Tenure less than 1
year (In % of the total)
Tenure less than 3 years (In % of the total)
Tenure N With Tenure Average years Standard error Gender Male 26% 45% 8.5 9.5 1209 Female 23% 38% 8.9 9.1 1404 Age Less than 25 56% 80% 1.9 2.3 207 25-40 26% 44% 5.9 5.4 1075 40-55/60 19% 33% 11.5 10.2 1093 Over 55/60 16% 29% 15.0 13.6 238 Education Primary 17% 34% 11.1 11.1 102 Secondary 25% 43% 8.5 9.1 1261 University 24% 40% 8.8 9.3 1250 20% 37% 9.0 9.4 616 17% 36% 8.5 8.8 179 27% 43% 8.8 9.3 1818 23% 42% 8.8 9.4 781 26% 44% 8.9 9.8 539 24% 40% 8.6 9.1 1293 Type of Settlement Rural Semi-urban Urban Household Expenditures1 High Medium Low Work on Plots No 27% 45% 7.9 8.6 1851 Yes 18% 33% 10.7 10.5 762 Informal Activities No 24% 41% 8.7 9.3 2447 Yes 30% 43% 8.2 9.2 166
Sources: RLMS, round VII
1 The households expenditures are per capita, and adjusted by the oxford scale (here 0.5 for child, and 0.75 for
APPENDIX 3: Tenure within enterprise characteristics and employment policy in 1996
Tenure less than 1 year (In % of the total)
Tenure less than 3 years (In % of the total)
Tenure N With Tenure Average years Standard error Firm size <20 30% 50% 7.2 8.8 341 21-100 26% 41% 8.4 8.9 594 100-200 17% 31% 10.1 9.6 211 201-500 24% 43% 9 9.5 236 Over 500 13% 26% 12.1 10.1 341 Ownership State 22% 39% 8.9 9.3 1580 Semi-public or Partnership 19% 37% 10.1 9.8 458 Private 32% 48% 7.6 9.0 557 On Short-time work No 23% 40% 8.7 9.2 2207 Yes 30% 44% 8.7 9.7 406 25% 43% 8.5 9.2 2373 16% 27% 11.8 10.2 215 On unpaid leaves No Yes