HAL Id: halshs-00331322
https://halshs.archives-ouvertes.fr/halshs-00331322
Submitted on 16 Oct 2008
HAL is a multi-disciplinary open access archive for the deposit and dissemination of sci-entific research documents, whether they are pub-lished or not. The documents may come from teaching and research institutions in France or abroad, or from public or private research centers.
L’archive ouverte pluridisciplinaire HAL, est destinée au dépôt et à la diffusion de documents scientifiques de niveau recherche, publiés ou non, émanant des établissements d’enseignement et de recherche français ou étrangers, des laboratoires publics ou privés.
Migration Impact on Moroccan Unemployment : a
Static Computable General Equilibrium Analysis
Bernard Decaluwé, Fida Karam
To cite this version:
Bernard Decaluwé, Fida Karam. Migration Impact on Moroccan Unemployment : a Static Com-putable General Equilibrium Analysis. 2008. �halshs-00331322�
Documents de Travail du
Centre d’Economie de la Sorbonne
Maison des Sciences Économiques, 106-112 boulevard de L'Hôpital, 75647 Paris Cedex 13
http://ces.univ-paris1.fr/cesdp/CES-docs.htm
Migration Impact on Moroccan Unemployment : a Static
Computable General Equilibrium Analysis
Fida K
ARAM,Bernard D
ECALUWE2008.52
Migration Impact on Moroccan Unemployment: a
Static Computable General Equilibrium Analysis
∗Fida Karam
†Bernard Decaluw´
e
‡April 2008
First version: March 2007
Abstract
Recently, much research interest is directed towards the impact of migration on the sending country. However, we think that this literature does not successfully analyse the effects of migration on unemployment and wage rates especially in urban areas. It studies the effect of one kind of migration flow, mainly inter-national migration, on labour market in the country of origin and shows that international migration is able to reduce the unemployment rate and/or raise the wage rate. However, it is common to find labour markets affected simultaneously by inflows and outflows of workers. Using a detailed CGE model applied to the Moroccan economy, we show that if we take simultaneously into account Moroc-can emigration to the European Union, immigration from Sub-Saharan Africa into Moroccan urban areas and rural-urban migration, the impact on Moroccan urban labour market disaggregated by professional categories is ambiguous. Keywords: Imperfect labour market, Migration, Computable general equilib-rium model.
JEL Classification: C68, F22, J44, J61, J64
1
Introduction
Analysing the impact of migration on Moroccan unemployment is an interesting question. Unemployment, which represented less than 17% of the economic causes of emigration before 1960, far behind the search for a more lucrative work (50%) or the improvement of the living standards (25%), became the principal economic
∗
We thank Lionel Fontagn´e for excellent suggestions and fruitful discussions.
†
Paris School of Economics, University of Paris 1 & CNRS, Sorbonne Economic Center (TEAM), 106-112 boulevard de l’Hˆopital, 75647 Paris Cedex 13, France; [email protected]
‡
Laval University, Economic Department, Pavillon J.-A.-DeS`eve, Quebec, Canada G1K 7P4; [email protected]
cause of emigration in the 90s. According to the data collected by Hamdouch (2000), 41% of answers indicate unemployment as the first cause of emigration, whereas the search for a more lucrative work and the improvement of the standard of living represent 38% and 14% respectively of the reasons for emigration. The relation between migration and economic development of the country of origin has not been correctly addressed for a long time primarily because of the scarcity of reliable data on migratory flows and migrants characteristics at the macro and micro levels1. In the majority of the cases, studies have mainly analysed the impact of migration on the country of destination2, and in very rare occasions on the country of origin. Only a limited number of studies address the impact of migration (directly or indirectly through remittances) on inequality and wages, growth and welfare, its social effects (children health, education, women’s role...), or the impact of returned migrants who acquired experience in the host country and the relation between migration and trade3. The “brain drain” and “brain gain” were also the issue addressed by several works.
The very few works that try to encircle in a systematic way the impact of migration on labour market are limited to the effect of international migration on unemployment in developing countries. However, it is common to find that labour mobility is observed in several directions. For example, a transitory South-South migration, from a developing country towards another before migrating to a developed country, can coexist with internal migration from rural to urban ar-eas, or emigration to more developed countries. The combination of these forces is able to exert unexpected effects on the labour market, and in order to under-stand them and study their consequences, we choose the Moroccan case. Indeed, Morocco seems the typical example of a developing country undergoing the com-bination of different migratory flows: rural and urban emigration towards the European Union, internal migration from rural to urban areas, and finally Sub-Saharan immigration to Morocco for transit towards Europe or in order to stay there definitely.
A sketchy analysis of the impact of these migratory flows on unemployment and labour remuneration would lead us to conclude that on one hand, urban emigration reduces urban unemployment rates and raises wages, whereas inter-nal migration and Sub-Saharan immigration to the cities increase the pressure on urban labour market. However, the simultaneous impact of these different forces on labour market conditions cannot be predicted without ambiguity since it will depend on the magnitude of each migratory flow and the initial condi-tions of the labour market. If internal migration to urban areas and Sub-Saharan immigration to Morocco dominate urban emigration, urban unemployment rate
1Fortunately, databases become increasingly available, like the one of Docquier and Marfouk
(2004) on brain drain.
2For a review of the literature on the effects of migration on the destination country, see
Drinkwater et al. (2003).
3For a review of the literature on the effects of migration on the sending country, see Katseli
must increase. Conversely, if urban emigration overrides internal migration and Sub-Saharan immigration, unemployment rate will probably decrease.
In order to take the existing forces simultaneously into account, we build a computable general equilibrium model. This method allows to endogenize the principal determinants of migratory flows and to capture their simultaneous di-rect effects on urban labour market, particularly on unemployment, and their direct and indirect effects on the remainder of the economy. Contrary to other studies on this question4, we do not think that an aggregate approach is sufficient to seize the complexity of the existing mechanisms, and this is why we have privi-leged a fine disaggregation by professional categories. This fine description of the labour market which will take into account unemployment rates by professional categories is justified by the fact that emigration and immigration do not affect all categories in the same way. It will enable us to seize the impact of migration on each segment of labour market.
The paper is structured in five sections. Section 1 is an introductory section. Section 2 describes Moroccan labour market. Section 3 presents, in addition to the general structure of the CGE model we have built, the principal characteristics of the migratory block. Section 4 shows the results of a 10% fall in migration costs, a 10% rise of the Sub-Saharan immigrant stock, and finally, the simultaneous effects of the two previous shocks. Section 5 concludes and discusses the economic policy implications of this study.
2
Short description of the Moroccan labour market
Data from OECD (OECD 2006) indicate that the traditional destinations of Moroccan international migrants such as Belgium, France, Spain, Italy, and the Netherlands continue to receive important migratory flows. Thus, in 2004, 8,000 Moroccans entered to Belgium, 21,700 to France, 24,600 to Italy, 3,300 to the Netherlands and 58,800 to Spain, with 21.5% of the foreign population living in Spain in 2002. Moroccan Spanish represented the largest foreign community in this country. Moreover and according to an opinion of the International Organi-zation of Migration, Moroccan migration towards the European Union is mostly originated from rural areas (Van der Erf and Heering (2002)).
Concerning internal migration, climatic risks associated to agricultural pro-duction induce farmers migration towards the cities. These rural workers search for a stable employment in order to mitigate the fall or the great fluctuations of their agricultural income. The available estimations indicate that each year, approximately 200,000 migrants move into urban areas, which is equivalent to 40% of the total increase in urban population (Ag´enor and El Aynaoui (2003)).
The extremely fast expansion of clandestine migration from Sub-Saharan
Africa since the beginning of the 90s is due to the fragility of this continent. The exacerbation of poverty, the shortage of natural resources (water in particu-lar) and conflicts and wars of any nature encourage African immigrants to transit by Morocco in direction of Spain and Europe5 or to settle definitely in Morocco in order to profit from its stability and prosperity. One of the more important consequences of illegal immigration into Morocco is the fact that an increasingly significant number of Sub-Saharan immigrants, scalded by the difficulties they meet on the migratory way leading them to Europe, choose finally to stay in different Moroccan localities (rather urban). Data on Sub-Saharan immigration to Morocco are fragmentary and their collection is made difficult because the majority of African immigrants are illegal. Lahlou (2003) pointed out that there would be between 6,000 and 15,000 irregular migrants. We will retain the upper bound.
Let us examine Moroccan labour market characteristics6. National employ-ment is roughly equally distributed between rural and urban areas. In 2005, urban employment constituted 50.5% of national employment. This percentage varies slightly with respect to the previous years.
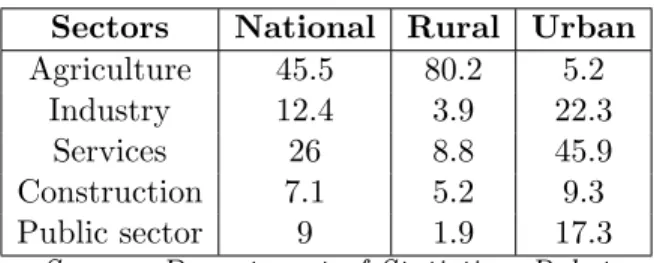
Table 1- Employment (%) by aggregate sectors of activity in 2005
Sectors National Rural Urban
Agriculture 45.5 80.2 5.2
Industry 12.4 3.9 22.3
Services 26 8.8 45.9
Construction 7.1 5.2 9.3
Public sector 9 1.9 17.3
Source: Department of Statistics, Rabat
The structure of employment by sectors of activity shows the relatively im-portant weight of agriculture. In 2005, this sector, absorbing 45.5% of national employment, predominates in rural areas, with 80.2% of total rural employment, and is particularly based on family work. The services sector is ranked second with 26% of national employment. However, it is the principal provider of urban employment (45.9%). The industrial sector occupies only 12.4% of total employ-ment (3.9% in rural areas against 22.3% in urban areas). The construction sector employs 7.1% of total labour (9.3% in the cities and 5.2% in the campaigns).
5
The transit by Morocco is explained by geographical reasons (Morocco being at 14 km of the Spanish coast), by historical, sometimes cultural and religious reasons, and by socio-economic reasons like the possibility to work on spot during the long waiting periods or all along the migratory way.
6The illustrative figures come from the survey of the Department of Statistics on activity,
employment and unemployment in 2005. The ventilation of employment between different pro-fessional categories is taken from the Analytical Nomenclature of Professions established by the Department of Statistics (2001).
Employment opportunities come principally from the private sector. The latter offers 91% of total employment at the national level (98% in rural areas and 83% in urban areas). On the other hand, the public sector employs primarily towns-men (17.3% of total employtowns-ment in the cities against only 1.9% in the campaigns).
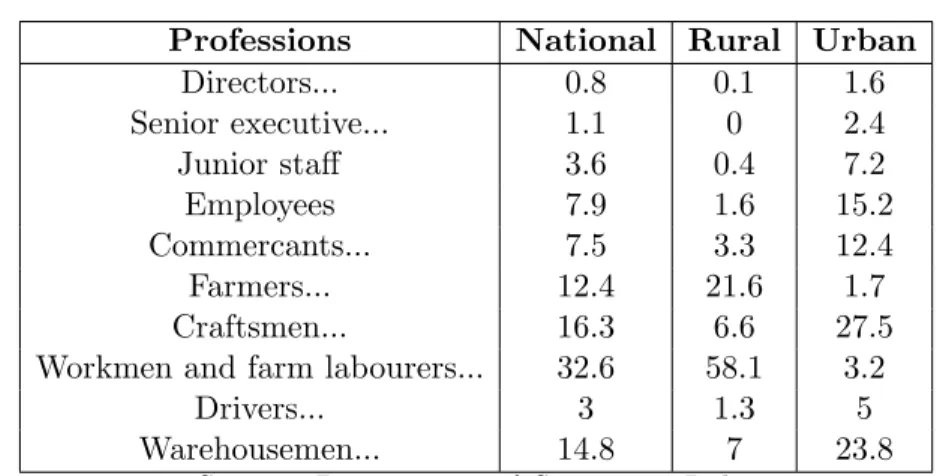
Table 2- Employment (%) by professional categories in 20057
Professions National Rural Urban
Directors... 0.8 0.1 1.6 Senior executive... 1.1 0 2.4 Junior staff 3.6 0.4 7.2 Employees 7.9 1.6 15.2 Commercants... 7.5 3.3 12.4 Farmers... 12.4 21.6 1.7 Craftsmen... 16.3 6.6 27.5
Workmen and farm labourers... 32.6 58.1 3.2
Drivers... 3 1.3 5
Warehousemen... 14.8 7 23.8
Source: Department of Statistics, Rabat
The distribution of Moroccan working population by professional categories shows that at the national level, the most exerted profession is “workmen and farm labourers”. The category “craftsmen and artisanal trades qualified workers” comes in the second place followed by the category “warehousemen and workers of small trades”. In rural areas, the category “workmen and farm labourers” occupies the first place followed by the category “farmers, fishermen, foresters, hunters and workers assimilate”, “warehousemen and workers of small trades” and “craftsmen and artisanal trades qualified workers”. The examination of ur-ban working population indicates that the share of the category “workmen and farm labourers” is not more than 3.2%, and the category “craftsmen and artisanal trades qualified workers” is henceforth ranked first followed by “warehousemen and workers of small trades”, “employees” and “commercants, commercial and financial intermediaries”.
In total, we display two segments of labour market: urban and rural, each one composed of 10 under segments of professional categories.
Table 3- National unemployment rate (%) by professional categories in 2005
7
Professions Unemployment rates Directors... 2.2 Senior executive... 1.7 Junior staff 6.1 Employees 11.2 Commercants... 3.2 Farmers... 0.3 Craftsmen... 10.1
Workmen and farm labourers... 2
Drivers... 8.5
Warehousemen... 12
Source: Department of Statistics, Rabat
As in many developing countries, unemployment in Morocco is primarily an urban phenomenon. Unemployment rate rose in 1999 to 22% and diminished to 18.3% in 2005. In contrast, rural unemployment rate is not more than 3.6% in 2005. At the national level, unemployment rate reached 13.9% in 1999 but fall to 11% in 2005. In addition, unpublished data provided by the Department of Statistics show that the professions “warehousemen...”, “employees” and “crafts-men and artisanal trades qualified workers” have the higher unemploy“crafts-ment rates (12%, 11.2% and 10.1% respectively). On the other hand, “farmers...” and “se-nior executive...” exhibit the lowest rates (0.3% and 1.7% respectively).
3
Theoretical framework
If we wish to analyse correctly the impact of migration on the different segments of labour market, it will be important to identify the origin of migratory flows. Thus and if one can think that Moroccan emigration from rural or urban areas will relax the pressure on the corresponding domestic labour markets, the drop in labour supply in the countryside or the city will induce a rise in rural or urban wages. Given that unemployment is an important characteristic of urban labour market, emigration of urban workers, when it touches mainly some professional categories, will obviously reduce unemployment rates for these categories and not for the others, if there is some degree of specificity of the qualifications. On the contrary, migration of rural workers towards cities and the entry of African immigrants into urban areas increase labour supply and unemployment rates of the different professions. Since emigration and immigration do not touch the same categories, their impact will be different from a market to another. It is also clear that the eventual labour surplus on some segments of labour market will reduce wages (freely fixed by the market or negotiated by the means of a wage convention). When these migratory flows coexist, the ultimate effect on urban unemployment rates by professional categories is ambiguous. In order to understand these effects, a fine modelisation of labour market, illustrative of all these migratory movements, is necessary. The remainder of this section describes the behavioural assumptions we retain.
Our benchmark computable general equilibrium model is a standard one in-spired from the model of Decaluw´e et al. (2001) developed by Cockburn et al. (2006). This basic structure will however be deeply modified in order to de-scribe adequately the behaviour of labour market and the internal and external determinants of migratory flows. Very briefly, our version of this model contains 34 monoproductive sectors distributed between two aggregate sectors: a rural sector (agriculture and fishing) and an urban sector (industry, tradable services and non tradable services); two factors of production (a labour factor bundle of the different professional rural/urban categories mobile between rural/urban sectors and a capital factor specific for each sector); five agents (rural and urban households, firms, government, and the Rest of the World). Then, we modify the specification of the rural sector in order to distinguish, within this sector, between subsistence agriculture and industrial agriculture. Given the relative complemen-tarity of capital and labour in the public value added, the latter is modeled using a Leontief function, contrarily to private value added represented by a CES8. We endogenize labour supply on each segment of labour market and we take into account unemployment rates by professional categories. We further assume that unemployed persons can not change their profession. In other words, the cross elasticity of labour supply should be null. Finally, we introduce a new block of equations relative to rural and urban emigration, internal migration from rural to urban areas and Sub-Saharan immigration, and we suppose the existence of migration costs. Our model is calibrated on the SAM of the year 1998.
We describe here the new equations. All the equations can be examined in Appendix 3.
3.1 Migratory flows
3.1.1 Migration costs
When an individual or a household migrates from a region to another or when he decides to leave his country, this can not be done without costs. Any migratory movement induces financial costs (travel cost, search for an apartment, search for a job...) and psychological costs (change of the way of life, adaptation to a new culture and a new community...) for the migrant. In order to express migration costs, we adopt the approach proposed by Chan et al. (2005): when workers migrate from a region to another due to wage differentials, their net wage in the region of destination is lower than the effective wage in this region, where the difference represents migration costs. To seize this phenomenon, the authors consider that this gap is equivalent to a reduction in household’s available time to work and results in a reduction of his labour endowment. In other words, migration costs are a fraction of the migratory flow. For lack of precise infor-mation on the width of this cost, we follow Chan et al. (2005) who postulate
that migration costs are equal to 10% of the international migratory flow. Given that migrant labour supply in the region of destination is reduced of 10%, total labour remuneration of their work decreases too. For internal migration, the cost of labour mobility is obviously lower than international mobility and we suppose that internal migration costs are equal to 5% of the migratory flow9. In the dy-namic version of the model, these costs are brought to decrease gradually during the first periods and vanish thereafter.
We neglect adjustment costs associated with Sub-Saharan immigration because we suppose that the latter is exogenous and not motivated by economic factors. Indeed, according to Lahlou (2003), political and security factors (disorders and conflicts between and inside several African countries) play a crucial role in stimu-lating illegal African immigration to Morocco. Thus, migration towards Morocco takes place whatever migration costs fall down or not.
3.1.2 Internal and international migration from rural areas
Two types of migratory flows take place from rural areas: internal migration towards the cities and international migration. In 1960, more than 70% of Mo-roccans lived in rural zones. Four decades later, they are not more than 46% due to internal migration from rural areas to cities and to foreign countries. Migra-tion phenomenon seems originated mainly from rural areas. The gap between annual growth rates of rural and urban populations, which was around 2.5% in 1960 (4.2% in urban areas against 1.7% in rural areas), rose to more than the 3% in the 90s. Moreover, in 1997, the growth rate of rural population was negative (Van der Erf and Heering (2002)).
In order to characterise this migratory movement, we postulate that the rural worker of professional category c carries out a choice in two stages: initially, he maximizes his expected income REV Rc considering the choice of staying in
Mo-rocco (staying in rural zones or migrating to the cities) or leaving the country10: M ax REV Rc = wncN ATc+ wice(1 − mc)EM Rc
s.t.
LSRc = Brc[$cN ATc(εc−1)/εc+ (1 − $c)EM R(εc c−1)/εc]εc/(εc−1) (1)
where
wnc is the national wage rate of professional category c,
N ATc Moroccan rural workers of category c who decide to stay in Morocco,
wic the international wage rate of category c in foreign currency,
9
The sensitivity analysis over the value of international and internal migration costs param-eters has revealed that the main results are not affected by the value of these paramparam-eters.
10Given that in CGE models we analyse the behaviour of a representative agent, N AT c and
EM Rc correspond to the number of hours that the representative worker of category c chooses
e the nominal exchange rate,
mc international migration costs expressed as a percentage of the migra-tory flow,
EM Rc the flow of Moroccan rural emigrants of category c,
LSRc the rural population of category c,
εc the elasticity of transformation (negative).
The percentage of rural emigrants is deduced from the optimisation problem: EM Rc N ATc = [ $c 1 − $c wice(1 − mc) wnc ]−εc (2)
In the second stage, the rural worker of category c who has decided to stay in Morocco carries out the choice of staying in rural areas or migrating to the cities. The potential internal migrant compares a rural job to an urban one belonging to the same professional category. Thus, labour supply of each professional category does not depend on the wage of the other categories. However, when he takes the decision to migrate to urban areas, he is aware of the possibility not to find a job there. Therefore, the expected urban wage of category c is equal to the urban wage of this category times the probability to find a job in town. This probability is itself equal to the ratio of total urban labour demand and total labour supply of category c: wac = wugc P upLUc,up+ P pubLGc,pub N AT Uc+ (1 − imc)M IGc+ IM M IGc (3) where
wugc is the average urban wage rate of professional category c,
LUc,up the labour demand of urban category c by urban private sector up,
LGc,pub the labour demand of urban category c by urban public sector pub,
N AT Uc Moroccan urban workers of category c who decide to stay in urban
areas
imc internal migration costs expressed as a percentage of the migratory flow,
M IGc migrants of category c from rural to urban areas,
IM M IGc the stock of African immigrants of category c.
The maximization problem of this potential internal migrant is written as follows:
M ax REV Ic = wac(1 − imc)M IGc+ wrcN AT Rc
s.t.
where
REV Ic is his expected income when he divides his working hours between
urban and rural areas,
wrc the rural wage rate of professional category c,
N AT Rc Moroccan rural workers of category c who decide to stay in rural
ar-eas,
%c the elasticity of transformation (negative).
The percentage of rural migrants to urban areas is then written: M IGc N AT Rc = [ ϑc 1 − ϑc wac(1 − imc) wrc ]−%c (5)
The elasticity of transformation is, in absolute value, lower in equation (2) than in equation (5), reflecting a much stronger preference of workers for their country of origin. This is due to higher costs associated to migration abroad. 3.1.3 Migration from urban areas
At his turn, the urban worker maximizes his expected income REV Uc by
choos-ing to stay in Morocco or to migrate abroad. Given that urban markets are imperfect, the urban worker is unable to offer all his disposable working hours. He is considered unemployed for the hours he can not offer. Therefore, to make his choice, he compares the international wage to the urban expected wage and solves the following maximization problem:
M ax REV Uc = wacN AT Uc+ wice(1 − mc)EM Uc
s.t.
LSUc= Bic[ξcN AT Uc(oc−1)/oc+ (1 − ξc)EM Uc(oc−1)/oc]oc/(oc−1) (6)
where
EM Uc represents Moroccan urban workers of category c who decide to
emi-grate,
LSUc the urban population of category c
oc the elasticity of transformation (negative).
The percentage of Moroccan urban workers of category c choosing to leave their country is given by:
EM Uc N AT Uc = [ ξc 1 − ξc wice(1 − mc) wac ]−oc (7)
Note that the elasticity of transformation oc is greater, in absolute value, than
the one of equation (2), reflecting less financial constraint for urban workers to migrate abroad, compared to rural workers. It is however lower than the one of equation (5) because the costs associated to internal migration are lower than those associated to international migration.
3.1.4 African immigration
To take into account the characteristics of the African immigrant, we suppose that, when he comes to stay in Moroccan cities, he does not have the same be-haviour of the Moroccan urban worker. He does not maximize his income by choosing to offer his work in Morocco or abroad. He comes to work in Morocco, fleeing war or poverty, in order to stay there definitely or to survive before mi-grating to Spain. The decision to migrate towards Europe is taken before the arrival to Morocco, and thus does not depend on the living conditions and on the wage differential between Morocco and the Rest of the World. Moreover, given that African immigration does not only occur for economic or financial reasons, but also for personal and security reasons, living conditions in Morocco and in particular urban wage variation will not affect Sub-Saharan immigration towards Morocco. For this reason, we choose to exogenize the stock of African immigrants in Morocco. This variable will be subject to a shock later on, a 10% rise of the Sub-Saharan immigrant stock, in order to study how exogenous reasons such as the exacerbation of poverty or conflicts in Sub-Saharan Africa can exert a strong pressure on the Moroccan economy.
In addition, the majority of these immigrants are not qualified, and if they are, they do not occupy qualified jobs in Morocco (shoe-makers, mason assistant, guards of private residences...). Therefore, we also assume that these African immigrants will occupy jobs of weak qualification. They will belong to the urban category “warehousemen and workers of small trades”. Moreover, these immi-grants are not perfectly substitutable to local labour. The majority of them being clandestine, they can only work in the informal sector. Thus, a company that employs workers belonging to the above category does not pay social security contributions on the wages assigned to African immigrants, contrary to nationals belonging to the same category. Urban labour demand of category “10” (“ware-housemen and workers of small trades”) by urban private sector up is a CES function of national and foreign workers. Relative demand of foreign workers is deduced from the wage cost minimization problem of sector up:
M in wupupLU“10”,up= (1 + cs)wu“10”N AT Iup+ wu“10”ET Rup
s.t. LU“10”,up= Aiup[ΩupN AT I(ςup −1)/ςup up + (1 − Ωup)ET R(ςup −1)/ςup up ]ςup/(ςup−1) (8) where
wupup is the average wage of category “10” in sector up, given by the
follow-ing equation: wupup=
(1 + cs)wu“10”N AT Iup+ wu“10”ET Rup
LU“10”,up the urban labour demand of category “10” by private urban sector
up,
cs social security contributions,
wuc the private urban wage of category c,
N AT Iup the demand of domestic workers belonging to category “10” by
sec-tor up,
ET Rup the demand of foreign workers belonging to category “10” by sector
up,
ςup the elasticity of substitution between nationals and immigrants in
se-ctor up (positive).
This elasticity can be interpreted as a parameter of “repression” reflecting the fear of the firm from being punished for having engaged informal Sub-Saharan workers. The weaker the elasticity is, the more the repression is strong and less the firm will change the proportion of domestic and foreign workers after the vari-ation of their relative wage. Conversely, more the elasticity is strong, more the repression is laxist and more the firm will be incited to engage Africans when their relative wage decreases. The parameters of distribution Ωup and (1 − Ωup) are
then interpreted as parameters of “tolerance”, i.e. the proportions of nationals and Sub-Saharan immigrants socially accepted for a given level of the parameter of “repression”.
Relative demand for Sub-Saharan labour is therefore written: ET Rup N AT Iup = [((1 − Ωup) Ωup )(wu”10”(1 + cs) wu”10” )]ςup (9)
Social security contributions cs are fixed to 20% of the private urban wage of each professional category. The employer pays 18,6% of the gross salary to the Social Security for contributions to retirement and other social security covers, and an obligatory tax of 1.6% imposed on the wage bill as a contribution to the financing of the public system of vocational training.
Therefore, social security contributions create a gap between the wage paid by firms and labour remuneration received by households and the Rest of the World. They are modeled explicitly in the urban private sector and in industrial agriculture. On the other hand, we assume that they are null in subsistence agriculture where a significant part of labour comes from family work. In addition, they are neglected in the public sector because if they are paid by public firms, they are received by the agent “government” which is constituted of the Central Government and public firms.
3.2 A particular treatment of the rural sector
We distinguish, within the rural sector, two types of agriculture: subsistence agriculture and industrial agriculture. This modeling agrees perfectly with the reality of Moroccan agriculture of which a considerable share is for subsistence11. With agricultural production directed towards the domestic market, the subsis-tence sector satisfies consumers final demand and its production is not used as an intermediary input in other industries. By opposition, industrial agriculture delivers intermediary inputs to industrial and food processing industries. It is intended to domestic and international markets and resorts to production tech-niques different from subsistence agriculture (transport, storage, conditioning, quality control...). The fishing sector is associated to industrial agriculture be-cause Moroccan fishing is primarily industrial: domestic consumption remains very weak and is only around 6 kg/person. The canning facility corresponds to one third of pelagic catches, the remainder being intended to flour and fish oil production. We will also assume that subsistence agriculture uses only labour for production, whereas industrial agriculture uses labour and capital.
As it is known, the history of Moroccan agriculture is marked by frequent pe-riods of dryness and extreme pluviometric fluctuations. The successive drynesses in 1981, 1983 and 1984 induced a negative growth rate of agricultural production (-1,9% on average). Such periods are heavy on the peasants who live from land and do not have other incomes12. Often, they will be obliged to move in order to seek a job allowing them to mitigate the fall of their agricultural income.
What will be the impact of these variations of rural working population on agricultural production? In principle, production should be done in the zone of decreasing marginal productivity of the mobile factor (to the right of the inflec-tion point in figure 1). However one can think that it is not necessarily the case. Indeed, given that the departure of peasants into urban areas increases agricul-tural properties (for example after the sale of lands by leaving peasants) or leads to the abandonment of less productive pieces, the variations of rural working population can drive us to the left of our inflection point, which is a zone where marginal labour productivity is increasing. In the same way, the opposite move-ment of eventual comeback of urban workers to rural areas could lead to a fall in agricultural marginal productivity because of land bursting or the exploitation of more arid and less productive zones.
11
By definition, subsistence agriculture (also known as self sufficiency) is a method of farming in which farmers plan to grow only enough food to feed the family farming, pay taxes, and perhaps provide a small marketable surplus. This definition is problematic because when the production is intended to feed the family, it will not be offered on the domestic market and there-fore will not enter national statistics. Here, we mean by subsistence agriculture the production of foodstuffs that uses traditional production techniques and is offered on the domestic market in order to satisfy the representative consumer demand and not only peasants’ consumption.
12
Certainly, transfers from internal and international migrants to their family in rural areas can compensate for the loss of their agricultural income. However, given that transfers are not only allocated to consumption but also to investment, this requires a dynamic CGE model and not a static one, as it is the case of our model.
Agricultural
VA
Agricultural labor
Figure 1:
In order to model this phenomenon and to allow a change of regime (to pass from a situation of increasing productivity to a situation of decreasing productiv-ity) after the migratory movements between rural and urban areas, we adopt for subsistence agriculture a value added function of the Weibull type13 represented by figure 1:
V A“sa”= a(1 − e−(LDR“sa”/b)
f
) (10)
where
LDR“sa” is the labour demand by the subsistence agriculture sector,
a, b, f parameters in the Weibull function.
Subsistence agriculture value added being created only by labour, we can write labour demand by this sector in the following form:
LDR“sa” =
P V“sa”V A”sa”
w“sa”
(11) where
P V“sa” is the value added price of subsistence agriculture,
w“sa” the wage in the subsistence agriculture sector.
In other words, and contrary to industrial agriculture, all the profits of this sector are incorporated in labour remuneration.
The parameter f is fixed to 2.2814, which corresponds to a symmetric func-tion. In order to calibrate the parameters a and b, we must make an assumption about the volume of labour corresponding to the inflection point. For that, let us
13
This is not possible with a CES function which models a productivity either increasing, or decreasing, but not both at the same time.
postulate that, before any migratory movement from rural areas, labour marginal productivity is decreasing. Once rural workers leave the countryside towards ur-ban areas or abroad, we suppose that labour demand by subsistence agriculture corresponds to the inflection point of figure 1.
3.3 The public sector
Contrary to production functions characterising private firms behaviour that choose the volume of labour and capital in order to maximize their profits, we postulate that the value added of non tradable public services is a “Leontief” com-bination of the two factors of production. Indeed, the government as a producer of services does not have an optimisation behaviour. Thus, for each job created in the public sector, the government must mobilize some quantity of capital (public buildings, etc...) and add this cost to the remuneration of civil servants. The value added in the public sector is then written:
V Apub = KDpub/kpub (12)
and labour demand by this sector:
LDGpub = lpubV Apub (13)
where
V Apub is the value added of public sector pub,
KDpub the capital demand by public sector pub,
kpub a technical coefficient in the Leontief value added function,
LDGpub the labour demand by public sector pub,
lpub a technical coefficient in the Leontief value added function.
Moreover, we will assume that the government needs a constant proportion of each professional category. Therefore, if the wage of engineers increases, it cannot replace them by office workers. By postulating that labour demand of category c by the public sector is insensitive to the variation of relative wages, we can express total labour demand by non tradable public services as a Leontief function of labour demand by professional categories, that is to say:
LGc,pub = LDGpublcc,pub (14)
where
LGc,pub is the labour demand of category c by public sector pub,
lcc,pub the technical coefficient of the Leontief public labour demand
funct-ion.
In tradable sectors, firms maximize their profits. Then, if the capital available is sectoral specific, the profit or capital remuneration is residual and varies from a sector to another. This approach is obviously irrelevant for the public sector since the government, as a supplier of non tradable services, does not have an
optimisation behaviour. The cost and thus the price of public services is then the result of the combination of wage and capital costs. Consequently, we normalize the rental rate of capital in the public sector and we calculate capital demand in the following way:
KDpub =
P VpubV Apub− wpubLDGpub
rpub
(15) where
P Vpub is the value added price of public sector pub,
wpub the wage of public sector pub given by the following equation:
wpub= X c LGc,pubwgc LDGpub (16)
wgc the public wage rate of professional category c,
rpub the rental rate of capital in public sector pub.
According to the World Bank (2002), monetary compensations in the public sector are, in Morocco, 8% higher than in the private sector. If we add to that nonpecuniary compensations, like job security and the existence of generous pen-sion funds, the divergence between the public and private sectors becomes larger. According to the National Survey on Household Living Standards in 1998-1999, this corresponds to a public wage of 1.5 to 2 times higher than private sector wage. The existence of an important wage differential between the public and private sectors leads to an excessive labour supply in the public sector and, in particular for young and qualified people, waiting unemployment and a high reservation wage. We take into account this wage differential in the calibration procedure by postulating that:
wgc wuc (17)
The public wage by professional category wgc is also considered exogenous. This
wage rigidity allows internal migration flows in spite of urban unemployment rates.
3.4 Endogenization of labour supply by professional categories The assumption of a representative agent usually used in the literature on CGE models is not without posing conceptual difficulties when it is applied to the household agent. Indeed, incomes and in particular labour incomes of this “house-hold” come from the participation of a multitude of individuals to different labour markets. In our model, wage rates are different between categories and the in-crease in the wage rate of a professional category does not induce necessarily a fall in labour supply of another category. In other words, the concepts of cross elasticities loose their significance when the representative agent is composed of
individuals having different qualifications.
In order to solve this problem, Decaluw´e, Lemelin, Bahan and Annabi (2005) proposed to describe each representative household as a group of individuals, each one belonging to a professional category and exerting only one profession. Each individual of this group maximizes its utility independently from the others, taking into account its own preference for leisure. Thus, labour supply of each member (or each professional category) is independent from the wage rate of the other members (or categories) and thus the opportunity cost of leisure differs between members. This approach is similar to a particular case of the collective household model (Chiappori 1992) where the decision process is carried out in two stages: initially, income - here non-labour income - is divided between house-hold members. Then, each member maximizes his utility independently from the others.
We follow this approach and postulate that the individual carries out an ar-bitration between the time allocated to work and the time allocated to leisure. Given that leisure is considered as a normal good, its opportunity cost is equal, in presence of unemployment, to the expected wage rate of the corresponding professional category, which is the product of the wage rate by the probability of being employed. In other words, we suppose that unemployment on urban labour market c affects proportionally all individuals who offer this type of work. When the expected wage increases, an income effect and a substitution effect come into play. On one hand, the rise in wage rate increases the leisure opportunity cost, and therefore the individual raises his labour supply. This is the substitution effect. On the other hand, the rise in wage rate induces an increase in the con-sumption of all goods, including leisure (a normal good), and consequently a fall in labour supply. This is the income effect. The final effect on labour supply depends on the extent of the two effects: if the substitution effect dominates, the labour supply curve is increasing. If the income effect is greater than the substitution effect, the labour supply curve is decreasing. It is called “Backward-bending” (Hanoch 1965). It will have the form of figure 2. For our simulations, we will assume that the substitution effect dominates and that the labour supply curve has a positive slope review!!!!.
The consumer carries out initially the choice between the consumption of goods and the consumption of leisure, using an ELES function14. In order to define the optimisation problem of household’s member c using a Stone-Geary utility function, it is necessary to separate between household members the min-imum level of consumption of each good and service i as well as the non-labour
14
Extended Linear Expenditure System (Lluch 1973). The ELES demand function is obtained from a static maximization problem of the Stone-Geary function, considering savings as a good with a null minimum consumption. In our problem of labour supply endogenization, we replace savings by leisure and we consider that the household must also consume a minimum level of leisure (De Melo and Tarr 1992, Deaton and Muellbauer 1980).
Wage rate Working time w* Figure 2:
income. Let λc be the share of household’s member c, with
λc = wcPjLDc,j P c(wcPjLDc,j) and X c λc= 1.
The optimisation problem of household’s member c is written: M ax Uc =
X
i
mi,cln(Ci,c− λcCmini) + βcln(T N Lc− T N Lminc)
s.t. X i P CiCi,c = (1 − ψ)(1 − ty × adj)wc X j LDc,j+ λc(1 − ψ)(1 − ty × adj)[Y − X c (wc X j LDc,j)] = prlc(Tc− T N Lc) + λc(1 − ψ)(1 − ty × adj)[Y − X c (wc X j LDc,j)] where
Uc is the utility of household’s member c,
mi,c the budgetary share of good i in the supernumerary income of member c,
Ci,c member c’s consumption of good i,
Cmini household’s minimum consumption of good i,
βc the leisure share in member c’s income,
T N Lc the leisure time of member c,
P Ci the composite price of good i,
ψ the marginal (and average) propensity to save applied uniformly to all household members,
ty the direct tax rate on household income applied uniformly to all house-hold members,
adj a compensatory tax,
wc the wage of professional category c,
LDc,j the labour demand of professional category c by sector j,
Y the total income of the representative household, prlc the leisure opportunity cost of member c given by:
prlc = (1 − ψ)(1 − ty × adj)(1 − uc)wc
uc the unemployment rate of professional category c,
Tc the total available time for member c,
The equations of goods and services demand and leisure demand become: Ci,c= λcCmini+ mi,c (1 − βc)P Ci (X i P CiCi,c− X i P CiλcCmini) (18) and T N Lc= T N Lminc+ βc (1 − βc)prlc (X i P CiCi,c− X i P CiλcCmini) (19)
From the equality T N Lc−T N Lminc = lsmaxc−LS, where lsmaxcis household’s
member c maximum time available to work, and from equation (19), we deduce the labour supply function of professional category c:
LSc = lsmaxc− βc (1 − βc)prlc (X i P CiCi,c− X i P CiλcCmini) (20)
In the three previous equations, we replace P
iP CiCi,c by its value given in the
optimisation problem.
Because we are taking into account two segments of the labour market, rural and urban, each one divided in ten under categories according to the different professional categories, we distinguish two equations of labour supply, one for the rural market applied to all rural professions and one for the urban market applied to all urban professions:
N AT Rc = lsmaxc− βc (1 − βc)prlc (X i P CiCi,c− λc X i P CiCmini,“hr”) (21) where X i P CiCi,c = (1 − ψ“hr”)(1 − ty“hr”adj)wrc X ru LRc,ru+ λc(1 − ψ“hr”)(1 − ty“hr”adj)[Y“hr”− X c (wrc X ru LRc,ru)](22)
in rural areas. For the urban areas, this equation is more complex because the representative urban household is composed of Moroccans having decided to stay in urban areas, but also of rural migrants towards the cities and Sub-Saharan immigrants. The labour income of these migrants is added to the integral income of the representative household and is used for consumption and saving ends. For lack of information on the consumption behaviour of these migrants and on the proportion that is employed, we must make an assumption about the fraction of the consumption budget and labour income that come from the participation of these individuals to the urban household. For that, we postulate that this fraction is equal to the proportion of internal migrants and African immigrants in the labour supply of each category.
N AT Uc = lsmax0c− βc0 (1 − β0 c)pluc (1 − ζ1c− ζ2c)( X i P CiCi,c0 − λ 0 c X i P CiCmini,“hu”)(23) where ζ1c= (1 − imc)M IGc N AT Uc+ (1 − imc)M IGc+ IM M IGc ζ2c= IM M IGc N AT Uc+ (1 − imc)M IGc+ IM M IGc X i
P CiCi,c0 = (1 − ψ“hu”)(1 − ty“hu”adj)(wuc
X up LUc,up+ wgc X pub LGc,pub) +
λ0c(1 − ψ“hu”)(1 − ty“hu”adj)[Y“hu”−
X c (wuc X up LUc,up+ wgc X pub LGc,pub)](24)
Now, rural household demand of good i is written: CTi,“hr”= X c λcCmini,“hr”+ X c mi,c (1 − βc)P Ci (X i P CiCi,c− λc X i P CiCmini,“hr”)(25)
and urban household demand (excluding the consumption of internal and African immigrants): CTi,“hu”= X c (1 − ζ1c− ζ2c)[λ0cCmini,“hu”+ m0i,c (1 − β0 c)P Ci (X i P CiCi,c0 − λ 0 c X i P CiCmini,“hu”)](26)
For lack of data on consumption and income elasticity of household members that are necessary to calibrate the budgetary share of each one of them, we suppose, as in Decaluw´e et al. (2005), that all household members distribute their supernumerary consumption budget in the same proportions, whatever their leisure budgetary share is. In other words, the fractions
mi,c (1 − βc) and m 0 i,c (1 − β0 c)
are the same between all members of rural and urban households, they are inde-pendent of the professional category to which the individual belongs. Thus, rural household demand of good i is written:
CTi,“hr”= Cmini,“hr”+
γi,“hr” P Ci (BC“hr”− X i P CiCmini,“hr”) (27)
and urban household demand (excluding the consumption of internal and African immigrants): CTi,“hu”= X c (1 − ζ1c− ζ2c)[λ0cCmini,“hu”+ γi,“hu” P Ci (X i P CiCi,c0 − λ 0 c X i P CiCmini,“hu”)]
where BC“hr” et BC“hu” are respectively the consumption budgets of rural and
urban households.
After the internal migrants and African immigrants enter the urban house-hold, they will participate to the maximisation problem of this household. Urban household consumption (including that of internal and African immigrants) will be written:
CTi,“hu” = Cmini,“hu”+
γi,“hu” P Ci (BC“hu”− X i P CiCmini,“hu”)
3.5 Labour market equilibrium
In Morocco, like in the majority of developing countries, unemployment is a characteristic phenomenon of urban labour market. Therefore, a realistic repre-sentation of this market must take unemployment into account in equilibrium, in contrast with the bulk of the CGE literature.
We rely here on a Blanchflower and Oswald (1995) type approach. Using in-ternational microeconomic data on more than twelve developed nations, Blanch-flower and Oswald identified a negative relation between the wage rate and the unemployment rate implying that, other things equal, if the unemployment rate of a particular region increases during a year, the corresponding workers will see their wage rate decreasing. Blanchflower and Oswald (1995) showed that the relation between wage and unemployment rates is stable among countries and through time with an elasticity around -0.1. We follow this approach (figure 3) in order to model urban unemployment by professional categories and make the assumption that this elasticity does not depend on the level of development of the country15:
ln wuc
P index = Dc− 0.1 ln uc (28)
15We perform a sensitivity analysis on alternative values of the wage elasticity. No substantial
changes are detected. For wage and unemployment rates, the variables of our interest, the sign of their variation is the same as before.
uc Labor quantity of category c Labor supply Labor demand Wage rate Exceeding supply rate wuc*
wuc*= theoretical equilibrium wage rate of category c
wuc = the wage of category c compatible with the
unemployment rate of this category according to the wage curve
wuc
Wage rate of category c
Figure 3: where
uc is the unemployment rate of category c compatible with the
corresp-onding wage rate wuc,
P index the GDP deflator, num´eraire,
Dc fixed effects related to the regions and to the industries in question,
as well as the whole characteristics of workers (age, sex, education...). On the other hand, rural labour markets are competitive. Equilibrium occurs when:
N AT Rc =
X
ru
LRc,ru (29)
with N AT Rc being the rural labour supply by professional category c and LRc,ru
the labour demand of category c by rural sector ru.
4
Simulation experiments
4.0.1 A 10% drop in migration costs
We first ask how an increase in migration will impact the various segments of the Moroccan labour market. To address this issue, we simulate the impact of a 10% fall in migration costs mc and imc. Such a shock can be interpreted as a translation of a larger facility for the migrant to become operational, for example because of a fall in migration costs, or a larger simplification and transparency of
administrative procedures, or the existence of migrants networks that facilitate integration in the host country.
The reduction in migration costs affects simultaneously rural and urban mi-gration, and internal migration. We are obviously interested in the level of labour remuneration and in the evolution of unemployment rates by professional cate-gories.
First of all, we expect that the fall in migration costs accelerates emigra-tion, reduces labour supply of the corresponding urban workers and their unem-ployment rate, given that other things are equal. On the other hand, internal migration towards cities, also facilitated by the drop in migration costs, should increase labour supply and, ceteris paribus, the corresponding unemployment rates. If these two migratory flows coexist, the final effect on unemployment rates by professional categories and consequently on urban wages is ambiguous.
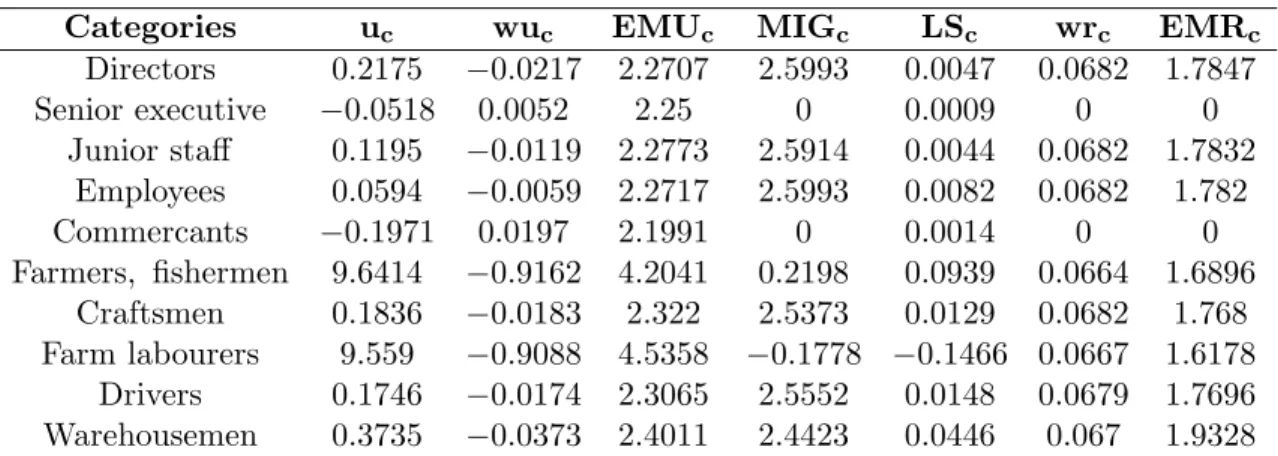
The results of Table 4 indicate that in the Moroccan case, the fall in labour supply due to urban emigration is more than compensated by the increase in internal migratory flows. Thus, unemployment rates of all categories, except for “senior executive...” and “commercants...”, increase and their wage decreases. Unemployment rates of “farmers...” and “workmen and farm labourers...” in-crease more (9.64% and 9.56% respectively), inducing the strongest fall in their wages. Those of “senior executive...” and “commercants...” diminish by 0.05% and 0.2% respectively, despite the rise of labour supply, leading to a higher wage. Indeed, labour supply LScof these two categories increases, despite the absence of
internal migration pressure on their markets, because urban emigration induces a rise of their wages. Consequently, their leisure opportunity cost goes up and the corresponding workers increase their labour supply N AT Uc. In spite of the rise
in labour supply, their unemployment rates decrease because the sectors using them intensively (such as mining industry, chemical industry, rubber industry, electricity and water, construction, trade and repair, financial and non financial services) expand and thus increase their labour demand.
Finally, only “senior executive...” and “commercants...” staying in urban areas seem to profit from the emigration of their counterparts, which agrees with the literature (Lucas, 1987; Lucas, 2005)16. Migrants, whatever they were employed or not before their departure, yield their place to workers initially not employed, inducing a fall of unemployment and an increase in wages. On the other hand, and contrary to what is predicted in the literature, the other urban labour cate-gories are losing17.
16Lucas (2005) showed that, in Bangladesh, India, Indonesia and Sri Lanka, workers migration
has not induced a loss of production or a rise of wages. He gave different explanations to this stylised fact such as the possibility that those who have migrated did not have a job before leaving. Therefore, their departure generated a fall of unemployment rate. On the other hand, in Pakistan, workers emigration towards the Gulf countries has exerted an upper pressure on wages. A rise of wages has also been noticed in Philippines. Lucas (1987) arrived to the same conclusion in Mozambique and Malawi after workers emigration towards South African mines.
In rural areas, we observe an increase in wages because rural emigration and migration towards the cities (facilitated by the fall in migration costs) reduce labour supply on each rural market. Only internal migration of “workmen and farm labourers...” decreases. This is by the drop in the expected urban wage (net of migration costs) of this category relatively to its rural wage. But international emigration of these workers is enough to reduce their labour supply on the corre-sponding rural market. When labour supply diminishes, the wage rate increases ceteris paribus, in order to reequilibrate the corresponding market. International migratory movements and internal movements towards Moroccan cities create a scarcity of labour on rural markets and push upward labour remunerations. On the contrary, two forces of opposed directions are expressed on urban markets: departure of workers towards foreign countries and internal migration from rural to urban areas. By consequence, wage evolution is ambiguous.
Rural household welfare, measured by the equivalent variation, increases by 30 million dirhams, that is to say 0.033% of his initial income, because workers staying in rural areas profit from the wage increase after the migration of their counterparts. On the other hand, urban household welfare decreases by 21 million dirhams, or 0.010% of his initial income, because urban wages of the majority of workers fall after the different types of migratory movements affecting urban labour markets.
Table 4- Shock 1: Percentage change in unemployment and wage rates, migratory flows and urban labour supply by professional categories
Categories uc wuc EMUc MIGc LSc wrc EMRc
Directors 0.2175 −0.0217 2.2707 2.5993 0.0047 0.0682 1.7847 Senior executive −0.0518 0.0052 2.25 0 0.0009 0 0 Junior staff 0.1195 −0.0119 2.2773 2.5914 0.0044 0.0682 1.7832 Employees 0.0594 −0.0059 2.2717 2.5993 0.0082 0.0682 1.782 Commercants −0.1971 0.0197 2.1991 0 0.0014 0 0 Farmers, fishermen 9.6414 −0.9162 4.2041 0.2198 0.0939 0.0664 1.6896 Craftsmen 0.1836 −0.0183 2.322 2.5373 0.0129 0.0682 1.768 Farm labourers 9.559 −0.9088 4.5358 −0.1778 −0.1466 0.0667 1.6178 Drivers 0.1746 −0.0174 2.3065 2.5552 0.0148 0.0679 1.7696 Warehousemen 0.3735 −0.0373 2.4011 2.4423 0.0446 0.067 1.9328
Table 4bis- Shock 1: Absolute change in wage rates (in Moroccan
it is perfectly true to think that these workers, who migrate massively to the cities, will change their professional category and will belong for example to the category “warehousemen and workers of small trades”. However, given that the pressure on the market of “warehousemen and workers of small trades” increases with the fall of migration costs, the reception of workers belonging to the category “workmen and farm labourers...” will do nothing but exacerbate the pressure on this market. Thus, our contradictory results with the literature on the impact of migration on unemployment are still verified.
Dirhams), unemployment rates, urban labour supply and migration flows (in millions of working hours)
Categories uc wuc EMUc MIGc LSc wrc EMRc
Directors 0.04786 −0.00022 0.15895 0.05199 0.10000 0.00068 0.01785 Senior executive −0.00881 0.00005 0.24750 0 0.00000 0 0 Junior staff 0.07289 −0.00012 0.72873 0.23323 0.30000 0.00068 0.05350 Employees 0.06651 −0.00006 1.61293 0.90975 1.10000 0.00068 0.19602 Commercants −0.06308 0.00020 0.81368 0 0.10000 0 0 Farmers, fishermen 0.28924 −0.00916 0.16817 1.12773 1.00000 0.00066 2.61886 Craftsmen 0.18548 −0.00018 3.25084 3.70445 4.20000 0.00068 0.77794 Farm labourers 1.91179 −0.00909 0.22679 −1.77751 −1.60000 0.00067 6.45484 Drivers 0.14844 −0.00017 0.50743 0.74102 0.70000 0.00068 0.14157 Warehousemen 0.44815 −0.00037 2.76130 11.62516 11.40000 0.00067 0.88910
4.0.2 A 10% rise in Sub-Saharan immigrant stock
We now ask what is the impact of the South-South migration on the Moroccan labour market. The difficulty for African countries to ameliorate the welfare of their populations and the multiplication of conflicts let think that migratory flows originated from Sub-Saharan Africa will not be over soon. For that, we simulate the impact of a 10% rise in the stock of Sub-Saharan clandestine immigrants. This surge of clandestine migrants deteriorates the situation of Moroccan urban labour market, and can exert a pressure on the other migratory movements, those from rural areas to the cities or to foreign countries, or urban emigration. One can thus expect an increase in urban emigration due to the rise of unemployment and the decrease of urban wage. Simultaneously this exit of urban workers re-duces, at its turn, the pressure exerted by immigration on urban labour market, and increases wages.
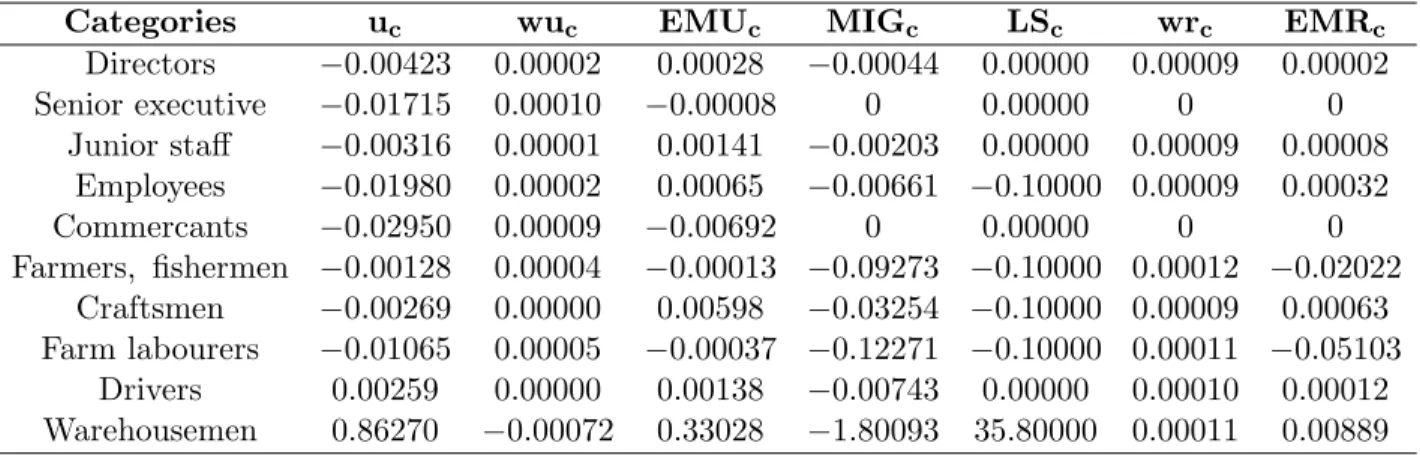
As one can note in Table 5, the increase in Sub-Saharan immigration creates a pressure on the urban labour market of “warehousemen and workers of small trades”. This category absorbs all the entries of Sub-Saharan immigrants, qual-ified or not. Given that other things are equal, the unemployment rate of these workers increases and induces ceteris paribus a fall in their urban wage. Moroc-can urban workers belonging to the same category are thus incited to leave the country whereas rural workers are incited to stay in rural areas. Let us notice however that in the Moroccan case, the fall of internal migration and the rise of urban emigration do not compensate the entry of African immigrants. Indeed, the unemployment rate of these workers increases by 0.72% and their wage decreases. This wage variation induces indirect effects on the other urban markets. In-deed, urban sectors increase their demand of “warehousemen and workers of small trades” (nationals and foreign in the same proportion) because their wage falls and the production of the sectors intensive in this category of workers expands
(especially mining, textile, clothing and chemical industries, construction ser-vices, hotels and restaurants, transport and telecommunication that are the most intensive in this type of labour). Given that capital is sector-specific, the increase in production should induce, on its turn, a rise in labour demand of the other categories, reduce their unemployment rate and increase their urban wage. This is the case of all categories except “farmers...”, “workmen and farm labourers...” and “drivers and assembly workers...”. Let us examine now the evolution of rural wages that affects the decision to migrate towards the cities and consequently the urban labour supply of the other categories.
Given that other things are equal, the nominal exchange rate depreciation (which increases the value of the foreign wage in local currency) should moti-vate rural workers of all categories to migrate. At constant rural population, this should induce a fall in Moroccan population wishing to stay in its country and consequently a reduction in labour supply on the different rural markets. Since these markets are competitive, rural wages will rise. This discourage rural workers of all categories to migrate to urban areas. In addition, rural workers belonging to the categories “farmers...” and “workmen and farm labourers...” revise downward their decision to emigrate because the wage increase compen-sates the stimulating effect of the exchange rate depreciation. Urban emigration, also motivated by the nominal exchange rate depreciation, and the decrease of internal migration towards the cities reduce labour supply of all professional cat-egories. Consequently, unemployment rates of all categories except “drivers and assembly workers” decrease and the corresponding wages increase. The unem-ployment rate of “drivers and assembly workers” increases because labour demand of these workers decreases more than their labour supply. The reason why labour demand of “drivers and assembly workers” falls is that the production of the sec-tors “machines and equipment manufacturing”, “radio and TV equipment” and “car industry” is negatively affected by the drop of total internal demand ad-dressed to them. Finally, let us note that urban emigration of “senior executive”, “commercants...”, “farmers...” and “workmen and farm labourers...” decreases because the nominal exchange rate depreciation does not compensate the rise of the average urban wage of these categories.
We have just seen how the entry of workers on a specific urban labour mar-ket stimulates the emigration of the corresponding workers. However, emigration does not succeed to reduce the pressure on this market. Moreover, this entry of workers induces indirectly a variation in migratory flows on the other markets through wage variation.
The positive evolution of urban wages of the majority of categories induces a rise in labour remuneration of the urban household, and ceteris paribus, a rise in his total income. Therefore, their welfare measured by the equivalent variation, increases by 6 million dirhams, or 0.003% of their initial income. In the same way, the rise of rural wages of all professional categories gives place to an increase in rural household income and to an improvement of his welfare. His equivalent
variation is of 3 million dirhams, or 0.004% of his initial income.
The growth impact, measured by the variation of real GNP, is positive (a rise of 0.002%) and it is mainly due to the expansion of sectoral production. Indeed, despite the positive evolution of wages, the firms in all sectors (except “machines and equipment manufacturing”, “radio and TV equipment” and “car industry”) benefit from the increase in consumers demand in order to rise their production. Moreover, since any increase in interior demand is satisfied by domestic and imported, total import volume increases. Exports must also increase in order to maintain current surplus fixed. The depreciation of the real exchange rate is therefore necessary.
Table 5- Shock 2: Percentage change in unemployment and wage rates, migratory flows and urban labour supply by professional categories
Categories uc wuc EMUc MIGc LSc wrc EMRc
Directors −0.0192 0.0019 0.004 −0.0219 −0.0003 0.0095 0.0023 Senior executive −0.1009 0.0101 −0.0007 0 −0.0002 0 0 Junior staff −0.0052 0.0005 0.0044 −0.0225 −0.0003 0.0095 0.0026 Employees −0.0177 0.0018 0.0009 −0.0189 −0.0009 0.0095 0.0029 Commercants −0.0922 0.0092 −0.0187 0 0.0000 0 0 Farmers, fishermen −0.0427 0.0043 −0.0033 −0.0181 −0.0082 0.0115 −0.013 Craftsmen −0.0027 0.0003 0.0043 −0.0223 −0.0003 0.0095 0.0014 Farm labourers −0.0533 0.0053 −0.0074 −0.0123 −0.0101 0.0112 −0.0128 Drivers 0.003 −0.0003 0.0063 −0.0256 −0.0004 0.0098 0.0015 Warehousemen 0.7189 −0.0716 0.2872 −0.3783 0.1402 0.0108 0.0193
Table 5bis- Shock 2: Absolute change in wage rates (in Moroccan Dirhams), unemployment rates, urban labour supply and migration flows (in
millions of working hours)
Categories uc wuc EMUc MIGc LSc wrc EMRc
Directors −0.00423 0.00002 0.00028 −0.00044 0.00000 0.00009 0.00002 Senior executive −0.01715 0.00010 −0.00008 0 0.00000 0 0 Junior staff −0.00316 0.00001 0.00141 −0.00203 0.00000 0.00009 0.00008 Employees −0.01980 0.00002 0.00065 −0.00661 −0.10000 0.00009 0.00032 Commercants −0.02950 0.00009 −0.00692 0 0.00000 0 0 Farmers, fishermen −0.00128 0.00004 −0.00013 −0.09273 −0.10000 0.00012 −0.02022 Craftsmen −0.00269 0.00000 0.00598 −0.03254 −0.10000 0.00009 0.00063 Farm labourers −0.01065 0.00005 −0.00037 −0.12271 −0.10000 0.00011 −0.05103 Drivers 0.00259 0.00000 0.00138 −0.00743 0.00000 0.00010 0.00012 Warehousemen 0.86270 −0.00072 0.33028 −1.80093 35.80000 0.00011 0.00889
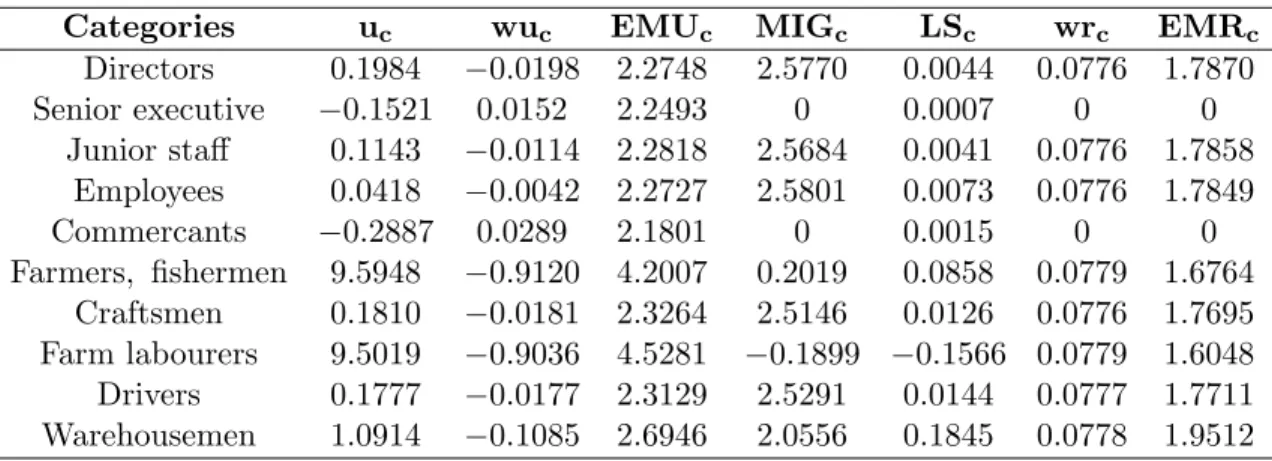
4.0.3 The simultaneous impact of a 10% drop in migration costs and a 10% rise in Sub-Saharan immigrant stock
We must now consider an experiment reflecting the actual shocks to the Moroc-can labour market, containing the two previous elements. Since the two previous shocks induce a greater pressure on the labour market of “warehousemen and workers of small trades”, their simultaneous effect consists, as expected, in a stronger rise of unemployment (of 1.09% against 0.37% and 0.72% respectively during the first and second shocks18). Since the unemployment rate of this cat-egory rises more, the corresponding urban wage falls more and urban sectors express a stronger labour demand of this category. Given that other things are equal, sectors intensive in this type of labour expand more (especially min-ing, textile, clothmin-ing, and chemical industries, construction services, hotels and restaurants, transports and telecommunication). These sectors will also require additional workers belonging to the other categories, and this could reduce the pressure exerted by internal migration on some labour markets. We notice that the rise of labour demand and urban emigration flows of “directors...”, “junior staff”, “employees” “farmers...” and “craftsmen...” reduce the pressure exerted by internal migration but do not succeed to reduce unemployment rates of the previous categories. They evolve positively but their variation is less than the one resulting from the first shock (i.e. the reduction in migration costs). On the other hand, the unemployment rate of “drivers...” increases under the simultane-ous impact of internal migration and the indirect effect of African immigration that induces a rise of their unemployment. Finally, the increase of labour de-mand and urban emigration of “senior executive...” and “commercants...” cause a stronger fall of their unemployment rates. All urban wage rates vary in the opposite sign of unemployment rates.
Rural wages increase more under the simultaneous effect of the drop in mi-gration costs and the increase in Sub-Saharan immimi-gration: indeed, the fall in migration costs stimulates rural emigration (direct effect) and Sub-Saharan im-migration induces indirectly an exchange rate depreciation favourable to rural emigration (indirect effect).
The positive evolution of rural household equivalent variation is accentuated with respect to the previous shocks due to the higher rise of rural wages acting on rural household income. Welfare is improved by 33 million dirhams (against 30 millions and 3 millions before), that is to say 0.037% of his initial income. For urban household, the deterioration of welfare at the first shock is reduced because his welfare improves during the second shock. It ends up decreasing by 15 million dirhams (instead of 21 millions during first shock), or 0.007% of his initial income.
18
Since the evolution of most variables in the last simulation is generally the sum of the variations of the same variable in the two previous shocks, one may think of a shock linearity. However, we can show that this is mainly due to the weak intensity of the selected shocks: a stronger fall of migration costs is sufficient to eliminate the apparent linearity.
Table 6- Shock 3: Percentage change in unemployment and wage rates, migratory flows and urban labour supply by professional categories
Categories uc wuc EMUc MIGc LSc wrc EMRc
Directors 0.1984 −0.0198 2.2748 2.5770 0.0044 0.0776 1.7870 Senior executive −0.1521 0.0152 2.2493 0 0.0007 0 0 Junior staff 0.1143 −0.0114 2.2818 2.5684 0.0041 0.0776 1.7858 Employees 0.0418 −0.0042 2.2727 2.5801 0.0073 0.0776 1.7849 Commercants −0.2887 0.0289 2.1801 0 0.0015 0 0 Farmers, fishermen 9.5948 −0.9120 4.2007 0.2019 0.0858 0.0779 1.6764 Craftsmen 0.1810 −0.0181 2.3264 2.5146 0.0126 0.0776 1.7695 Farm labourers 9.5019 −0.9036 4.5281 −0.1899 −0.1566 0.0779 1.6048 Drivers 0.1777 −0.0177 2.3129 2.5291 0.0144 0.0777 1.7711 Warehousemen 1.0914 −0.1085 2.6946 2.0556 0.1845 0.0778 1.9512
Table 6bis- Shock 3: Absolute change in wage rates (in Moroccan Dirhams), unemployment rates, urban labour supply and migration flows (in
millions of working hours)
Categories uc wuc EMUc MIGc LSc wrc EMRc
Directors 0.04364 −0.00020 0.15923 0.05154 0.10000 0.00078 0.01787 Senior executive −0.02586 0.00015 0.24742 0 0.00000 0 0 Junior staff 0.06975 −0.00011 0.73016 0.23116 0.30000 0.00078 0.05357 Employees 0.04680 −0.00004 1.61359 0.90302 0.90000 0.00078 0.19634 Commercants −0.09238 0.00029 0.80664 0 0.10000 0 0 Farmers, fishermen 0.28785 −0.00912 0.16803 1.03554 0.90000 0.00078 2.59840 Craftsmen 0.18280 −0.00018 3.25692 3.67128 4.10000 0.00078 0.77857 Farm labourers 1.90038 −0.00904 0.22641 −1.89935 −1.70000 0.00078 6.40330 Drivers 0.15100 −0.00018 0.50883 0.73345 0.70000 0.00078 0.14169 Warehousemen 1.30966 −0.00108 3.09877 9.78466 47.10000 0.00078 0.89755
5
Conclusion
In this paper, we are interested in a particular shutter of the relation between migration and economic development of the sending country. We paid attention to the relation between migration and unemployment by professional categories, which is little exploited in the literature. Moreover, all the proposed analysis do not treat, to our knowledge, more than one type of migratory flow (partic-ularly emigration from the country of origin). The originality of our work is to take simultaneously into account three types of migratory flows characterising a country having a long history with migration: Morocco. The following flows are considered: rural and urban emigration, internal migration towards the cities and Sub-Saharan immigration (towards Moroccan cities). Each one of these mi-gratory flows has different effects on urban labour market and does not affect