HAL Id: hal-01711984
https://hal.archives-ouvertes.fr/hal-01711984
Submitted on 23 Mar 2018HAL is a multi-disciplinary open access archive for the deposit and dissemination of sci-entific research documents, whether they are pub-lished or not. The documents may come from teaching and research institutions in France or abroad, or from public or private research centers.
L’archive ouverte pluridisciplinaire HAL, est destinée au dépôt et à la diffusion de documents scientifiques de niveau recherche, publiés ou non, émanant des établissements d’enseignement et de recherche français ou étrangers, des laboratoires publics ou privés.
Plasmonic Hot Printing in Gold Nanoprisms
Sviatlana Viarbitskaya, Aurelien Cuche, Alexandre Teulle, Jadab Sharma,
Christian Girard, Arnaud Arbouet, Erik Dujardin
To cite this version:
Sviatlana Viarbitskaya, Aurelien Cuche, Alexandre Teulle, Jadab Sharma, Christian Girard, et al.. Plasmonic Hot Printing in Gold Nanoprisms. ACS photonics, American Chemical Society„ 2015, 2 (6), pp.744-751. �10.1021/acsphotonics.5b00100�. �hal-01711984�
Plasmonic hot printing in gold nanoprisms
Sviatlana Viarbitskaya,*† Aurélien Cuche, Alexandre Teulle, Jadab Sharma,§ Christian Girard, Arnaud Arbouet* and Erik Dujardin*
CEMES CNRS UPR 8011 and Université de Toulouse, 29 rue Jeanne Marvig, BP 94347, 31055 Toulouse cedex 4, France.
Abstract
The raster-scanned irradiation of ultrathin sub-micrometer crystalline gold colloidal prisms with the tightly focused spot of a femtosecond, near-infrared laser triggers the deterministic deformation and partial melting of nanometer-sized areas of the nanoprisms. The morphological modification of the Au nanoprisms evidences extremely localized sources of heat, the in-plane distribution of which varies with the particle shape and laser polarization. We demonstrate for the first time the direct relationship between heat source density and surface plasmon local density of states (SP-LDOS), which describes quantitatively the rich modal structure of the surface plasmons sustained by the 2D metallic platelets, independently of the knowledge of the illumination configuration. Green Dyadic numerical simulations confirm that the optical excitation of the 2D SP modes results in the sub-wavelength hot imprinting of the SP modal pattern onto the metal surface.
Physical properties of solid state matter are classically related to the intrinsic concept of local density of states (LDOS) of elementary particles (electrons, photons) or excitations (phonons, plasmons). Yet, surfaces are known to markedly modify the LDOS, which provides a means to image it. For example, electron LDOS can be imaged by low temperature scanning tunneling microscope (STM) as it tails off into the vacuum in the vicinity of a metal–vacuum interface.1 Similarly, photon
STM was used to probe photon or electromagnetic LDOS (EM-LDOS) in the immediate proximity of dielectric and metallic nanostructures.2 EM-LDOS, a scalar quantity, gives the only quantitative
modal description of the continuous spectrum of eigenmodes in optical systems, independently of the excitation mode. For example, it appears as a constant factor in Planck’s law of blackbody radiation.3,
4 Recently, EM-LDOS supported by lithographically designed metallic structures was directly imaged
in the infrared range by thermal radiation STM.5 This seminal work evidenced that realistic surfaces
also sustain non-radiative (evanescent) eigenmodes that contribute to the energy storage, thereby affecting the thermal properties of metallic surfaces when the energy is subsequently released by the emission of infrared photons.6, 7 Interestingly, the interplay between optical and thermal properties in
metallic surfaces has been extensively revisited in the context of plasmonics,8 which raises the
fundamental question of the relationship between thermal properties and surface plasmon LDOS (SP-LDOS).2, 9, 10
Indeed, the strong potential for sub-wavelength confinement and intense enhancement of the electromagnetic field in plasmonic nanostructures has fostered the interest to understand, control and exploit the plasmon-assisted optical generation of heat at the nanometer-scale.11-13 The resonant
excitation of plasmon modes produces heat which has been imaged by photo-thermal microscopy techniques.14-16 The modification of the geometrical parameters allowed tuning both the energy and
anisotropy of the modes, for example in gold nanowires,17 rod dimers,15 particle assemblies,18, 19
could be produced extremely locally, therefore opening opportunities for practical applications that require controllable nanosources of heat operated remotely by light, such as, data recording,22, 23
optical manipulation,24 catalysis,25 cellular transfection,26 drug delivery,27 and therapeutic
hyperthermia.28
From a mechanistic viewpoint, the correlation between luminescence and thermal images has established that heat production was directly linked to electromagnetic hotspots in plasmonic systems based on the calculation of electromagnetic field maps.15, 21 It is noteworthy that such distribution of
local field results from the interaction of the plasmonic structures with the impinging field and is therefore dependent on the illumination configuration. While multiple mechanisms contributes to the SP-mediated generation of heat, high SP-induced current densities, in particular at resistive grain boundaries in polycrystalline samples, were considered as responsible for the main dissipative pathways in continuous structures.29 Upon increasing the injected laser power, the SP-mediated
thermal effects can even induce irreversible localized deformation: gold nanorods in suspension were turned into φ-shaped particles by pulsed laser-induced melting;30-33 microbumps,34, 35 nanojets35, 36 and
nanodroplets36 were observed in plain Au and Ni films and in lithographically defined chiral Au
patterns21, 37 under femtosecond laser irradiation. Therefore, in contrast to the pioneering work by
Greffet et al., in which the EM-LDOS is globally populated according to Bose-Einstein statistics by an external heating of the sample and probed locally with a near-field optical microscope,5-7 it appears
that a tightly focused, ultrashort laser pulse triggers phenomena that raise the metal temperature extremely locally over a wide tunable range from a few degrees up to complete fusion.
In this Letter, we show that ultrathin 2D Au crystals, subjected to a series of raster scans with a
pulsed laser power exceeding an energy density threshold of 10 mJ.cm-2, undergo surface
local melting by scanning electron (SEM) and atomic force microscopy (AFM) demonstrates that the fused footprint reveals the spatial distribution of the SP-LDOS with sub-wavelength resolution. We formally establish that the generation of heat is determined by the SP-LDOS pattern that derives from the colloidal morphology of the ultrathin Au prisms. Indeed, SP-LDOS is an intrinsic quantity that does not depend on the illumination conditions. Hence our results directly link the local heat production to designable parameters such as the colloidal shape, size and chemical composition. This report on plasmon-mediated hot printing not only provides a direct SP-LDOS imaging technique in complex 2D structures, but also opens a general way to confine heat generation at the nanoscale and even to arbitrarily select hot areas by using linearly polarized incident light that projects the SP-LDOS, hence the heat source distribution, along the polarization direction.
Micrometer large yet ultrathin (20 nm) gold prismatic platelets with well-defined triangular and truncated triangular morphologies and in-plane single crystalline structure are synthesized as previously reported.10 Once deposited onto a glass coverslip coated with 10 nm ITO, the sample is
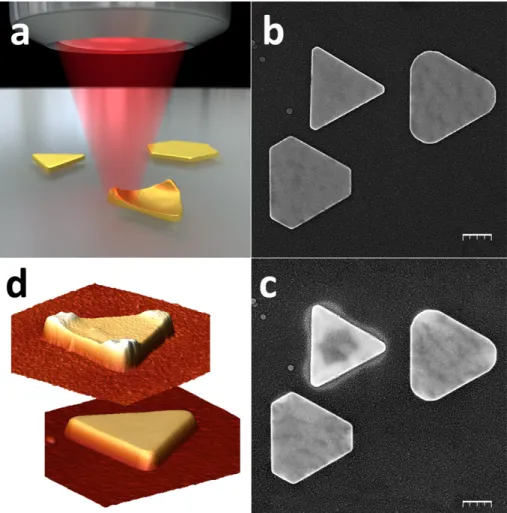
exposed to oxygen plasma to remove the polymer coating resulting from the synthesis (See Experimental Section for details). Individual prisms are then identified and their morphology is characterized by recording both SEM and AFM images. The plasmon-mediated hot printing is performed by raster scanning the chosen nanoprism in the focal spot (ca. 400 nm diameter) of a linearly polarized, pulsed near-infra-red laser (Fig. 1a). The pulses are 150 fs at a repetition rate of 80 MHz, the wavelength is selected as 800 nm. In order to induce a moderate morphological change of the nanoprisms, the laser power is kept in the 2-2.5 mW range, as measured at the back aperture of the microscope objective, which corresponds to a fluence of 10-13 mJ.cm-2 at the focal point. In these
conditions, the peak power density and mean value are of the order of 106 mW.µm-2 and 30 mW.µm-2
the morphological changes. By finely tuning the laser power to reach the onset of light-induced melting, we observe reproducible and polarization dependent surface deformations by AFM imaging.
Figures 1b-d show typical examples of nanoprisms before and after undergoing a series of scans in the laser beam focal spot averaging all directions of the incident linear polarization. The platelets of different shapes but very similar sizes initially present flat and smooth single crystalline [111] facets (Fig 1b, and Fig. 1d bottom). While laser irradiation with fluence in the range of 1.5-4.5 mJ.cm-2 were
shown to produce two-photon luminescence but no observable morphological alteration,10, 38 a five- to
tenfold increase of the fluence (10-13 mJ.cm-2) results in slight modifications located specifically at
the apexes and/or edges depending on the particle shape (Fig. 1c and Fig. 1d top). A further increase of the laser fluence beyond 15 mJ.cm-2 leads to severe damages (Fig. S2), which renders impossible
any further quantitative analysis (For details, see Section 2 in Supplementary Information).
Single linear polarization irradiations provided a deeper understanding of the corrugation emergence mechanism. Figure 2 presents SEM and AFM images of a series of triangular, truncated triangular and hexagonal nanoprisms that have been raster scanned with a laser beam polarized along a single polarization direction, either horizontal or vertical. SEM micrographs of two triangular platelets with sharp apexes are shown before (Figs 2a and 2e) and after (Figs 2b and 2f) irradiation with horizontally and vertically polarized laser beams respectively. Irradiation with horizontally polarized light induces a marked alteration of the two apexes along the horizontal edge of the prisms that is visible on Figure 2b. This alteration corresponds to effective mass transport as shown by the AFM image (Fig. 2c) and profile (Fig. 2d, black line). The modified apexes exhibit a 10 nm high protuberance, which represents about 50% of the initial prism thickness, while the center of the horizontal edge and the third apex retain their native thickness. This can be inferred from the height profiles shown in Figure 2d where the black line corresponds to the profile along the edge (Segment 1-2 in Fig. 2c) and the red line is the profile across the center of the prism (Segment 3-4 in Fig. 2c).
Symmetrically, the irradiation of another similar prism (Fig. 2e) with vertically polarized light affects principally the upper apex (Figs. 2f-2h). The AFM profile extracted from Figure 2g along the 3-4 segment (Fig. 2h, red line), which is parallel to the vertical polarization direction, confirms a 10 nm protrusion specifically localized at the apex. Moreover, the profile along the 1-2 line (Fig. 2h, black line) evidences that the two lateral edges are also modified, albeit to a lesser extent (3-5 nm high protrusions). For both nanoprisms, the center region remains essentially featureless and forms a central low-lying plateau. The spatial distribution of laser-induced protrusions was further examined in more complex colloidal geometries such as the truncated triangular and hexagonal nanoprisms shown in Figures 2i and 2m. Both particles, that are of similar lateral dimensions and identical thickness, underwent irradiation with vertical and horizontal incident polarization respectively. SEM and AFM data recorded after the irradiation (Figs. 2j,k and 2n,o) confirm the mass transfer phenomenon. Interestingly, for these morphologies, the protrusions are located along the particles edges rather than at the apexes. The spatial distribution of the protruding patterns respects the global symmetry of the supporting particle and polarization direction (Figs. 2k and 2o). The truncated triangular prisms shows two 3-5 nm high bumps along the longest lateral edges (Fig. 2l, red curve) and a single one located at each lower truncated edges(Fig. 2l, black curve). In the hexagonal prism, the protrusions are located at the middle of each edge, with a slightly stronger and more confined outcome on the two sides parallel to the incident horizontal polarization direction. Consistently, the height profile (black curve in Figure 2p) that follows the broken dashed line connecting points 1 to 7 on Figure 2o shows periodic oscillations with a slight excess of height for the 1-2 and 4-5 segments.
The morphological modifications of the 2D crystalline colloids are largely determined by the in-plane shape of the particle and the direction of the incident polarization. By combining the SEM and AFM data of the same prisms, it is also clear that the protrusions are typically 50-100 nm in diameter, irrespective of the particle shape, which is well below the nominal size of the incident laser beam (ca.
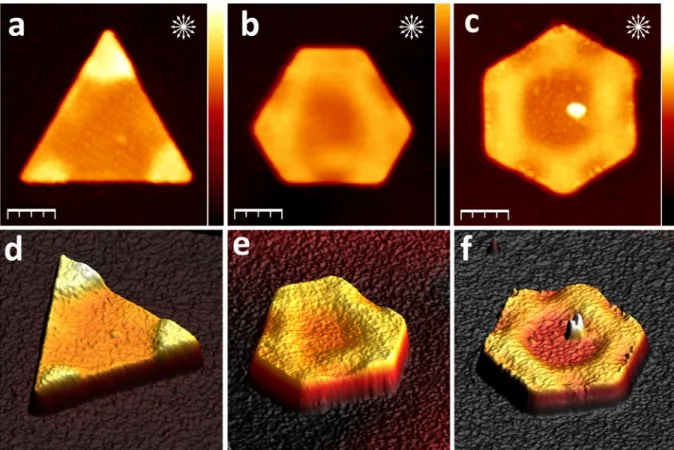
400 nm in diameter). In order to discriminate the influence of both parameters, prisms with all three shapes have undergone multiple irradiations for which the linear polarization was successively rotated by 10° steps so that pairs of orthogonal polarization would cover all directions. The resulting non-trivial surface patterns were analyzed by AFM as shown in Figure 3 and clearly possess similar symmetries as their corresponding supporting particles. The protruding areas are primarily located along symmetrical arrowhead patterns at the apexes of the sharp triangle (Figs. 3a,d) while they are found near the apexes of the truncated triangle and of the hexagon with elevated interconnecting regions (Figs. 3b,c,e,f). All three types of prisms show a seemingly unperturbed flat central area after irradiation.
Tapping mode AFM phase images of irradiated prisms present a uniform contrast, including in the areas of protrusion (Fig. S3). The uniform dissipation signal confirms the absence of remaining
organic adsorbate following the O2 plasma treatment that would be locally modified during
irradiation. Rather, it strongly suggests that the protuberances are made of gold and that the morphology modifications result from the melting in extremely localized regions of the prisms that vary with the incident polarization. Yet, the intriguing patterning cannot be accounted for by the sole action of laser-induced melting since each and every pixel in the raster-scanned area is exposed to the same laser irradiation.
The bulges and localized melting areas along the platelets apexes and edges in Figure 2 and 3 strikingly resemble the TPL patterns observed at much lower fluence (See also Section 1 in Supplemetary Information).10 In this earlier work, we have established that the TPL signal was
directly related to the squared projected distribution of SP-LDOS. In the following, we present a model that explicitly relates the heat source density to the surface plasmon local density of states, which represents the number of surface electromagnetic modes per unit energy at a given location. Accordingly, we demonstrate that the heat distribution induced by the laser in the gold prisms is
strictly proportional to the partial SP-LDOS in the plane of the prisms (See Supplementary Information for full derivation). When the incident Gaussian laser beam is located at the position R0
in the particle, the heat generated locally at R0, Q(R0, ω0) is related to the local electric field E(R0, r,
ω0) as follow:15
(
)
( )
(
)
2 " 0 0 0 0 , , , 8 m V Q ω ω ε ω ω π =∫
0 0 R E R r dr (1)in CGS units, where ω0 is the angular frequency of the incident light beam, εm" is the imaginary
part of the dielectric function of the metal. Moreover, for thin metallic platelets illuminated with a circularly polarized plane wave in normal incidence, we have demonstrated, in Reference 10, that
the intensity of the local electric field could be related to the product of the incident intensity and the in-plane component of the full SP-LDOS, ρ||(r):
(
)
2(
)
2(
)
0 0 0 , ,ω , ,ω ρ ,ω 0 0 0 E R r E R r r (2) Hence:(
)
3 "( )
(
) (
2)
0 0 0 0 0 0 3 , , , , 8 m V c Q ω π ε ω ω ρ ω ω =∫
0 0 R E R r r dr (3)where c is the light speed. When the incident light is linearly rather than circularly polarized, ρ||(r)
in Equation (3) is replaced by the partial SP-LDOS, its projection along the polarization direction. It therefore appears that the heat distribution can be finely modulated in the plane of the 2D Au prisms. For example, in the sequential illumination illustrated in Figure 3, the full in-plane SP-LDOS is probed through the accumulation of orthogonal projections onto the polarization direction.39 When the SP-LDOS of a sharp triangle similar to the one displayed in Figure 2 is
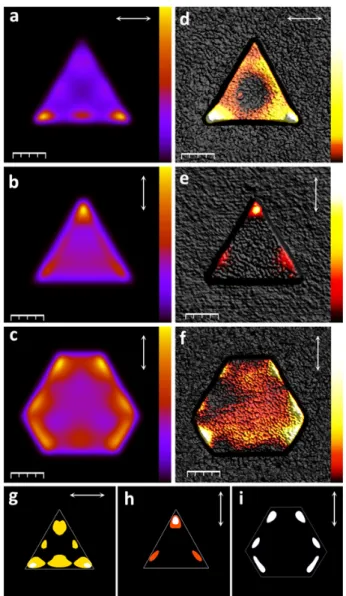
apexes along the horizontal edge, with weaker features along the edges (Fig. 4a). The projection along the vertical polarization results in a single dominant spot at the upper apex (Fig. 4b). The AFM topography images in Figures 4d and 4e clearly show that the areas of highest protuberances precisely match those of most intense SP-LDOS. Even the secondary features coincide satisfactorily. Similarly, Figure 4c confirms that the partial SP-LDOS along the vertical polarization associated with a truncated triangle isomorph to the one studied in Figure 2 closely matches the AFM topographical patterns shown in Figure 4f. This striking correspondence appears all the more clearly that the AFM height data is plotted with a highly contrasted height color scale, which is further emphasized by thresholding the SP-LDOS maps at ca. 50-60% and above 75%. In so doing, Figures 4a, 4b and 4c yield the corresponding Figures 4g, 4h and 4i, which further evidences that the mass transport observed by AFM is triggered by the plasmonic properties of the Au platelets but also suggests that the strongly localized melting results from a highly non-linear mechanism.
Pulsed laser induced modifications in ultrathin gold films involve extremely complex effects, including film deformation and metal melt hydrodynamics , which may differ when tuning the pulse width from nano- to femtoseconds.40-42 In particular, Au films melt extremely locally (ca.
100 nm) at reduced laser fluence when using shorter pulses, rather than undergoing disruptive ablation.35, 36, 43-46 For 100 fs laser irradiations at UV wavelength, typically 400 nm, the onset
fluence for melting is about 10-100 mJ.cm-2 depending on the thickness, purity and support of the
Au film.13, 42, 47-49 The energy absorbed by the colloidal platelets from the 10-13 mJ.cm-2 laser
beam used in this work is therefore significantly smaller than the energy required to directly melt the Au platelets, all the more so as the imaginary part of the dielectric function of gold is markedly
lower at a wavelength of 800 nm, used here, compared to the UV range.50 The sub-fusion
the 150 fs laser pulses generate extremely hot electrons with a typical peak electronic temperature of 6500 K (see details in Supplementary Information) that brings Au films in a non-linear regime where both the electron heat capacity and the electron-phonon coupling factor are significantly reinforced compared to their room temperature values.47, 48, 51 After the excitation pulse, a very
effective electron-phonon energy transfer prevails initially (with characteristic timescale of ~ 10 ps)49, 52 that eventually leads to a significant elevation of the lattice temperature. As a result, the
fusion threshold is locally overcome and induces Au melting in restricted areas. However, it has been shown that this initial energy transfer is followed by subsequent exchanges between electrons and phonons.45 During this mutual energy exchange, the maximum temperature of the hot electrons
decreases rapidly, which also leads to a rapid loss of electron-phonon coupling so that the final thermalization of the entire prism volume occurs close but below the melting temperature.49 In the
transient non-linear regime reached at electronic temperature exceeding about 5000 K, both the electronic heat capacity and the electron-phonon coupling factor depend directly on the electronic DOS.47, 48, 51 The SP-LDOS therefore provides supplementary states in which more hot electrons
can be generated by the collective excitation of surface plasmon modes. Remarkably, this extra energy input channel is spatially patterned since the SP-LDOS of the nanoprisms has a contrasted 2D spatial distribution. This conjunction of locally confined, non-linear melting processes under femtosecond excitation with in-plane patterning of the plasmon modal distribution is directly illustrated by the striking similarity between the patterns of high SP-LDOS and the AFM images in Figure 4, which strongly suggests that the melting onset is overcome only in areas where the SP-LDOS is significant. Here, we experimentally and formally demonstrate the direct link between the laser-induced hot printing in gold nanostructures and the SP-LDOS, which is an intrinsic property of the particle. Importantly, our results bring a deeper understanding to recent phenomenological association of laser-induced formation of protrusions with electromagnetic hotspots in plasmonic
structures.21, 37 Indeed, depending on the laser fluence, focal spot diameter and film extension,
protrusions with different morphologies and characteristic sizes such as micro-bump34, 45 and liquid
nanojet21, 43 have been reproducibly observed under femtosecond laser pulse irradiation. Their
formation mechanisms are still largely debated,21, 35, 49 but a consensual view is that the transient
melting and the associated relaxation of the initial compressive stress result in the local upward acceleration of the molten gold and the formation of the protrusion at the center of the laser spot. It should be pointed out that micro-bumps formed by the plastic deformation (buckling) have a typical diameter that exceeds 0.5 µm,35, 43, 44 which is much larger than the features observed in our
experiments. On the contrary, liquid metal droplets can be as small as a few tens of nanometers in diameter,21, 36, 43 in agreement with the observed patterns. Moreover, the high surface tension of
liquid gold would reinforce the formation of bulging spherical caps of liquid gold at the focal spot. The liquid gold is surrounded by an area of soften metal where mass transport occurs under the driving force of the surface tension of the liquid zone. After accumulation of successive raster scans, the net mass transport is from the areas where the SP-LDOS is minimal, as the melting threshold was never overcome, towards areas where the SP-LDOS is maximal. The origin of the matter brought into the protrusions is further answered by a more careful observation of the nanoprisms after irradiation. As an example, Figure 2n shows that the initially uniform SEM contrast reveals a 6-fold symmetrical pattern in a large central area of the hexagonal prism (See also Fig. S2c). This area corresponds to a large depression area seen in the AFM image(Fig. 2o) and cross section (Fig. 2p, red curve). In AFM, the depression area is smooth and does not exhibit a similar 6-fold symmetrical corrugation. In pristine prisms, the secondary electrons generated by the 20 kV incident beam emerge from a typical depth of 10 nm or less and so originate from the uppermost twin single crystal. Irrespective from the location in the prism, the secondary electrons travel through the same environment and create a uniform contrast. As the plasmon-induced
topographical pattern formation proceeds by mass transport towards the peripheral, 10-nm high protrusions, a central area of the upper single crystal is significantly thinned down (the prisms total thickness decreases from an initial 19-20 nm to 14 nm in the depleted area). When imaging the prism after laser irradiation, in the same SEM imaging conditions, the in-lens detected secondary electrons, also originate from the lowermost twin crystal, travel through the uppermost one and one possible explanation of the observed contrast is that the electrons experience the atom density moiré patterns caused by minute rotational and/or translational misalignment of the two twins. Alternatively, the secondary electrons may also emerge from the region between the prism and the underlying ITO and therefore carry interfacial information that would result in the contrast formation. In either case, the observations are consistent with the formation of the depleted area at the center of the prisms.
The moderate hot printing does not modify the 2D geometrical outline of the prisms, which essentially preserve their initial in-plane shape. Consequently, the in-plane SP-LDOS, ρ||, is not
modified during the laser irradiation, the effect of which can be cumulated by the successive addition of pulses (Fig. 3). This is confirmed by the TPL mapping that is related to ρ|| and which shows very
marginal alteration unless severe damage occurs (e.g. when fluence exceeds 15 mJ.cm-2). In contrast,
the plasmon-induced hot printing does modify the local thickness of the platelets, which should reflect on the z component of the SP-LDOS, ρz. Unlike TPL, other techniques such as electron energy
loss spectroscopy, which are essentially sensitive to ρz,53-55 would be able to probe this SP-LDOS
self-induced engineering.
In summary, plasmon-mediated, local melting under pulsed laser irradiation has recently emerged as a new imaging technique capable of directly resolve the plasmonic properties of complex planar metallic nanostructures and were so far associated with areas of high electric field or high current
resolution with spectral tunability unlike fluorescence polarization anisotropy or thermal radiation STM. Here, we have demonstrated for the first time both experimentally and theoretically the direct link between the local generation of heat in the metal under pulsed laser irradiation in plasmonic nanostructures and the SP-LDOS, which is an intrinsic property of the irradiated object, irrespective of the illumination conditions. When using 100-200 fs laser pulses, a deeply sub-wavelength resolution (~ λ/10) is achieved through a non-linear thermoplastic mechanism that needs further investigations. Thus, SP-induced hot printing can be conceived as a highly resolved SP-LDOS imaging method, the implementation of which is much more straightforward than fluorescence lifetime microscopy or EELS. Moreover, SP-LDOS controls a large number of properties in and near metallic structures such as luminescence, emission, electron-plasmon interaction, field confinement and enhancement, etc… Our direct and detailed imaging technique will be profitable for the design of new multifunctional or transductive modal plasmonic devices. Beyond mere SP-LDOS imaging, the engineering of the modal distribution of plasmon opens a general way to confine heat generation at the nanoscale. Indeed our earlier work have demonstrated that SP-LDOS can be modulated by shaping 2D crystalline colloids38 or by tuning the interparticle coupling.10, 56 In particular, the
ultrathin single crystalline prisms with lateral sizes comparable to the optical wavelength studied in this work exhibit a very well defined in-plane distribution of higher order modes associated with resonances in the technologically relevant near-IR region. The projection of the SP-LDOS by using linearly polarized light provides for a way to arbitrarily select the areas where heat is generated and hence to control the planar heat source distribution. Finally, in the studied systems, the in-plane partial SP-LDOS, ρ||, determines the regions where temperatures capable of inducing morphological
changes are reached but this perturbation mostly affect the out-of-plane partial SP-LDOS, ρz. Thus,
the plasmon-mediated hot printing in planar plasmonic structures could be advantageously exploited to fine-tune the SP-LDOS with a 100-nm spatial resolution. Such a general leverage of the
thermo-optical properties at the nanoscale can be of great practical interest in emerging fields like nanopatterning, nanochemistry, nanofluidics and nanomedicine.
Experimental section
Sample preparation. Gold nanoprisms with lateral sizes ranging between 500 and 1000 nm and 20 nm average thickness were prepared by a quantitative one-pot synthesis, the protocol of which is described elsewhere.10 The prisms are composed of two superimposed single crystals sharing a 2D
twin boundary along the {111} zone axis and that extend laterally over the entire prisms (data not shown). The colloids were drop-casted for 5 min before immersing the cross-marked substrate in a warm water bath for 2 min with gentle stirring. Organic adsorbates were removed just before performing experiments by three successive 5 min oxygen plasma cleaning separated by 5 min. cooling time in vacuum. Scanning electron microscopy (SEM) (Zeiss 1540XB) and atomic force microscopy (AFM) (Dimension 3000 Veeco-Bruker) were performed to identify individual prisms to be studied and measure their dimensions. SEM and AFM measurements were again performed after particle irradiation to visualize the modified morphology. AFM images were processed with the
WSxM software.57
Plasmon hot printing. Sample illumination was carried out using a TPL scanning microscopy setup.10
The schematic of the experiments is shown in the Figure 1a. The linearly polarized beam of a Ti:sapphire femtosecond laser (Coherent Chameleon Ultra II) delivering 150 fs near-infrared pulses tunable between 680 and 1080 nm at repetition rate of 80 MHz, was focused onto the sample in a home-built optical microscope objective. The linear polarization direction of the incident light was controlled by a λ/2 plate (Thorlabs AHWP05M-980). The laser beam was modulated with an optical chopper at 6 kHz to allow lock-in detection of the TPL signal. TPL was collected in an epi-collection geometry, separated from the excitation beam by a dichroic mirror (Semrock, FF665-Di02) and focused on a photomultiplier tube (PMT; Hamamatsu H7422P-40) operated in analogue mode. The TPL maps were obtained by raster scanning the sample with a high precision X–Y piezostage (Mad
Full irradiations consisted in a series of ten raster scans with air objective (Olympus × 100, NA 0.8) for particle reported in Figs. 2, 4, S2a-f and S2. Twenty raster-scans with an oil immersion objective (Olympus × 100, NA 1.4), approached from the substrate side, were performed on particles in Figs 1, 3 and S2h,g. The average scanning speed was 350 nm/s, the scan step in the X and Y directions was d = 55 nm, the pixel dwell time was 150 ms. The pixel size is defined by the scan step size and corresponds to d2. For each scan, the total average laser exposure time per pixel was 40 µs and the
average number of pulses delivered per pixel was 3 × 10⁶. The laser power range used with the oil
immersion objective was kept in the range to obtain a low fluence at the sample plane, ca.
1-4 mJ.cm-2. Both objectives induced comparable morphological changes and the choice of one or
another was dictated by the desired resolution of the corresponding TPL maps.
Corresponding Authors
* Correspondence should be addressed to E. Dujardin ([email protected]), A. Arbouet ([email protected]) or S. Viarbitskaya ([email protected])
Footnote
† Present address: Laboratoire Interdisciplinaire Carnot de Bourgogne CNRS-UMR 6303, Université de Bourgogne, 21078 Dijon, France.
§ Present address: Centre for Nano Science and Nano Technology, Panjab University, Chandigarh-160014, Chandigarh, India.
Author Contributions.
S. V., A. A., C. G and E.D. conceived the experiments. J. S. synthesized the Au prisms. S. V. prepared the samples and performed the structural characterization (SEM, AFM). S. V. and A. C.
performed the pulsed laser experiments. S. V. processed the data. C. G., A. T. and S. V. performed GDM calculations. S. V., E. D., A. A., C. G. and A. C. analyzed the results. All co-authors contributed to the writing of the article.
Acknowledgment
This work was supported by the European Research Council (ERC) (contract number ERC–2 2007-StG Nr 203872 COMOSYEL), Agence Nationale de la Recherche (ANR) (Grants ANR-09-BLAN-0049-Plastips and ANR-13-BS10-0007-PlaCoRe), the CPER “Gaston Dupouy” 2007-2013 and the computing center CALMIP in Toulouse.
Supporting Information.
Supporting Information contains: (1) TPL vs. hot printing and near-field intensity vs. SP-LDOS comparison; (2) High laser fluence effects; (3) AFM phase imaging of Au prisms after laser irradiation; (4) Theoretical derivation of the relationship between heat distribution and SP-LDOS in two-dimensional plasmonic systems and (5) the expression of the power dependence. (6) Calculation of the temperature increase using the Two Temperature Model (TTM). This material is available free of charge via the Internet at http://pubs.acs.org.
Figure captions
Figure 1. (a) Principle of the optical set-up used for plasmon hot printing. A high numerical aperture
objective is used to focus a linearly polarized 800-nm pulsed laser beam onto an ITO-coated glass coverslip bearing micrometer-sized, ultrathin Au prisms. The sample is raster scanned with an X-Y piezostage. The laser fluence is limited to 10-13 mJ.cm-2. The particle morphology is modified upon
the laser exposure. (b, c) SEM images of a group of triangular and truncated triangular Au prims platelets (b) before and (c) after laser irradiation. The incident linearly polarized light has been successively rotated every 5° between 0° and 180° with equal irradiation time for all polarization directions. Scale bars are 200 nm. (d) 3D rendering of AFM images of a triangular prism before (bottom) and after (top) laser irradiation. The prism edge is 700 nm long and the native thickness is 23 nm. The height perspective is identical for both top and bottom images.
Figure 2. (a, b) SEM images of a sharp triangular Au prism (a) before and (b) after pulsed laser
irradiation with horizontally polarized laser beam. (e, f) SEM images of another Au prism (e) before and (f) after irradiation with vertically polarized laser beam. The polarization direction is indicated by the double headed arrows. (c, g) AFM micrographs of the Au prisms after their respective irradiation.
(d, h) Height profiles along the segments 1-2 (black line) and 3-4 (red line) marked in the panels (c)
and (g). (i, m) SEM images of (i) a truncated triangular and (m) a hexagonal Au prisms before irradiation. (j, n) SEM images of the same Au prisms after irradiation. (k, o) AFM micrographs, corresponding to panels (j, n). (l, p) AFM height profiles along the segments 1-2 in (l) or 1-7 in (p) (black lines) and 3-4 in (l) or 8-9 in (p) (red lines) marked in panels (k) and (o). In (p), the black (red) dotted lines indicate the position of the white (red) markers in panel (o). Scale bars are 200 nm.
Figure 3. (a-c) AFM images of (a) triangular, (b)truncated triangular and (c) hexagonal Au prisms
polarization was rotated by 10 degrees, simulating the irradiation with a circularly polarized laser beam. The small but high central feature in (c) is an adventitious dirt particle that contaminated the sample after irradiation and did not result from the hot printing process. (d-f) 3D rendering of AFM
images in panels (a-c), respectively. Scale bars are 200 nm.
Figure 4. (a-c) Calculated partial SP-LDOS of (a,b) triangular and (c) truncated platelets projected
along the direction shown by the double-headed arrows. The excitation wavelength is 800 nm. Each SP-LDOS map is normalized to its maximal value. (d-f): AFM images of prisms after irradiations at 800 nm. Laser polarization directions are indicated by the white double-headed arrows. (g-i) Thresholded calculated partial SP-LDOS from the panels (a-c), respectively. In (g) yellow color depicts regions where the normalized partial SP-LDOS in panel (a) exceeds 50%. In (h), orange shows the areas in (b) where the normalized SP-LDOS exceeds 60%. In (g-i), white areas corresponds to a normalized SP-LDOS exceeding 75% in (a-c). Scale bars are 200nm.
Figure 1. (a) Principle of the optical set-up used for plasmon hot printing. A high numerical aperture
objective is used to focus a linearly polarized 800-nm pulsed laser beam onto an ITO-coated glass coverslip bearing micrometer-sized, ultrathin Au prisms. The sample is raster scanned with an X-Y piezostage. The laser fluence is limited to 10-13 mJ.cm-2. The particle morphology is modified upon
the laser exposure. (b, c) SEM images of a group of triangular and truncated triangular Au prims platelets (b) before and (c) after laser irradiation. The incident linearly polarized light has been successively rotated every 5° between 0° and 360° with equal irradiation time for all polarization directions. Scale bars are 200 nm. (d) 3D rendering of AFM images of a triangular prism before (bottom) and after (top) laser irradiation. The prism edge is 700 nm long and the native thickness is 23 nm. The height perspective is identical for both top and bottom images.
Figure 2. (a, b) SEM images of a sharp triangular Au prism (a) before and (b) after pulsed laser
irradiation with horizontally polarized laser beam. (e, f) SEM images of another Au prism (e) before and (f) after irradiation with vertically polarized laser beam. The polarization direction is indicated by the double headed arrows. (c, g) AFM micrographs of the Au prisms after their respective irradiation,
(d, h) Height profiles along the segments 1-2 (black line) and 3-4 (red line) marked in the panels (c)
and (g). (i, m) SEM images of (i) a truncated triangular and (m) a hexagonal Au prisms before irradiation. (j, n) SEM images of the same Au prisms after irradiation. (k, o) AFM micrographs, corresponding to panels (j,n). (l, p) AFM height profiles along the segments 1-2 or 1-7 (black lines)
and 3-4 or 8-9 (red lines) marked in panels (k) and (o). Note: In (p), the black (red) dotted lines indicate the position of the white (red) markers in panel (o). Scale bars are 200 nm.
Figure 3. (a-c) AFM images of (a) triangular, (b) truncated triangular and (c) hexagonal Au prisms after a series of irradiation with a tightly focused 800 nm laser beam. For each successive scan the polarization was rotated by 10 degrees, simulating the irradiation with a circularly polarized laser beam. The small but high central feature in (c) is an adventitious dirt particle that contaminated the sample after irradiation and did not result from the hot printing process.
(d-f) 3D rendering of AFM images in panels (a-c), respectively. Scale bars are 200 nm.
Figure 4. (a-c) Calculated partial SP-LDOS of (a,b) triangular and (c) truncated platelets projected
along the direction shown by the double-headed arrows. The excitation wavelength is 800 nm. Each SP-LDOS map is normalized to its maximal value. (d-f) AFM images of prisms after irradiations at 800 nm. Laser polarization directions are indicated by the white double-headed arrows. (g-i) Thresholded calculated partial SP-LDOS from the panels (a-c), respectively. In (g) yellow color depicts regions where the normalized partial SP-LDOS in panel (a) exceeds 50%. In (h), orange shows the areas in (b) where the normalized SP-LDOS exceeds 60%. In (g-i), white areas corresponds to a normalized SP-LDOS exceeding 75% in (a-c). Scale bars are 200nm.
References
1. Crommie, M. F.; Lutz, C. P.; Eigler, D. M. Confinement of electrons to quantum corrals on a
metal surface. Science 1993, 262, 218-220.
2. Chicanne, C.; David, T.; Quidant, R.; Weeber, J. C.; Lacroute, Y.; Bourillot, E.; Dereux, A.; des Francs, G. C.; Girard, C. Imaging the local density of states of optical corrals. Physical Review Letters 2002, 88, 097402.
3. Landau, L. D.; Lifshitz, E. M. Statistical Physics. 3rd ed.; Pergamon: London, 1960.
4. Loudon, R. The Quantum Theory of Light. 3rd ed.; Oxford University Press: London, 2000.
5. De Wilde, Y.; Formanek, F.; Carminati, R.; Gralak, B.; Lemoine, P.-A.; Joulain, K.; Mulet, J.-P.; Chen, Y.; Greffet, J.-J. Thermal radiation scanning tunnelling microscopy. Nature 2006, 444, 740-743.
6. Carminati, R.; Greffet, J. J. Near-field effects in spatial coherence of thermal sources. Physical Review Letters 1999, 82, 1660-1663.
7. Greffet, J. J.; Carminati, R.; Joulain, K.; Mulet, J. P.; Mainguy, S. P.; Chen, Y. Coherent
emission of light by thermal sources. Nature 2002, 416, 61-64.
8. Baffou, G.; Quidant, R. Thermo-plasmonics: using metallic nanostructures as nano-sources of
heat. Laser & Photonics Reviews 2012, 7, 171-187.
9. Girard, C.; Dujardin, E. Near-field optical properties of top-down and bottom-up
nanostructures. J Opt A - Pure Appl Op 2006, 8, S73-S86.
10. Viarbitskaya, S.; Teulle, A.; Marty, R.; Sharma, J.; Girard, C.; Arbouet, A.; Dujardin, E.
Tailoring and imaging the plasmonic local density of states in crystalline nanoprisms. Nature Materials 2013, 12, 426-432.
11. Link, S.; Burda, C.; Nikoobakht, B.; El-Sayed, M. A. Laser-induced shape changes of
colloidal gold nanorods using femtosecond and nanosecond laser pulses. Journal of Physical Chemistry B 2000, 104, 6152-6163.
12. Govorov, A. O.; Richardson, H. H. Generating heat with metal nanoparticles. Nano Today
2007, 2, 30-38.
13. Hashimoto, S.; Werner, D.; Uwada, T. Studies on the interaction of pulsed lasers with
plasmonic gold nanoparticles toward light manipulation, heat management, and nanofabrication. Journal of Photochemistry and Photobiology C-Photochemistry Reviews 2012, 13, 28-54.
14. Berciaud, S.; Cognet, L.; Blab, G. A.; Lounis, B. Photothermal heterodyne imaging of
individual nonfluorescent nanoclusters and nanocrystals. Physical Review Letters 2004, 93, 257402.
15. Baffou, G.; Girard, C.; Quidant, R. Mapping Heat Origin in Plasmonic Structures. Physical
Review Letters 2010, 104, 136805.
16. Desiatov, B.; Goykhman, I.; Levy, U. Direct Temperature Mapping of Nanoscale Plasmonic
Devices. Nano Letters 2014, 14, 648-652.
17. Baffou, G.; Kreuzer, M. P.; Kulzer, F.; Quidant, R. Temperature mapping near plasmonic
nanostructures using fluorescence polarization anisotropy. Optics Express 2009, 17, 3291-3298.
18. Sanchot, A.; Baffou, G.; Marty, R.; Arbouet, A.; Quidant, R.; Girard, C.; Dujardin, E.
Plasmonic Nanoparticle Networks for Light and Heat Concentration. ACS Nano 2012, 6, 3434-3440.
19. Govorov, A. O.; Zhang, W.; Skeini, T.; Richardson, H.; Lee, J.; Kotov, N. A. Gold
nanoparticle ensembles as heaters and actuators: melting and collective plasmon resonances. Nanoscale Research Letters 2006, 1, 84-90.
20. Coppens, Z. J.; Li, W.; Walker, D. G.; Valentine, J. G. Probing and Controlling Photothermal Heat Generation in Plasmonic Nanostructures. Nano Letters 2013, 13, 1023-1028.
21. Valev, V. K.; Denkova, D.; Zheng, X.; Kuznetsov, A. I.; Reinhardt, C.; Chichkov, B. N.;
Tsutsumanova, G.; Osley, E. J.; Petkov, V.; De Clercq, B.; Silhanek, A. V.; Jeyaram, Y.; Volskiy, V.; Warburton, P. A.; Vandenbosch, G. A. E.; Russev, S.; Aktsipetrov, O. A.; Ameloot, M.;
Moshchalkov, V. V.; Verbiest, T. Plasmon-Enhanced Sub-Wavelength Laser Ablation: Plasmonic Nanojets. Advanced Materials 2012, 24, OP29-OP35.
22. Zijlstra, P.; Chon, J. W. M.; Gu, M. Five-dimensional optical recording mediated by surface plasmons in gold nanorods. Nature 2009, 459, 410-413.
23. Stipe, B. C.; Strand, T. C.; Poon, C. C.; Balamane, H.; Boone, T. D.; Katine, J. A.; Li, J. L.; Rawat, V.; Nemoto, H.; Hirotsune, A.; Hellwig, O.; Ruiz, R.; Dobisz, E.; Kercher, D. S.; Robertson, N.; Albrecht, T. R.; Terris, B. D. Magnetic recording at 1.5 Pb m(-2) using an integrated plasmonic antenna. Nature Photonics 2010, 4, 484-488.
24. Cuche, A.; Canaguier-Durand, A.; Devaux, E.; Hutchison, J. A.; Genet, C.; Ebbesen, T. W.
Sorting Nanoparticles with Intertwined Plasmonic and Thermo-Hydrodynamical Forces. Nano Letters 2013, 13, 4230-4235.
25. Cao, L.; Barsic, D. N.; Guichard, A. R.; Brongersma, M. L. Plasmon-assisted local
temperature control to pattern individual semiconductor nanowires and carbon nanotubes. Nano Letters 2007, 7, 3523-3527.
26. Urban, A. S.; Pfeiffer, T.; Fedoruk, M.; Lutich, A. A.; Feldmann, J. Single-Step Injection of Gold Nanoparticles through Phospholipid Membranes. ACS Nano 2011, 5, 3585-3590.
27. Timko, B. P.; Dvir, T.; Kohane, D. S. Remotely Triggerable Drug Delivery Systems.
Advanced Materials 2010, 22, 4925-4943.
28. Huang, X.; Jain, P. K.; El-Sayed, I. H.; El-Sayed, M. A. Plasmonic photothermal therapy
(PPTT) using gold nanoparticles. Lasers in Medical Science 2008, 23, 217-228.
29. Baffou, G.; Quidant, R.; Girard, C. Heat generation in plasmonic nanostructures: Influence of morphology. Applied Physics Letters 2009, 94, 153109.
30. Link, S.; Burda, C.; Wang, Z. L.; El-Sayed, M. A. Electron dynamics in gold and gold-silver alloy nanoparticles: The influence of a nonequilibrium electron distribution and the size dependence of the electron-phonon relaxation. Journal of Chemical Physics 1999, 111, 1255-1264.
31. Link, S.; Burda, C.; Nikoobakht, B.; El-Sayed, M. A. Laser-Induced Shape Changes of
Colloidal Gold Nanorods Using Femtosecond and Nanosecond Laser Pulses. The Journal of Physical Chemistry B 2000, 104, 6152-6163.
32. Imura, K.; Okamoto, H. Ultrafast photoinduced changes of eigenfunctions of localized
plasmon modes in gold nanorods. Physical Review B 2008, 77, 041401.
33. Kuhlicke, A.; Schietinger, S.; Matyssek, C.; Busch, K.; Benson, O. In Situ Observation of
Plasmon Tuning in a Single Gold Nanoparticle during Controlled Melting. Nano Letters 2013, 13, 2041-2046.
34. Valev, V. K.; Libaers, W.; Zywietz, U.; Zheng, X.; Centini, M.; Pfullmann, N.; Herrmann, L. O.; Reinhardt, C.; Volskiy, V.; Silhanek, A. V.; Chichkov, B. N.; Sibilia, C.; Vandenbosch, G. A. E.; Moshchalkov, V. V.; Baumberg, J. J.; Verbiest, T. Nanostripe length dependence of plasmon-induced material deformations. Optics Letters 2013, 38, 2256-2258.
35. Kuznetsov, A. I.; Koch, J.; Chichkov, B. N. Nanostructuring of thin gold films by
femtosecond lasers. Applied Physics A 2009, 94, 221-230.
36. Kuznetsov, A. I.; Unger, C.; Koch, J.; Chichkov, B. N. Laser-induced jet formation and
droplet ejection from thin metal films. Applied Physics A 2012, 106, 479-487.
37. Valev, V. K.; Silhanek, A. V.; Jeyaram, Y.; Denkova, D.; De Clercq, B.; Petkov, V.; Zheng,
X.; Volskiy, V.; Gillijns, W.; Vandenbosch, G. A. E.; Aktsipetrov, O. A.; Ameloot, M.; Moshchalkov, V. V.; Verbiest, T. Hotspot Decorations Map Plasmonic Patterns with the Resolution of Scanning Probe Techniques. Physical Review Letters 2011, 106, 226803.
38. Viarbitskaya, S.; Teulle, A.; Cuche, A.; Sharma, J.; Girard, C.; Dujardin, E.; Arbouet, A.
39. Teulle, A.; Marty, R.; Viarbitskaya, S.; Arbouet, A.; Dujardin, E.; Girard, C.; Colas des Francs, G. Scanning optical microscopy modeling in nanoplasmonics. J. Opt. Soc. Am. B 2012, 29, 2431-2437.
40. Ho, J. R.; Grigoropoulos, C. P.; Humphrey, J. A. C. Computational study of heat transfer and gas dynamics in the pulsed laser evaporation of metals. Journal of Applied Physics 1995, 78, 4696-4709.
41. Habenicht, A.; Olapinski, M.; Burmeister, F.; Leiderer, P.; Boneberg, J. Jumping,
nanodroplets. Science 2005, 309, 2043-2045.
42. Plech, A.; Kotaidis, V.; Lorenc, M.; Boneberg, J. Femtosecond laser near-field ablation from gold nanoparticles. Nature Physics 2006, 2, 44-47.
43. Koch, J.; Korte, F.; Bauer, T.; Fallnich, C.; Ostendorf, A.; Chichkov, B. N. Nanotexturing of gold films by femtosecond laser-induced melt dynamics. Applied Physics a-Materials Science & Processing 2005, 81, 325-328.
44. Meshcheryakov, Y. P.; Bulgakova, N. M. Thermoelastic modeling of microbump and nanojet
formation on nanosize gold films under femtosecond laser irradiation. Applied Physics A 2006, 82, 363-368.
45. Ivanov, D. S.; Rethfeld, B.; O'Connor, G. M.; Glynn, T. J.; Volkov, A. N.; Zhigilei, L. V. The mechanism of nanobump formation in femtosecond pulse laser nanostructuring of thin metal films. Applied Physics A 2008, 92, 791-796.
46. Emel'yanov, V. I.; Zayarniy, D. A.; Ionin, A. A.; Kiseleva, I. V.; Kudryashov, S. I.; Makarov, S. V.; Nguyen, T. H. T.; Rudenko, A. A. Nanoscale hydrodynamic instability in a molten thin gold film induced by femtosecond laser ablation. JETP Letters 2014, 99, 518-522.
47. Lin, Z.; Zhigilei, L. V. Thermal excitation of d band electrons in Au: implications for laser-induced phase transformations - art. no. 62610U. In High-Power Laser Ablation VI, Pts 1 and 2, Phipps, C. R., Ed. 2006; Vol. 6261, pp U2610-U2610.
48. Zhang, Y.; Chen, J. K. Melting and resolidification of gold film irradiated by nano- to
femtosecond lasers. Applied Physics A 2007, 88, 289-297.
49. Chen, J.; Chen, W.-K.; Tang, J.; Rentzepis, P. M. Time-resolved structural dynamics of thin metal films heated with femtosecond optical pulses. P.N.A.S. 2011, 108, 18887-18892.
50. Palik, D. Handbook of Optical Constants of Solids. Academic Press: New York, 1985.
51. Lin, Z. B.; Zhigilei, L. V. Time-resolved diffraction profiles and atomic dynamics in short-pulse laser-induced structural transformations: Molecular dynamics study. Physical Review B 2006, 73, 184113.
52. Arbouet, A.; Voisin, C.; Christofilos, D.; Langot, P.; Del Fatti, N.; Vallee, F.; Lerme, J.; Celep, G.; Cottancin, E.; Gaudry, M.; Pellarin, M.; Broyer, M.; Maillard, M.; Pileni, M. P.; Treguer, M. Electron-phonon scattering in metal clusters. Physical Review Letters 2003, 90.
53. de Abajo, F. J. G.; Kociak, M. Probing the photonic local density of states with electron
energy loss spectroscopy. Physical Review Letters 2008, 100, 106804.
54. Gu, L.; Sigle, W.; Koch, C. T.; Oeguet, B.; van Aken, P. A.; Talebi, N.; Vogelgesang, R.; Mu, J.; Wen, X.; Mao, J. Resonant wedge-plasmon modes in single-crystalline gold nanoplatelets. Physical Review B 2011, 83, 195433.
55. Arbouet, A.; Mlayah, A.; Girard, C.; Colas des Francs, G. Electron energy losses and
cathodoluminescence from complex plasmonic nanostructures : spectra, maps and radiation patterns from a generalized field propagator. N. J. P. 2014, 16, 113012.
56. Jaegeler-Hoheisel, T.; Cordeiro, J.; Lecarme, O.; Cuche, A.; Girard, C.; Dujardin, E.; Peyrade, D.; Arbouet, A. Plasmonic Shaping in Gold Nanoparticle Three-Dimensional Assemblies. Journal of Physical Chemistry C 2013, 117, 23126-23132.
57. Horcas, I.; Fernandez, R.; Gomez-Rodriguez, J. M.; Colchero, J.; Gomez-Herrero, J.; Baro, A. M. WSXM: A software for scanning probe microscopy and a tool for nanotechnology. Review of Scientific Instruments 2007, 78, 013705.
Table of Contents entry and graphics
Local melting induced by femtosecond laser pulses on 2D plasmonic crystalline colloidal platelets hot prints the surface plasmon local density of states (SP-LDOS)