HAL Id: hal-00687211
https://hal.archives-ouvertes.fr/hal-00687211
Submitted on 12 Apr 2012
HAL is a multi-disciplinary open access
archive for the deposit and dissemination of sci-entific research documents, whether they are pub-lished or not. The documents may come from
L’archive ouverte pluridisciplinaire HAL, est destinée au dépôt et à la diffusion de documents scientifiques de niveau recherche, publiés ou non, émanant des établissements d’enseignement et de
Economic Analysis of Infrastructure Operations
Ioannis Konstantinou, Evangelos Floros
To cite this version:
Ioannis Konstantinou, Evangelos Floros. Economic Analysis of Infrastructure Operations. 2012. �hal-00687211�
Enhancing Grid Infrastructures with
Virtualization and Cloud Technologies
Economic Analysis of Infrastructure Operations
Deliverable D5.4 (V1.2) 19 March 2012
Abstract
Cloud computing claims to offer multiple advantages compared to “traditional” computing infrastructures. These include: energy efficiency, reduction of the over-all administration costs, and better utilization of hardware resources by co-hosting multiple service environments. This document reports on the experience gained during the provision of an IaaS cloud service in the context of the StratusLab project and provides quantitative economic analysis of the total cost of ownership of such infrastructure by calculating the infrastructure, maintenance and opera-tional costs. The analysis continues with the cost comparison of the private cloud against Amazon’s popular EC2 public cloud service by utilizing the collected Stra-tusLab usage traces for a period of one year. It is shown that with an average utilization of 70%, a small cluster of 20 machines could amortize its total cost in a period of 2-3 years while offering the same rates as commercial cloud providers if it were offered on a pay-as-you go basis.
StratusLab is co-funded by the European Community’s Seventh Framework Programme (Capacities) Grant Agreement INFSO-RI-261552.
The information contained in this document represents the views of the copyright holders as of the date such views are published.
THE INFORMATION CONTAINED IN THIS DOCUMENT IS PROVIDED BY THE COPYRIGHT HOLDERS “AS IS” AND ANY EXPRESS OR PLIED WARRANTIES, INCLUDING, BUT NOT LIMITED TO, THE IM-PLIED WARRANTIES OF MERCHANTABILITY AND FITNESS FOR A PARTICULAR PURPOSE ARE DISCLAIMED. IN NO EVENT SHALL THE MEMBERS OF THE STRATUSLAB COLLABORATION, INCLUD-ING THE COPYRIGHT HOLDERS, OR THE EUROPEAN COMMISSION BE LIABLE FOR ANY DIRECT, INDIRECT, INCIDENTAL, SPECIAL, EX-EMPLARY, OR CONSEQUENTIAL DAMAGES (INCLUDING, BUT NOT LIMITED TO, PROCUREMENT OF SUBSTITUTE GOODS OR SER-VICES; LOSS OF USE, DATA, OR PROFITS; OR BUSINESS INTER-RUPTION) HOWEVER CAUSED AND ON ANY THEORY OF LIABILITY, WHETHER IN CONTRACT, STRICT LIABILITY, OR TORT (INCLUDING NEGLIGENCE OR OTHERWISE) ARISING IN ANY WAY OUT OF THE USE OF THE INFORMATION CONTAINED IN THIS DOCUMENT, EVEN IF ADVISED OF THE POSSIBILITY OF SUCH DAMAGE.
Copyright c 2012, Members of the StratusLab collaboration: Centre Na-tional de la Recherche Scientifique, Universidad Complutense de Madrid, Greek Research and Technology Network S.A., SixSq S `arl, Telef ´onica In-vestigaci ´on y Desarrollo SA, and The Provost Fellows and Scholars of the College of the Holy and Undivided Trinity of Queen Elizabeth Near Dublin.
This work is licensed under a Creative Commons Attribution 3.0 Unported License
Contributors
Name Partner Sections Ioannis
Konstantinou
GRNET All
Evangelos Floros GRNET All
Document History
Version Date Comment
0.1 20 Oct 2011 Initial draft with TOC. 0.2 2 Dec 2011 Updated TOC.
0.3 27 Jan 2012 Contributions in 3.3, 4.3 and 4.4 1.0 03 Feb 2012 First complete version ready for review 1.1 21 Feb 2012 Initial review
Contents
List of Figures 5
List of Tables 6
1 Executive Summary 7
2 Introduction 9
3 Cloud Site Operations Expense Analysis 10
3.1 Overview . . . 10
3.2 Physical Infrastructure Description . . . 10
3.3 Hardware and Infrastructure costs . . . 11
3.4 Power Consumption . . . 12
3.5 Manpower Costs . . . 13
3.6 Cloud Infrastructure Total Cost of Ownership . . . 14
3.7 Cloud Service Provisioning Costs . . . 14
4 Use Case: Operation of a Virtualized Grid Site 16 4.1 Overview . . . 16
4.2 Grid Site Structure . . . 16
4.3 Grid Site Operational Cost . . . 17
4.4 Cost Analysis on Commercial Cloud . . . 17
4.5 Comparison with StratusLab Costs. . . 19
5 Summary and Conclusions 21
List of Figures
3.1 GRNET datacenter hosting StratusLab’s infrastructure . . . 11 3.2 StratusLab power consumption from 11/2010 to 11/2011 . . . . 13
4.1 Virtual CPU usage over time for StratusLab and Grid site . . . . 18 4.2 Virtual RAM usage over time for StratusLab and Grid site . . . . 19
List of Tables
3.1 Calculation of Electricity Costs . . . 13 3.2 Estimated Total Cost of Ownership for Cloud Site . . . 14
1 Executive Summary
Much has been written about the benefits of cloud computing including the abilities for optimal resource utilization, the reduction of operational costs through infras-tructure consolidation and the overall flexibility cloud computing users experience from the ability to manage infrastructure as a network accessible commodity. Nev-ertheless, the actual economic benefits organizations can achieve through cloud computing are still vague.
In the context of WP5 we tried to answer this question by performing an eco-nomic analysis of the private cloud infrastructure operated and managed by GR-NET for the StratusLab project. This private cloud has been deployed in GRGR-NET’s existing datacenter, using the StratusLab IaaS (Infrastructure as a Service) cloud distribution integrated by WP4. Taking into consideration estimates of the phys-ical infrastructure cost and the operational costs (network expenses, manpower required for administration, power consumption etc.) we calculated the Total Cost of Ownership (TCO) of the cloud service to be 251.8 ke. Based on the TCO we have calculated that the hourly cost for operating the site is 14.37 e/h and that the price we should charge a “typical” VM (a VM offering 1 CPU core, 3GB of main memory and 10GB of local disk space) in order for the service to amortize its cost in the period of two years, should be 0.0712 e/h.
Since the primary use case for operating this service has been the hosting of a virtualized grid computing sites we calculated the cost for hosting this grid site in GRNET’s private cloud and compared the result with the estimated cost of hosting it in Amazon’s EC2 commercial cloud solution. In particular we calculated that the cost for running the Grid site for a period of almost a year (mid January 2011 to mid November 2011) is 21,896 e whereas the same site would cost 21,888 e or 5,766 e if it was deployed on Amazon EC2 using the t1.small instance or the (limited capability) t1.micro instance respectively.
Our analysis suggests that even for a small scale private cloud installation, like the one in StratusLab, the economic benefits can be experienced in a relatively short period of 2-3 years. In our case, the theoretical cost for compute resources provisioning is almost the same compared to large-scale cloud providers like Ama-zon. These benefits can become even more evident in larger cloud installations in which case the economies of scale will significantly improve the hardware effi-ciency and consequently the investment on a private cloud will be amortized in a shorter period of time (less than a year).
Another important factor is the level of utilization. Indeed, the larger the uti-lization (more VMs running and thus less CPU cycles wasted) the higher the return of investment will become. Finally, the applications that the cloud service targets also play an important role in the overall economic assessment. Indeed compute intensive applications (as those in e-science or grid computing environments) can run in a more cost effective way if an organization has full control over the un-derlying virtualization infrastructure than using commercial clouds in which such resources are typically charged with higher hourly fees.
2 Introduction
Cloud computing is revolutionizing the way IT resources are managed and pro-visioned. What started as a business model in order to capitalize on the spare computing resources owned by a single company (Amazon), has taken the internet world by storm, becoming simultaneously one of the hottest topics and one of the most overloaded buzzwords in the IT business.
Much has been written about the benefits of cloud computing including the abilities for optimal resource utilization, the reduction of operational costs through infrastructure consolidation and the overall flexibility cloud computing users expe-rience from the ability to manage infrastructure as a network accessible commod-ity. Nevertheless, the actual economic benefits organizations can achieve through cloud computing are still vague. Organizations often face the question whether it is more beneficial to buy their own infrastructure instead of leasing resources from a cloud computing commercial providers. In other cases organizations consider the deployment and operation of private clouds in order to satisfy the computing requirements of various departments or even external parties (e.g. a e-government cloud offering resources to various public sector units). This report tries to answer this question by presenting an economic analysis of the private cloud infrastructure operated and managed in the context of the StratusLab project. This private cloud has been deployed by GRNET in the organization’s existing datacenter, using the StratusLab IaaS (Infrastructure as a Service) cloud distribution developed by the project.
One of the primary use cases for operating this service has been the hosting of virtualized grid computing sites. The paper analyses the cost for hosting this grid site in GRNET’s private cloud and compares the result with the estimated cost of hosting the same site in Amazon’s EC2 commercial cloud solution.
The rest of the report is structured as follows: Section 3 analyses the opera-tional costs of the private cloud by calculating the Total Cost of Ownership (TOC) for running the cloud service for two years. Section 4 calculates and compares the cost for running a grid site on the private cloud and on Amazon EC2. Finally, Section 5 summarizes and comments on the results of the above analysis.
3 Cloud Site Operations Expense Analysis
3.1 Overview
The StratusLab distribution is used by WP5 to deploy and provide a public refer-ence IaaS cloud service which is available to external users for testing and evalua-tion purposes. This secevalua-tion describes this infrastructure. We calculate the TCO for two years of operations and provide an estimated “break-even” cost for the provi-sion of a “typical” VM such that if this cloud was offered commercially to third parties, the investment in the private cloud would be amortized within the project’s lifetime.
3.2 Physical Infrastructure Description
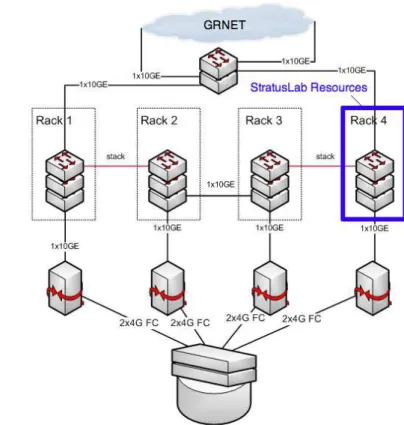
The reference cloud services operated by the project are hosted in GRNET’s dat-acenter in Athens, Greece. This datdat-acenter was completed in 2010, a few months before the start of the project, with the purpose to support a wide range of comput-ing resources for the organization. The overall setup of the datacenter is depicted in Figure 3.1. It comprises 4 racks, each hosting 32 compute servers and the required management servers. From these resources, a subset of roughly one quarter was allocated to satisfy the infrastructure requirements of StratusLab. This includes a complete rack (as depicted in the figure) and a few TBytes from the storage server. The reference cloud service which is the IaaS public cloud that the project provides is hosted in a subset of these servers. The size of the service has grown during the duration of the project in order to satisfy the increasing requirements from the ser-vice.
The reference service currently comprises 18 hosting nodes (where the VMs are actually instantiated) and 1 frontend node (where OpenNebula is running and all the management of VMs lifecycle takes place). Each physical node is equipped with Dual Quad-Core E5520 Intel Xeon with Hyperthreading CPUs (for a totalR of 272 cores) running at 2.27GHz, 48GB of RAM and 2 SAS disks operating in RAID 1 (for temporarily storing virtual machine images). Each server is equipped with an IPMI interface (Intelligent Platform Management Interface) [12], moni-toring and smoni-toring the machine’s daily average power usage consumption over one year. The storage of the infrastructure is served by an EMC Cellera NS-480 storage server which provides a total of 280TB.
Figure 3.1: GRNET datacenter hosting StratusLab’s infrastructure
The network infrastructure consists of 3×10 GbE (Gigabit Ethernet) switches. Each of the physical hosts has 3 GbE interfaces plus a management interface for access through IPMI. The relevant traffic (host/VM/IPMI management) is isolated using separate VLANs. The connectivity between the server rack and the storage server is provided by a fiber channel bridge which connects the 2×4 Gb FC stor-age link with the 10 Gb server link. The datacenter is connected through 2×10 GbE links with the GRNET network backbone. GRNET is the Greek NRN (Na-tional Research Network) offering data connections up to 10 GbE with the GEANT network.
3.3 Hardware and Infrastructure costs
The infrastructure allocated for the purposes of the project was not paid from the project budget but rather was provided as unfunded contribution from GRNET. Nevertheless, in order to provide a complete evaluation of the operational costs it is important to estimate the infrastructure cost. This cost covers a 7-year and 5-year guarantee for the datacenter and the servers, respectively. This means that all the necessary service and maintenance that took place during this period were offered free of charge. (Indeed there have been quite a few failed hard disks, cooling funs and memory modules that required replacement).
We consider a 8 ke cost per server, in which we include the network, storage and datacenter infrastructure cost, giving a total infrastructure cost of 24×8 ke = 192 ke. Since this equipment will be re-allocated to different services once the project completes, it is fair to apply these charges only for the project’s duration. By assuming a 5-year depreciation period (based on the server guarantee) and that the depreciation follows a non-linear reduction rate, we estimate that at the end of the second year the equipment will lose at least 60% of its initial value. Thus we presume that the total infrastructure cost is 192 ke× 60%=115.2 ke.
One additional operational cost is the expense for the network connectivity. The 2×10GbE lines have a flat 15-year leasing cost based on the distance from the backbone network provider, which in our case is the Hellenic Telecommunications Company (OTE). On top of this is a yearly maintenance cost calculated as 20% of the lease cost. For our datacenter, the overall cost for the network has been esti-mated to be 30 ke. Although the network is shared with the rest of the datacenter’s hosted services, the network cost would be the same even if StratusLab were the only service. This holds since the cost is affected only by the lease time and not the bandwidth consumption. Therefore we keep this flat yearly rate for the rest of the report. Notice that for the network expenses we have omitted the annual fees paid to GE ´ANT by GRNET for accessing the network. Although this is related to an important expense of a cloud infrastructure, namely the inbound/outbound traffic generated by the VMs, the overall funding scheme of the network services makes this expense negligible for our cloud service.
3.4 Power Consumption
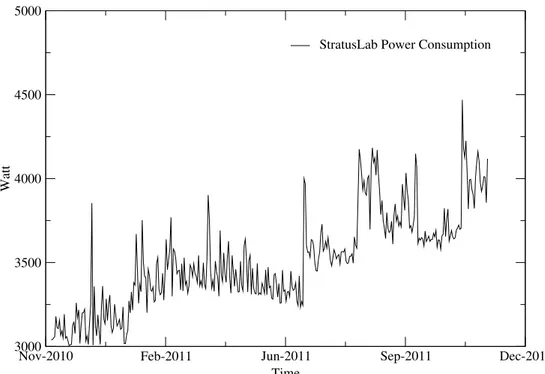
In this section, we present our calculations of the power consumption cost of run-ning a StratusLab private cloud on our infrastructure. Our monitoring period is between 4 November 2010 and 4 November 2011 (exactly one year). In Fig-ure 3.2 we present our findings. The power is measFig-ured in Watts. The increase in consumption in June 2011 is due to an increase of allocated resources for the StratusLab grid site.
In order to calculate the total electricity cost for this period, we take into ac-count that the datacenter’s PUE (Power Usage Effectiveness) [4] is around 1.8, a typical value according to Greenberg et al. [9].
In Table 3.1 we present the calculations to extract the total power consump-tion cost of the StratusLab cloud. According to the Public Power Corporaconsump-tion of Greece [13], there are two types of charges: a charge for the power cost, which is a monthly rate based on the average measured consumption (different in summer months and in winter months) and a charge for the energy cost, which is an hourly rate according to the amount of kWh used. The exact costs for 2011 were taken from the company’s on-line price list [11]. Assuming a PUE of 1.8, we calculate the total cost. The first column of Table 3.1 presents the cost type, the second col-umn presents the measured unit used for charging, and the third colcol-umn presents the unit cost measured in euros. In the forth column the unit amounts are presented:
Nov-2010 Feb-2011 Jun-2011 Sep-2011 Dec-2011 Time 3000 3500 4000 4500 5000 Watt
StratusLab Power Consumption
Figure 3.2: StratusLab power consumption from 11/2010 to 11/2011
Table 3.1: Calculation of Electricity Costs
Power Costs (summer) 6.00 e/kW/mo. × 6 mo. × 8 kW = 289e Power Costs (winter) 2.65 e/kW/mo. × 6 mo. × 8 kW = 128e Energy Costs 0.06 e/kWh ×55,321 kWh = 3,319e
Total Cost 3,738e
in the first two lines, we have a monthly power average of 8kW multiplied by six months in the summer and in the winter case respectively. The third line presents the total amount of kWh used for the StratusLab’s operations. Each line is mul-tiplied by the respective cost in the last column, and by aggregating each cost we have a total energy cost of 3,738 e.
3.5 Manpower Costs
A relatively large team of people are involved with the datacenter administration and support. This team is part of GRNET’s Network Operations Center (NOC) which has included the datacenter support activities as part of their daily tasks. As with the datacenter itself, the manpower provided by NOC was offered as un-funded contributions to the project thus there is no direct cost related to this. Nev-ertheless a fair estimate is that the datacenter administration requires 1 FTE (Full Time Equivalent). By assuming an average salary of 40 ke/year and a 25% of the administrator’s time dedicated to StratusLab, the total cost for two years is
Table 3.2: Estimated Total Cost of Ownership for Cloud Site
Hardware and hosting infra. (incl. 5yr service) 115.2 ke 45.8% Network line leases 30.0 ke 11.9% Power Consumption 6.6 ke 2.6% Datacenter administration 20.0 ke 7.9% Cloud site administration 80.0 ke 31.8% Total Cost of Ownership 251.8ke 100.0% 2 × 40 × 25% = 20 ke total administration costs.
In the project’s context, two people are responsible for the site’s administration and managing tasks like software upgrades, infrastructure maintenance, user man-agement, user support for operational issues, etc. The budgeted effort for this task has been estimated to be 1FTE (80 ke according to GRNET’s rates) for two years.
3.6 Cloud Infrastructure Total Cost of Ownership
Based on the above calculations we can make an estimate of the Total Cost of Ownership (TCO) for the Cloud services operated by GRNET in the context of StratusLab. The cost breakdown for the cloud infrastructure is depicted in Ta-ble 3.2, giving an estimated TCO of 251.8 ke.
The above TCO value covers the cost of procurement, operation and provision of a typical small to medium IaaS cloud service for a total period of two years. It should be noted that the above infrastructure includes additional computing re-sources required for the provision of the service, as well as the rere-sources provided through the service (≈60%). These include backup nodes for temporary VM de-ployments during service upgrades, pre-production testing nodes that are used to deploy and test the cloud middleware before upgrading the production services and a couple of additional services like DHCP and DNS.
Our calculations do not include license fees for the cloud software or for soft-ware support. The rationale for this is that StratusLab distribution is an open source software thus any potential cloud provider can download it, deploy it and extend it with no license costs. In a realistic production environment it is expected that some expenses should be forecast for support and maintenance. In our case this support cost is replaced by the cost required for the additional hardware and administration effort used for testing and certifying the cloud middleware before deploying it in the production service.
3.7 Cloud Service Provisioning Costs
An interesting question that arises from the above calculation is how much we should charge for the provision of cloud services to third parties? GRNET is a non-profit organization, thus it is not allowed to make revenue from the provisioning of its services. Therefore, in a scenario where this service is self-funded, the goal would be to break even financially for the provision of the cloud services after two
years. Based on the TCO we can calculate the hourly cost for hosting the service. For a period of two years this would be:
251.8 ke/(365 days · 2 yr)/24h ≈ 14.37 e/h (3.1)
As mentioned the cloud service offers 288 CPU cores, 864GB of total main memory and 3TBs of centralized storage. A “typical” VM instance in this case would consume 1 CPU core 3GB of main memory and 10GB local storage. This is actually very close to the average hardware profile of the VMs instantiated in our service during these months. Assuming that the service utilization is 70% (corre-sponding to 202 cores used at any moment on average, consistent with the Stratus-Lab usage) in order to break even during the two years of service provisioning the estimated charge per hour for the “typical” VM would be:
14.37 e/202 cores = 0.0712 e/core (3.2)
It is clear that if the service was offered on a pay-as-you go basis, after two years of operation the initial cost would be completely amortized and it would become profitable.
Obviously this number takes into account only the provisioning of compute ser-vices and not cloud storage serser-vices. Also it assumes unlimited usage of network capacity which for some providers might be a considerable cost.
4 Use Case: Operation of a Virtualized Grid
Site
4.1 Overview
In this section we provide a typical use case scenario pursued by StratusLab: the provision of virtualized grid computing sites on top of cloud infrastructures. Fur-thermore, we evaluate the cost for hosting this service in the StratusLab reference cloud and compare it with the cost if the same site was deployed in Amazon EC2.
4.2 Grid Site Structure
StratusLab operates a virtualized grid computing site running on top of the refer-ence cloud service. The grid site is part of the EGI [7] grid infrastructure and offi-cially running under the control of the Greek NGI being part of the Greek national grid infrastructure. The site provides the core grid services expected of a resource center [10]: a Computing Element (CE) together with a number of Worker Nodes (WN) that offer job execution capabilities, a Storage Element (SE) that provides a large storage space (2TB) for Virtual Organization (VO) data and an APEL ser-vice [5] that collects and publishes accounting data to the relevant centralized EGI services. The site’s computing power is provided by 16 virtualized WNs each with 2 CPU cores and a total of 4GB of main memory. The quality metrics of the site (availability and reliability) are monitored on monthly basis satisfying the relevant Operational Level Agreement (≥75% for both metrics) defined by EGI [6].
Since July 2011 the site offers support for 18 international VOs and is used daily for job submission and data storage. These include some of the most active and compute intensive VOs from the high energy physics (ALICE and ATLAS), biomedical sciences (Biomed), computational chemistry (CompChem) and Earth science (ESR) communities. During the period that this economic analysis was carried the site ran 31,781 jobs requiring 11,655 wall clock hours to complete. The Normalized CPU time consumed by the jobs was 28,321h.
The site is completely virtualized with all services running as VMs on the Stra-tusLab reference cloud service. The project has prepared and maintains a set of VM appliances which provide the core grid services necessary for deploying a ba-sic grid resource center. These appliances are publicly available from the StatusLab Marketplace.
4.3 Grid Site Operational Cost
The site is operated by two administrators. Their tasks include the preparation of the VM appliances that are used to deploy the virtualized site, the configuration of the site, the installation of periodic software updates, and the response to various security advisories. The preparation and maintenance of the grid VM appliances takes a significant amount of time since these appliances need to be kept up-to-date with the frequent releases of EMI grid software [8]. Since StratusLab is the first project that has focused on Grid-Cloud integration it has taken the responsi-bility to develop and maintain these appliances. Other teams can take advantage of these appliances and therefore reduce the time to deploy grid sites and the effort required to keep them up to date. Even with this additional task the total effort re-quired for the administration of the site is rather limited since all the infrastructure maintenance (hardware service and upgrades, software backups etc) are provided by the cloud service. Based on the expenses related to the grid site administration for StratusLab, it is estimated that the total effort required for grid site administra-tion is 0.3 FTEs (30% of a fulltime engineer) for site maintenance. Based on this calculation and GRNET salaries, the total cost for the grid site operation is 24 ke.
4.4 Cost Analysis on Commercial Cloud
We calculate the estimated cost for deploying the StratusLab infrastructure in a public cloud. For this case, we consider the widely used Amazon EC2 cloud [3]. In order to make this estimate, we will apply the following methodology:
1. We extract the computing, storage and memory consumption statistics from the StratusLab cloud’s logfiles.
2. According to the extracted consumption statistics, we calculate how much it would cost to utilize these resources in the Amazon.
We consider the same time frame, namely for a year starting from 4 November 2010.
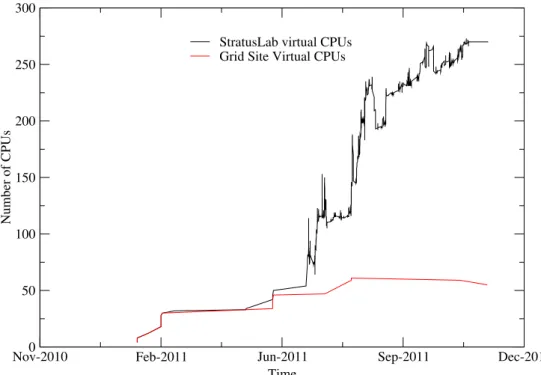
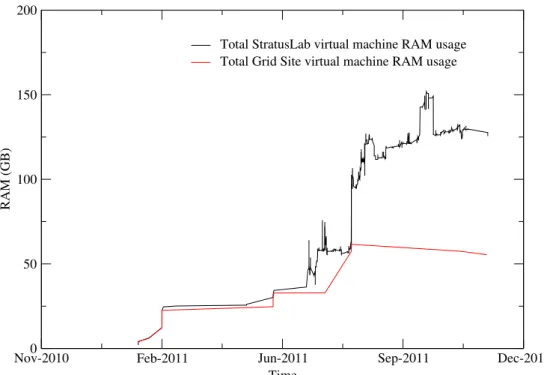
Figures 4.1 and 4.2 present the CPU and RAM allocation of the total num-ber of virtual machines running in the StratusLab infrastructure from information extracted from the cloud’s logfiles. Black lines represent the total cloud’s usage, whereas red lines represent only the resources reserved by the Grid site. We notice that both CPU number and RAM follow a similar pattern, with a sudden increase in June 2011. Recall that the same increase was observed in the cluster’s power consumption graph in Figure 3.2: when more virtual resources were acquired and used, the power consumption increased accordingly.
In order to estimate the cost of running StratusLab on the Amazon Cloud, we have to “translate” the used resources into Amazon’s resource types. Unfortu-nately, there is not an one-to-one match of StratusLab’s virtual machine types with Amazon’s instance types. The Amazon instance types that are most similar to the
Nov-2010 Feb-2011 Jun-2011 Sep-2011 Dec-2011 Time 0 50 100 150 200 250 300 Number of CPUs
StratusLab virtual CPUs Grid Site Virtual CPUs
Figure 4.1: Virtual CPU usage over time for StratusLab and Grid site
StratusLab VMs are the t1.small and the t1.micro instances [1]. By carefully ob-serving the graphs of Figures 4.1 and 4.2 we notice that there is a quite constant ratio of RAM to number of CPUs, approximately 600MB. This means that on av-erage each virtual CPU in the StratusLab cloud gets about 600MB of RAM. This profile is close to the t1.micro instance (1 CPU and 613MB of RAM). Neverthe-less, the t1.micro instance has a low I/O performance and is suited for applications with low throughput requirements, something that does not hold in the StratusLab case. For this reason, in our analysis we will also consider t1.small instances (1 CPU and 1.7GB of RAM) even if its memory is larger then the one assigned to the grid VMs. The rate for using one linux t1.micro machine for one hour in Amazon’s datacenter in Dublin is $0.025, or around 0.019 e. The corresponding rate for the t1.small instance is $0.095 or 0.07 e1.
Apart from charges regarding the machine usage per time, Amazon also charges for the total data transferred in and out of the Amazon cloud. We consider this not to be significant, since Grid site jobs are more compute than data intensive. What is more, Amazon also charges for disk I/O when persistent EBS storage volumes are used. We do not consider this cost as we are assuming Amazon VMs with only local, volatile non-EBS volumes.
Nov-2010 Feb-2011 Jun-2011 Sep-2011 Dec-2011 Time 0 50 100 150 200 RAM (GB)
Total StratusLab virtual machine RAM usage Total Grid Site virtual machine RAM usage
Figure 4.2: Virtual RAM usage over time for StratusLab and Grid site
4.5 Comparison with StratusLab Costs
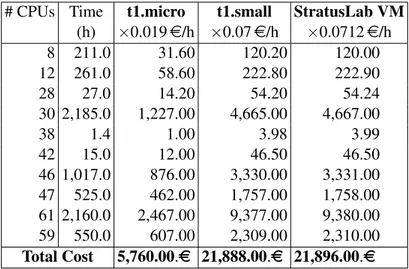
Using the results of Figure 4.1 and the break-even rate of 0.0712 e/h for amortiz-ing the StratusLab datacenter TCO in two years with a 70% utilization as found in Section 3.7, we can also calculate the amount of the Grid site hosting in the StratusLab premises if we operated with a pay-as-you go business model. Under these assumptions, using the 0.019 e/h, the 0.07 e/h and the 0.0712 e/h rates and the data of Figure 4.1, we calculate the appropriate costs. In the case of the total StratusLab cluster, we would have to pay 15,832 e, 60,162 e or 60,186 e if Stra-tusLab was hosted in t1.micro, t1.small or StraStra-tusLab VM instances respectively. In the case of the Grid site only, the amounts are 5,760 e, 21,888 e and 21,896 e for t1.micro, t1.small and StratusLab VM respectively. Table 4.1 shows this de-tailed data grouped by the 10 different grid site configurations used over the period of reporting (mid Jan 2011 to mid Nov 2011).
From the previous analysis, we notice that the grid site hosting in Amazon’s premises is cheaper compared to the self-hosting in a private cloud when t1.micro instances are utilized. Nevertheless, t1.micro instances are unreliable and have a very low I/O due to over-commitment. Compared to the t1.small instance, the StratusLab achieves almost the same price. This is due to the grid cluster size: the cluster is big enough to justify its deployment in a private cloud. As the infras-tructure keeps growing and is required to operate for longer time periods, private clouds are cheaper than public clouds. What is more, we notice that, by the end of
Table 4.1: Comparision of Costs in Amazon and StratusLab Clouds
# CPUs Time t1.micro t1.small StratusLab VM (h) ×0.019 e/h ×0.07 e/h ×0.0712 e/h 8 211.0 31.60 120.20 120.00 12 261.0 58.60 222.80 222.90 28 27.0 14.20 54.20 54.24 30 2,185.0 1,227.00 4,665.00 4,667.00 38 1.4 1.00 3.98 3.99 42 15.0 12.00 46.50 46.50 46 1,017.0 876.00 3,330.00 3,331.00 47 525.0 462.00 1,757.00 1,758.00 61 2,160.0 2,467.00 9,377.00 9,380.00 59 550.0 607.00 2,309.00 2,310.00 Total Cost 5,760.00.e 21,888.00.e 21,896.00.e
the year, 53.4 ke out of the StratusLab’s 251.8 ke TCO or 20% has been amortized by its use. Assuming an increasing trend in utilization, we can safely bet that after a couple of years the StratusLab cost will be entirely amortized.
5 Summary and Conclusions
This report presents an economic analysis of the private cloud infrastructure run by the StratusLab project. Taking into account the overall infrastructure cost and the operational and administrative expenses, we calculated the TCO of this private cloud for two years (the project’s duration). In addition we presented a use case scenario, the hosting of a grid site on top of this cloud and compared the overall cost to deploy this service in our private cloud with the cost to run it in Amazon’s EC2 commercial cloud.
Our analysis suggests that even for a small scale private cloud installation, like the one in StratusLab, the economic benefits can be experienced in a relatively short period of 2-3 years. In our case, the theoretical cost for compute resources provisioning is almost the same compared to large-scale cloud providers like Ama-zon. These benefits can become even more evident in larger cloud installations in which case the economies of scale will significantly improve the hardware effi-ciency and consequently the investment on a private cloud will be amortized in a shorter period of time (less than a year). Another important factor is the level of utilization. Indeed, the larger the utilization (more VMs running and thus less CPU cycles wasted) the higher the return of investment will become.
Moreover, the applications that the cloud service targets also play an important role in the overall economic assessment. Indeed compute intensive applications (as those in e-science or grid computing environments) can run in a more cost effective way if an organization has full control over the underlying virtualization infrastruc-ture than using commercial clouds in which such resources are typically charged with higher hourly fees. The reason for this is that such applications are typical considered niche market from the commercial cloud providers due to their strict communication latency and specific hardware requirements. Thus these providers dedicate only a small subset of their resources for them which most probably are not specifically designed to cover the demands of such applications. The above argument is suggested by the high cost of Cluster and GPU instances provided by Amazon EC2. On the other hand an organization tha primarily targets scientific applications (typically considered high-performance or high-throughput) will in-vest in a hardware infrastructure specifically designed for them. The benefits in this case are twofold: the organization can exploit economies of scale for the spe-cific high-demanding hardware (e.g. Infiniband network, high performance stor-age, GPGPUs) and in parallel applications can take advantage of an environment
specifically tailored to their needs performing in the most optimal manner. The above are also inline with the results presented also in the US DOE funded Magel-lan project final report [14].
Arguably in our analysis there are many parameters that impact the final posi-tive outcome and should be taken under consideration from organizations planning to deploy their own private cloud. The operational cost for example plays a signif-icant role in the overall service provisioning budget. Our reference site is operated in Greece where the level of salaries (around 40K euro per year) are probably somewhere in the middle between regions with more expensive labor (e.g. US, Germany, Japan) and cheeper ones (India, China etc). In some cases the level of manpower for a specific country may exceed a certain threshold that would satisfy the outsourcing of cloud services to commercial providers which either they are located in cheeper countries, or the economies of scale overcomes the labor ex-penses (or both). The location may also impact the operational exex-penses from the point of view of cooling and power consumption. For example electricity rates are impacted by type of natural resources used to generate power and overall power consumption for cooling is affected by the local climate characteristics. In general, all these factors that are important for a cost-effective datacenter play a serious role in the TCO of a large scale cloud computing installation and should be taken under consideration when deciding for an organizations overall IT strategy.
Glossary
Appliance Virtual machine containing preconfigured software or services Appliance Repository Repository of existing appliances
CA Certification Authority CE Computing Element
DCI Distributed Computing Infrastructure EC2 Elastic Compute Cloud
EGEE Enabling Grids for E-sciencE EGI European Grid Infrastructure
EGI-InSPIRE EGI Integrated Sustainable Pan-European Infrastructure for Researchers in Europe. The European funded project aimed to establish the sustainable EGI
EMI European Middleware Initiative
Front-End OpenNebula server machine, which hosts the VM manager Instance see Virtual Machine / VM
IPMI Intelligent Platform Management Interface
Machine Image Virtual machine file and metadata providing the source for Virtual Images or Instances
NFS Network File System NGI National Grid Initiative
Node Physical host on which VMs are instantiated OS Operating System
Private Cloud Cloud infrastructure accessible only to the provider’s users Public Cloud Cloud infrastructure accessible to people outside of the provider’s
organization
PUE Power usage effectiveness SE Storage Element
TCO Total Cost of Ownership TB Terabyte(s)
Virtual Machine / VM Running and virtualized operating system VO Virtual Organization
References
[1] Amazon. Amazon EC2 Instance Types. http://aws.amazon.com/ec2/ instance-types/, 2011.
[2] Amazon. EC2 Pricing. http://aws.amazon.com/ec2/pricing/, 2011.
[3] Amazon. Elastic Compute Cloud (EC2). http://aws.amazon.com/ec2, 2011.
[4] C. Belady, A. Rawson, D. Pfleuger, and S. Cader. Green Grid Data Center Power Efficiency Metrics: PUE and DCiE. Consortium Green Grid, 2008.
[5] R. Byrom et al. APEL: An implementation of Grid accounting using R-GMA. In UK e-Science All Hands Conference, 2005.
[6] A. Candiello et al. A Business Model for the Establishment of the European Grid Infrastructure. In Journal of Physics: Conference Series, volume 219, page 062011. IOP Publishing, 2010.
[7] EGI. European Grid Initiative. http://www.egi.eu.
[8] EMI. European Middleware Initiative. http://www.eu-emi.eu.
[9] S. Greenberg, E. Mills, B. Tschudi, P. Rumsey, and B. Myatt. Best practices for data centers: Lessons learned from benchmarking 22 data centers.
Pro-ceedings of the ACEEE Summer Study on Energy Efficiency in Buildings in
Asilomar, CA. ACEEE, August, 3:76–87, 2006.
[10] E. Laure et al. Programming the Grid with gLite. Computational Methods in
Science and Technology, 12(1):33–45, 2006.
[11] Public Power Corporation of Greece. Power Usage Price List. http://bit.ly/ tH7vMn, 2011.
[12] Wikipedia. Intelligent Platform Management Interface. http://en.wikipedia. org/wiki/Intelligent Platform Management Interface, 2011.
[13] Wikipedia. Public Power Corporation of Greece. http://en.wikipedia.org/ wiki/Public Power Corporation of Greece, 2011.
[14] K. Yelick, S. Coghlan, B. Draney, and R. S. Canon. The Magellan Report on Cloud Computing for Science. Technical report, U.S. Department of En-ergy, Office of Science, Office of Advanced Scientific Computing Research (ASCR), December 2011.