HAL Id: inria-00543946
https://hal.inria.fr/inria-00543946
Submitted on 6 Dec 2010
HAL is a multi-disciplinary open access
archive for the deposit and dissemination of sci-entific research documents, whether they are pub-lished or not. The documents may come from teaching and research institutions in France or abroad, or from public or private research centers.
L’archive ouverte pluridisciplinaire HAL, est destinée au dépôt et à la diffusion de documents scientifiques de niveau recherche, publiés ou non, émanant des établissements d’enseignement et de recherche français ou étrangers, des laboratoires publics ou privés.
French Cadastre: a preliminary investigation
Denis Roegel
To cite this version:
Denis Roegel. The great logarithmic and trigonometric tables of the French Cadastre: a preliminary investigation. [Research Report] 2010. �inria-00543946�
The great logarithmic and
trigonometric tables
of the French Cadastre:
a preliminary investigation
Denis Roegel
14 December 2010
This document is part of the LOCOMAT project: http://www.loria.fr/~roegel/locomat.html
3
Important notice
This report is supplemented by 47 volumes of tables, each as a PDF file. These tables replicate the structure of the Tables du cadastre and are provided to ease further research. Unfortunately, for reasons of space, the complete set is possibly not provided at the same location as this report. Consequently, we are currently (and for a limited time) making it available on CD by request, for a modest fee covering the cost of the CD, its burning, and its shipping. The CD contains all the tables from the LOCOMAT collection, that is, about 80 volumes. Contact the author for details.
Contents
Introduction 9
1 The Tables du cadastre 11
1.1 The decimal metric system . . . 11
1.2 The need for more accuracy . . . 15
1.3 Prony and the cadastre . . . 17
1.4 History of the tables . . . 22
1.4.1 Work organization . . . 22
1.4.2 Computing (1793–1796) . . . 28
1.4.3 Printing . . . 33
1.4.4 Delays . . . 34
1.4.5 Revival under the Consulate . . . 38
1.4.6 Involvement of the British government (1819–1824) . . 40
1.4.7 The waning of the project (1824–1833) . . . 45
1.4.8 Legalization of the decimal system . . . 46
1.4.9 The analysis of the tables (1858) . . . 47
1.4.10 Going beyond the Tables du cadastre . . . 51
1.5 Reduced tables . . . 52
1.6 The manuscripts . . . 55
1.7 Going further . . . 57
2 Computational methods and tables 59 2.1 Interpolation . . . 59
2.1.1 The method of differences . . . 59
2.1.2 Accuracy of the interpolation . . . 61
2.1.3 The influence on Babbage . . . 62
2.2 Lagrange’s formula for ∆nf(x) . . . 63
2.3 Logarithms of the numbers . . . 64
2.4 Sines . . . 71
2.5 Tangents . . . 75
2.5.1 Computation of tangents on 0q–0q.5000 . . . 75
2.5.2 Computation of tangents on 0q.5000–0q.9400 . . . 76
2.5.3 Computation of tangents on 0q.9400–1q.0000 . . . 76
2.6 Logarithms of the sines . . . 78
2.7 Logarithms of the tangents . . . 82
2.8 Abridged tables . . . 87
2.9 Multiples of sines and cosines . . . 89
3 Practical interpolation and accuracy 91 3.1 The computers . . . 91
3.2 Forms for the interpolation . . . 93
3.2.1 Main forms . . . 93
3.2.2 Forms for the sines . . . 93
3.3 Interpolation methods . . . 102
3.3.1 Forward and retrograde interpolations . . . 102
3.3.2 Choosing a method of interpolation . . . 102
3.3.3 Interpolation types . . . 104
3.3.4 A note on rounding . . . 105
3.3.5 A classification of interpolation methods . . . 107
3.4 Structure of the differences . . . 108
3.4.1 Groups of numbers and dashed lines . . . 108
3.4.2 Vertical position of the constant ∆n . . . 109
3.5 Accuracy . . . 109
3.5.1 General considerations . . . 109
3.5.2 Log. 1–10000 . . . 111
3.5.3 Identity of the manuscripts and corrections . . . 111
3.5.4 Anomalies . . . 113
3.6 Strategies for retrograde interpolation . . . 113
3.7 Correction of errors . . . 114
4 Description of the manuscripts 115 4.1 Paper and binding . . . 115
4.1.1 Paper . . . 116 4.1.2 Binding . . . 116 4.1.3 Stamps . . . 117 4.2 Introductory volume . . . 118 4.3 Logarithms from 1 to 10000 . . . 120 4.4 Logarithms from 10000 to 200000 . . . 125 4.4.1 Truncation lines . . . 126
4.4.2 Comparison with Briggs’ tables . . . 126
4.4.3 Corrections by the Service géographique de l’armée . . 129
CONTENTS 7
4.4.5 Constant differences ∆i . . . 130
4.4.6 Accuracy of interpolated values . . . 132
4.4.7 Retrograde interpolations . . . 133
4.5 Sines . . . 137
4.5.1 Structure . . . 137
4.5.2 Retrograde (or backward) interpolation . . . 140
4.5.3 Truncation lines . . . 140
4.5.4 The last values of the table . . . 141
4.5.5 Accuracy . . . 142
4.5.6 Errors . . . 142
4.6 Logarithms of the arc to sine ratios . . . 144
4.6.1 Forms . . . 144
4.6.2 Truncation lines . . . 144
4.6.3 Positions of A and the ∆n . . . 144
4.6.4 Structure of the interpolation . . . 145
4.6.5 Pivots . . . 146
4.6.6 Errors . . . 146
4.7 Logarithms of sines from 0q.00000 to 0q.05000 . . . 149
4.8 Logarithms of sines after 0q.05000 . . . 151
4.8.1 Truncation lines . . . 151 4.8.2 Positions of ∆n . . . 151 4.8.3 Constancy of ∆n . . . 152 4.8.4 Pivots . . . 153 4.8.5 Discrepancy in 0q.51000 . . . 153 4.8.6 Retrograde interpolations . . . 153 4.8.7 Indication of degrees . . . 154 4.8.8 Interpolation corrections . . . 154 4.8.9 Errors . . . 154 4.8.10 Fragments . . . 155
4.9 Logarithms of the arc to tangent ratios . . . 156
4.9.1 Forms . . . 156
4.9.2 Truncation lines . . . 156
4.9.3 Positions of A′ and the ∆n . . . 156
4.9.4 Accuracy of A′ . . . 157
4.9.5 Pivots . . . 157
4.9.6 Structure of the interpolation . . . 158
4.10 Logarithms of tangents from 0q.00000 to 0q.05000 . . . 159
4.11 Logarithms of tangents after 0q.05000 . . . 160
4.11.1 Truncation lines . . . 160
4.11.2 Pivots . . . 160
4.11.4 Accuracy . . . 162
4.11.5 Interpolation adaptations . . . 162
4.11.6 Interpolated values . . . 162
4.11.7 Constancy of ∆n . . . 163
4.11.8 Values of the logarithms . . . 163
4.11.9 Retrograde interpolations . . . 163
4.11.10 Unidentified interpolations . . . 164
4.11.11 Indication of degrees . . . 165
4.11.12 Interpolation corrections . . . 165
4.11.13 Errors . . . 165
4.12 Abridged tables of log. of sines/tangents . . . 167
4.12.1 Truncation . . . 167
4.12.2 Positions of the ∆n . . . 167
4.12.3 Structure . . . 168
4.12.4 Corrections . . . 170
4.12.5 Accuracy . . . 171
4.13 Multiples of sines and cosines . . . 172
5 Printing the tables 175 5.1 Planned structure . . . 175 5.1.1 Project 1 (1794) . . . 175 5.1.2 Project 2 (ca. 1794) . . . 176 5.1.3 Project 3 (1794–1795) . . . 177 5.1.4 Project 4 (1819) . . . 177 5.1.5 Project 5 (1825) . . . 178 5.2 Stereotyping . . . 178
5.3 Truncating the computations . . . 181
5.4 The 1891 excerpt . . . 181
5.5 Description of the 47 auxiliary volumes . . . 182
6 Conclusion and future research 185
7 Primary sources 189
Acknowledgements 193
Introduction
Je ferai mes calculs comme on fait les épingles.1
Prony As part of the French reform in the units of weights and measures, an effort was undertaken at the beginning of the 1790s at the Bureau du cadastre to construct tables of logarithms which would not only be based on the more convenient decimal division of the angles, but also would become the most accurate such tables ever created.
Gaspard de Prony had the task to implement this project, and he decided to split the computations among a number of computers. Use was made of only the simplest operations: additions and subtractions of differences.
Begun in 1793, these tables were completed around mid-1796, but, al-though they were supposed to, they were never printed. Eventually, in the 1830s, the project was totally abandoned.
This mythical endeavour of human computation nowadays lies forgotten in libraries in Paris and, apart from a 30-page description of the tables by Lefort in 1858,2 very little has been written on them.
The work done cannot be merely described as interpolations using the method of differences. In fact, perhaps the main outcome of our investigation is that the picture is not as clear as the myth may have made it. It is actually much more complex. Additions and subtractions may seem simple operations, but so much appears to have been left unspecified. This has probably become clear to Prony and others, but only when it was too late.
This document summarizes a preliminary investigation of these tables, but the task is much more daunting than it appears at first sight. This study does in fact barely scratch the surface. It tries to give some impetus, but much still lies ahead.
1[Edgeworth (1894)] 2[Lefort (1858b)]
Chapter 1
The Tables du cadastre
1.1
The decimal metric system
The decimal logarithmic and trigonometric tables conceived by the French cadastre take their roots in the metric reform. The founding act was the law of 26 March 1791 which based the metric system on the measurement of the meridian.3 As pointed out by Gillispie, decimalization became incorporated,
or even “smuggled,” into the metric system in corollary of that law, because the new unit was defined as the 10 millionth part of a quarter of a meridian and a sexagesimal division would have corrupted the unity of the system.4
In other words, the decimal metric system was made complete by substi-tuting a decimal or centesimal division to the old division of the quadrant.5
In turn, the decimal division of the quadrant made it necessary to compute new tables. Such arose the need for tables of logarithms of trigonometric functions using the decimal or centesimal division of the quadrant.6
Moreover, it was felt that the publication of new tables would help the propagation of the metric system.7
The first decimal8 tables made as a consequence of the new division of
3[Méchain and Delambre (1806–1810)] 4[Gillispie (2004), p. 244]
5[Carnot (1861), p. 552]
6It should be remarked that there had been at least one table with a partial
decimal-ization, namely Briggs’ Trigonometria Britannica [Briggs and Gellibrand (1633)]. Briggs used the usual division of the quadrant in 90 degrees, but divided the degrees centesimally. Briggs also gave a small table of sines for a division of the circle in 100 parts, which is the division used by Mendizábal in 1891 [de Mendizábal-Tamborrel (1891)].
7[Gillispie (2004), p. 484]
8Some early trigonometric tables are now called “decimal” for a slightly different reason,
namely for a decimalization of the radius. Around 1450, Giovanni Bianchini introduced in Western mathematics tables of tangents in which the radius was 103. He also computed
the quadrant were those of Borda (1733–1799),9 completed in 1792, but only
published in 1801.10 The 7-place tables of Callet computed after those of
Borda were actually published before them in 1795.11,12
Given the context in which the decimal division was popularized, it was sometimes called the “French division of the circle.”13
In 1799, Hobert and Ideler published in Berlin another table of logarithms based on the decimal division of the quadrant.14 In their introduction, they
defend the idea that the decimal division is a logical evolution that followed
tables of sines in which the radius was 60 · 103, following the tradition of Ptolemy. The
former tables can be called “decimal,” while the latter are “sexagesimal.” The angles them-selves were in both cases sexagesimal, and not decimal or centesimal in the revolutionary meaning [Rosińska (1981), Rosińska (1987)]. Of course, the new decimal tables such as Borda’s were decimal in both senses.
9[de Borda and Delambre (1801)] Delambre writes that the manuscript had been
completed in 1792 [de Borda and Delambre (1801), p. 39]. These tables were based on those of Briggs [Briggs (1624)] and Vlacq [Vlacq (1628)] (trigonometric part), see [de Borda and Delambre (1801), pp. 40 and 114].
10These tables can be viewed as a superset of those of Callet published six years before.
They gave the logarithms of numbers from 10000 to 100000 with 7 decimals, the logarithms of the sine, cosine, tangent and cotangent with 11 decimals every ten centesimal seconds from 0 to 10 centesimal minutes, then every 10 centesimal minutes until 50 centesimal degrees, and finally the logarithms of the six trigonometric functions with 7 decimals every 10 centesimal seconds (every 100000th of a quadrant) from 0 to 3 centesimal degrees, and every minute (every 10000th of a quadrant) from 3 centesimal degrees to 50 centesimal degrees. [de Borda and Delambre (1801)]
11Callet writes that his decimal tables can be viewed as an abridged version of Borda’s
tables [Callet (1795), p. vi]. Callet has possibly used Borda’s tables as his source, but he is not explicit about it. Delambre writes that Callet had Borda’s manuscript in his hands [de Borda and Delambre (1801), pp. 113–114]. Prony wrote that Callet based his tables on the Tables du cadastre [Riche de Prony (1824), pp. 39–40], but Callet actually only made a comparison, still leaving errors [de Borda and Delambre (1801), pp. 113–114]. Delambre, instead, compared the logarithms of sines and tangents of Borda’s table with the Tables du cadastre [de Borda and Delambre (1801), p. 114].
12In addition to the logarithms of sines and tangents in the sexagesimal division, Callet’s
1795 tables also gave the logarithms of the sines, cosines and tangents with 7 decimals every 10000th of the quadrant. Moreover they gave the natural sines and cosines with 15 decimals and the logarithms of the sines and cosines with 9 decimals every 1000th of the quadrant. [Callet (1795)] In the first edition of Callet’s tables, published in 1783, the decimal division was not yet used [Callet (1783)].
13[Keith (1826), p. x]
14[Hobert and Ideler (1799)] Hobert and Ideler gave the sines, cosines, tangents,
cotan-gents and their logarithms with 7 places, as well as the first differences, for the arcs 0q.00000 to 0q.03000 (by steps of 0q.00001) and from 0q.0300 to 0q.5000 (by steps of
0q.0001). There are also several auxiliary tables and corrections to Callet’s decimal
ta-bles. Hobert and Ideler’s arc values happen to be the same as those used by Plauzoles in 1809 [de Plauzoles (1809)].
1.1. THE DECIMAL METRIC SYSTEM 13 the steps of the computation by chords, by sines, Briggs’ decimal division of the degrees, then that of the quadrant. The authors mention the ongoing reform in France and explain the necessity for all non French mathematicians to get acquainted with this system:
“Jeder nicht französische Mathematiker wird alsdann genöthigt seyn, sich mit der neuen Kreiseintheilung vertraut zu machen, sey es auch nur, um die Resultate französischer Messungen und Rechnungen benutzen zu können.”15
In an 1811 review of Dealtry’s Principles of Fluxions (1810), the author attributes the first objection to the sexagesimal system to the mathematicians Oughtred and Wallis. He refers to John Newton’s centesimal trigonometric table from 1659 (sic).16 According to the reviewer, Hutton’s idea of using
the arc whose length is equal to the radius as the unit (later called the radian17) awakened the attention of the French to the subject,18 and this—
so the reviewer—is what set the French to “instantly” prepare more extensive tables, and in particular those of Callet and Borda:
“From this period the French always speak of the centesimal di-vision of the quadrant as theirs; English authors also speak of the ‘new French division of the quadrant;’ although the original
15[Hobert and Ideler (1799), p. x] In addition, Hobert and Ideler state that Schulze
had intended to publish decimal tables as soon as 1782, but that this publication never took place. According to Sarton, Schulze’s tables had a centesimal division of the degree, like Briggs’ tables [Sarton (1935), p. 199]. Eventually, Schulze only suggested a way to compute such tables [Hobert and Ideler (1799), p. xi]. These suggestions were actually followed between 1785 and 1791 by Schmidt of Schwerin who was not able to complete them. Hobert and Ideler obtained Schmidt’s work, but decided against using it for their own computations. Instead, they used the method of differences which was suggested to them by reading Cagnoli’s book in trigonometry (Traité de trigonométrie rectiligne et sphérique, 1786) [Cagnoli (1786)]. Their very interesting method is described in details in their introduction and many parallels can be drawn with Prony’s work. The ∆n
, however, were not computed analytically. Hobert and Ideler state that the computations went very quickly and that on certain days, they obtained 300 results, compared to the 600 results obtained daily by Prony’s 15 computers, as reported by Bode [Bode (1795), p. 215] [Hobert and Ideler (1799), p. xxxiii].
16This is probably Newton’s Trigonometria Britannica (1658) [Newton (1658)]. 17The name “radian” was first used in print by James Thomson in 1873
[Cajori (1928–1929), vol. 2, p. 147]. Hutton’s idea of using this unit was published in 1783 [Hutton (1812)], but the concept of radian actually goes back at least to Cotes’ Logometria (1714), which was described by Hutton.
18On the other hand, Gabriel Mouton proposed a decimal system of measures in
1670 [Hellman (1936), p. 314], and this was mentioned in the Encyclopédie, before the French Revolution.
idea is undoubtly English, and a table, as we have observed, was published here in 1659, nearly 150 years before our neighbours thought of any such division.”19
One should however remember that these lines were written in 1811, during the war between France and Britain.20
But even though some British were considering the decimal division as their invention, there were also opponents to the reform. Thomas Keith gives for instance a summary of the reasons opposing the introduction of a decimal or centesimal division of the quadrant:
“The advantages of this new division of the circle, should it be generally adopted in practical calculations, are few and trifling, when compared with the confusion and perplexity it would occa-sion. It is true that degrees, &. would be more readily turned into minutes or seconds, et vice versá, and some other advantages of minor importance would be obtained, were the new division to be universally adopted; at the same time all our valuable tables would be rendered useless; the many well-established trigonomet-rical and astronomical works, which from time to time have been published, would be little better than waste paper; the most valu-able mathematical instruments, which have been constructed by celebrated artists, must be considered as lumber in the different observatories of Europe; the latitudes and longitudes of places must be changed, which change would render all the different works on Geography useless; or otherwise the Astronomers, and those in the habit of making trigonometrical calculations, must be perpetually turning the old division of the circle into the new, or the new into the old. (...) The logarithmic tables of sines, tangents, &c. which were originally constructed by the British mathematicians, have passed through so many hands, and have been so often examined, that they may be depended upon as cor-rect; whilst the new tables would require great caution in using them.”21
19[Anonymous (1811), p. 344] According to Sarton, decimally graduated instruments
were made and sold in London in 1619 [Sarton (1935), p. 189].
20One might also contrast this opinion with the failure of the joint publication effort
initiated in 1819, probably mainly because of the centesimal structure of Prony’s tables. The British wanted to convert the tables to the sexagesimal division and this would have meant that all computations should have been redone, see [Anonymous (ca. 1820)] and section 1.4.6 in this document.
1.2. THE NEED FOR MORE ACCURACY 15 In spite of this, the decimal or centesimal division of the quadrant did not die. In 1905, for instance, it was made compulsory for the entrance examinations to the French École polytechnique and Saint-Cyr schools, and other decrees prescribed its use for various examinations.22
1.2
The need for more accuracy
The requirement to have tables with more decimals, or smaller intervals be-tween consecutive values,23 was also felt more and more. Although Briggs
and Vlacq gave logarithms of numbers and trigonometric functions with 10 to 15 places, their editions were not very practical, they had many errors, and they were excessively rare. Smaller and yet accurate tables were needed and they appeared little by little. John Newton’s tables (1671),24 for instance,
gave logarithms with five or six places. There were few seven-place tables and among the first such tables, we can name those of Vega (1783),25
Hut-ton (1785),26 Callet (1795),27 Borda (1801),28 Babbage (1827)29 and Sang
(1871).30 Most of these tables were derived from Vlacq’s tables.31
In 1794, Vega published 10-place tables based on Vlacq’s calculations,32
but apart from them, by the time the Tables du cadastre were set up, there were very few 8, 9, or 10-place tables. After Newton’s Trigonometria Britan-nica (1658),33 the next 8-place tables were those of the Service géographique
22See the foreword in Bouvart and Ratinet’s tables [Bouvart and Ratinet (1957)]
and also the note about the use of the centesimal division at the École polytech-nique [Anonymous (1901)]. See also Archibald [Archibald (1943a), pp. 36–37].
23The number of decimals and the step are related, in that if more decimals are sought
for a logarithm, then one will also need to compute logarithms of numbers with greater number of decimals located between two values of a table, and a smaller step will make interpolation easier. See for instance [Vincent (1825–1826)] for a contemporary account of the errors resulting from using a mere linear interpolation.
24[Newton (1671)] 25[Vega (1783)] 26[Hutton (1785)] 27[Callet (1795)]
28[de Borda and Delambre (1801)] This table was a decimal table. 29[Babbage (1827)]
30[Sang (1871)]
31[Vlacq (1628), Vlacq (1633)]
32[Vega (1794)] It should be remarked that Vega’s tables are not exactly those of Vlacq,
because Vega computed new values between 0◦and 2◦by interpolation. He also corrected
many errors.
de l’armée (1891),34 of Mendizábal (1891),35 and of Bauschinger and Peters
(1910–1911).36 Nine-place tables are extremely rare and none are listed in
Fletcher’s index.37
One may wonder if there really was a need for such accurate tables. In fact, they were more and more required by the increased accuracy of mea-surements. Pondering the need for 9-place tables in 1873 following Edward Sang’s project, Govi gave the example of an accurate scale which can be sen-sitive to a difference of 1 milligram for a weight of 20 kilograms in each plate, hence a sensitivity of 5 · 10−8 relatively to the weight of the load. In order to
use such values in calculations, logarithms of 8 or 9 places are necessary. The measurement of time, or of lengths, are other examples requiring accurate computations. In most cases, the computations could be done differently, but it would be slower and more complex than using adequate tables. Govi also pointed out that it was the astronomers, who are great users of tables of logarithms, but who at the same time have data with only a few accu-rate digits, who worked against more accuaccu-rate tables. In tables of compound interest, there is also a need for logarithms with more than 10 places.38
It is interesting to recall Ernest W. Brown’s comments written in 1912, when reviewing Henri Andoyer’s tables of logarithms.39 After having
ob-served that the accuracy of observations had increased very much in the previous fifty years, Brown stressed that
“[The] problem is not so much that of getting the numerical value of a single function [...] in such cases one can usually adopt devices which grind out the result at the cost of trouble and time. Many of the present day problems are on a large scale. The calculations are turned over to professional computers [...] Extended tables and, if possible, mechanical devices are more and more sought after in order to economize time and money in scientific work, just as in business.”40
34[Service géographique de l’Armée (1891)] 35[de Mendizábal-Tamborrel (1891)] 36[Bauschinger and Peters (1910–1911)]
37[Fletcher et al. (1962), p. 160] Edward Sang had a project of building a nine-place
table of logarithms from 100000 to one million, but this project never saw the light of day [Roegel (2010a)].
38[Govi (1873)] 39[Andoyer (1911)] 40[Brown (1912)]
1.3. PRONY AND THE CADASTRE 17
1.3
Prony and the cadastre
At the dawn of the French Revolution, at a time when the Treasury needed money, setting up a general cadastre was seen as the only efficient remedy to assign land taxes in a non-arbitrary way.41,42 All taxes were abolished
by the law of 1 December 1790 and replaced by a single property tax.43
Then, a decree of 16 September 1791, which became a law on 23 September 1791, proclaimed the establishment of a “cadastre général de la France” and on 5 October Gaspard Riche de Prony (1755–1839) became director of the Bureau du cadastre. Prony, as he was called, remained in that position until the cadastre was terminated in 1799.44
Prony (figure 1.1) graduated from the École Royale des Ponts et Chaus-sées45 in 1780 and became the leading engineer and engineering educator
of his days, as famous as Lagrange and Laplace.46 Among other things, in
1794 he became professor at the newly founded École Centrale des Travaux Publics (later, the École Polytechnique) where he remained professor until 1815. He was also director of the École des Ponts et Chaussées between 1798 and 1839.47
In a report he submitted on 10 October 1791, Prony described all the tasks involved in establishing a cadastre, in particular the need to revise the geodetic triangles of the Cassini map. New measurement devices would enable surveyors to make their calculations by measuring angles on the land, rather than on paper. In addition, Prony anticipated the measurement reform and planned to use several units, including an estimated value of the meter.48
41See [Noizet (1861), pp. 13–14]. It would however take years to implement this
cadastre fully. In 1807, Napoleon passed a law in order to measure and evaluate pre-cisely every parcel of property. It took until 1850 to complete the survey of the entire France.[Herbin and Pebereau (1953), pp. 21–24]
42[Herbin and Pebereau (1953), p. 17] 43[Kain and Baigent (1992), p. 225]
44[Berthaut (1902), p. 322], [Konvitz (1987), pp. 47–48] See [Grinevald (2008),
de Oliveira (2008)] for overviews of the beginnings of the French cadastre. At the be-ginning, there were only five employees, in addition of Prony. Jean-Henri Hassenfratz was assistant director in 1791–1792 [Grison (1996)], and then followed in that position by Charles-François Frérot d’Abancourt (1758–1801) [Grison (1996), p. 21].
45On the history of the Ponts et chaussées, see [Brunot and Coquand (1982)].
46[Grattan-Guinness (1990b), p. 110] For other biographical elements on Prony, see in
particular [Tarbé de Vauxclairs (1839)], [Parisot (no year), pp. 399–405], [Moigno (1847)], [Walckenaer (1940)], [McKeon (1975)], [Picon et al. (1984)], [Bradley (1994)], and [Bradley (1998)]. A biographical note by C. Perrin and dated 1895 is con-tained in the Archives of Chamelet, Prony’s birthplace (Archives du Rhône, Série C25, Dossier 1).
47[Konvitz (1987), pp. 47–48] 48[Konvitz (1987), p. 48]
Figure 1.1: Gaspard Riche de Prony (1755–1839) (Source: Wikipedia) A copy of this engraving is also contained in Prony’s file in the Archives of the Académie des Sciences.
Figure 1.2: Prony’s name on the Eiffel tower, between those of Fresnel and Vicat. (Photograph by the author.) The names were concealed by paint from the beginning of the 20th century until their restauration in 1986. See also [Chanson (2009)].
1.3. PRONY AND THE CADASTRE 19 Prony had valued accuracy and uniformity above all, and he believed that only a centralized administrative structure could guarantee them.49
Prony obtained for Jean-Guillaume Garnier (1766–1840) to become head of the geometrical section of the Bureau of the cadastre, that is, the section of computers.50 Garnier remained at this position until the 1er Messidor an
V (19 June 1797)51. When the central office of the cadastre was complete, it
was made of sixty employees, divided in two sections, one of geometers and calculators (headed by Garnier), and one of geographers and drawers.52
One of Prony’s first tasks was to measure the total area of France from the original maps and it took him nearly a year.53
Instruments, in particular Borda’s repeating circle conceived around 1787, were converted to the decimal division of the angles, and the need for tables based on that decimal division became more and more urgent.54
So, it is no surprise that in 1793 Lazare Carnot55, Claude-Antoine Prieur
(“from the Côte-d’Or”),56 who were directing the war effort,57 and Brunet
(from Montpellier),58 gave Prony the task of computing new tables of
loga-49[Konvitz (1987), p. 57]
50[Garnier (1826), p. 118] Interestingly, it was the printer Firmin Didot to whom
Gar-nier gave mathematics lessons who put him in touch with Prony. See Quetelet’s no-tices on Garnier [Garnier and Quetelet (1841)], [Quetelet (1867), pp. 206–207], in which some dates may however be inaccurate. According to Michaud’s biographical notice, Gar-nier did not benefit from this work as much as he hoped, and Prony took “the lion’s share.”[Michaud (1856), p. 594]
51[Quetelet (1867), p. 207]
52This structure is reflected by the salary summaries, and other accounts, such as
Gar-nier’s [Quetelet (1867), p. 207].
53[Konvitz (1987), p. 49] See also P.C., Ms. 2148 and 2402 for further details on the first
activities of the Bureau du Cadastre.
54[Konvitz (1987), p. 49]
55Carnot, who was trying to protect men of science, had actually first been in touch
with Prony a few months earlier in 1793, when he sent him an anonymous note in order to warn him of possible problems resulting from Prony hiring some persons with non Republican views [Carnot (1861), p. 506]. Later, Prony considered that Carnot saved his life [Barral (1855), p. 591]. On Carnot’s scientific work, see [Gillispie (1971)].
56Prieur (1763–1832) was an engineer and was in particular involved in the
met-rical system. He presented a Mémoire on the standardization of weights and mea-sures in 1790 [Zupko (1990), p. 417], [Gillispie (2004), p. 229], [Bigourdan (1901)], [Hellman (1931), p. 278], [Hellman (1936), p. 315]. He was one of the main founders of the École polytechnique [Bouchard (1946)].
57In August 1793, Carnot and Prieur became members of the Comité de Salut Public
(Committee of Public Safety) and had the responsibility of arming the soldiers. They were the only members with a scientific and technical background.
58Probably J.-J. Brunet, president of the Commission des subsistances et
rithms.59
In a letter to Arago, Prony recalled his first encounter with Carnot. He was asked to come in an office of the Convention and Carnot gave him very detailed instructions of the work to accomplish. The tables had to be the most accurate and “the greatest and most imposing monument of computation ever made, or even conceived.”60
According to Prony, the demand was in fact even more accurate. Prony was not only asked to compute the trigonometric functions and their loga-rithms with a great number of decimals and with a small step, but he also had to recompute the logarithms of numbers, with twice the accuracy of the greatest known tables.61
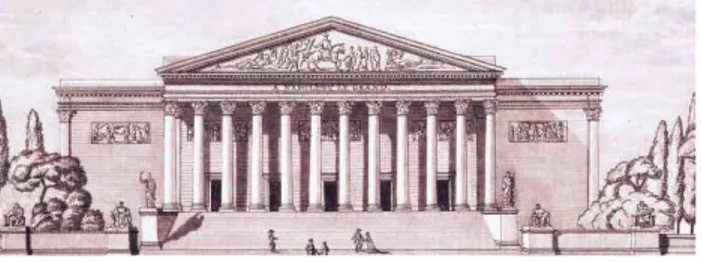
The work on the tables was begun in 1793 and probably completed around mid-1796.62 The work was completed on the premises of the Bureau du
cadastre, namely at the Palais Bourbon (figure 1.3), the building which is now the seat of the French National Assembly.
In Nivôse IV (December 1795-January 1796), almost at the time of the completion of the tables, Prony had an annual salary of 12000 francs,63 a
section chief earned 7500 francs, and a calculator 3750 francs.
59Some sources, such as [Bradley (1994), Bradley (1998)], state that the tables were
be-gun in 1792, but Prony makes it clear that it was Carnot who asked him to make the tables at the end of 1793. Bradley also puts the completion of the tables at 1801 [Bradley (1994), p. 244] which was merely the date of a report [Riche de Prony (1801)].
60[Carnot (1861), p. 552]
61[Riche de Prony (1824), p. 35] On the other hand, this notice contains some errors, so
that one could also doubt Prony’s account. On Carnot’s approach, Juhel recently made the observation that for Carnot there was no difference between warfare and mathemat-ics [Juhel (2010), p. 59].
62Since the tables were never published, and hopes still appeared at various stages
of a process that lasted 40 years and in which reports were occasionally published to support the publication, the completion of the tables is sometimes reported with some uncertainty. Grattan-Guiness writes for instance that the tables were completed in 1801 [Grattan-Guinness (1990b), p. 179], but this is merely the date of Prony’s note on the project [Riche de Prony (1801)]. The tables were waiting to be printed and published since their completion mid-1796. This date is supported by various facts, such as the completion of the trigonometric tables in 1795, that of more auxiliary tables (such as that of multiples of sines) after 1795, and a mention in the tables of logarithms of numbers showing that they had not been completed in 1795. Prony apparently announced in 1796 that the tables had been completed, and it was echoed abroad [Anonymous (1796b)]. It is possible that some other tables, such as the 8-place tables, were computed after mid-1796. See also the 1820 note [Anonymous (1820 or 1821), p. 8]. Various authors wrote that the tables had been completed in two years (for instance Parisot [Parisot (no year), p.400]), but usually copying on each other.
63The franc replaced the livre by the law of 18 Germinal III (7 April 1795)
1.3. PRONY AND THE CADASTRE 21 In 1795, the École des Géographes was created by the law of 30 Vendémi-aire IV (22 October 1795), at the same time as the École polytechnique (the former École Centrale des Travaux Publics) and other schools.64 This École
des Géographes was to have about twenty students who could apply to it after having studied at least for one year at the École polytechnique. The director of the cadastre was attached to the school, implicitely being its di-rector. The students of the school would be able to work at the cadastre, or at other administrations that needed them, and the students were to become ingénieurs-géographes. The law of 1795 explicitely stated that the number of students would initially be fifty, so as to stimulate the work of the cadastre.65
The school was of course instituted for the instruction of surveyors, an-ticipating field work that would begin in 1795, when Delambre and Méchain would have completed the measure of the meridian between Dunkerque and Barcelona.66 This measure would provide a definition for the meter, which
was to be a 10 millionth of a quarter of a meridian. As mentioned earlier, Delambre and Méchain had instruments graduated decimally, and there was a real need for decimal trigonometric tables.67
Unfortunately, the measure of the meridian was only completed in 1798 and the metric system was eventually adopted in 1799. Because of these delays, the geodetic section of the cadastre concentrated on matters other than surveying, and in particular on the tables of logarithms.68
By 1799, when measurement reform was complete, budgetary pressures led to the elimination of the cadastre. Prony complained that he and his staff had been asked to do too much and had been underfunded for too long.69
The Great Tables then became orphans. Funding was gone, and the tables remained in manuscript form. Decimal tables were not extinct, though, for the first readily accessible decimal tables were published by Borda and Delambre in 1801.70
64[Denisart et al. (1807), p. 161], [Rondonneau (1818), pp. 631–632] The École des
Géographes was to be associated with another school, the École nationale aérostatique, see [Bret (1990–1991)].
65[Rondonneau (1818), p. 631]
66[Konvitz (1987), p. 50] and [Gillispie (2004), p. 481] For more on
Delam-bre and Méchain’s journey, see Ken Alder’s account [Alder (2002)]. The re-sults of Méchain and Delambre’s computations were published in three vol-umes [Méchain and Delambre (1806–1810)].
67[Gillispie (2004), p. 487]
68In 1808, in his Manuel de l’ingénieur du cadastre, Pommiés considered that Prony
was able to devote himself to the computations, because there was little else to do for the cadastre due to the revolutionary wars [Pommiés (1808), p. x].
69[Konvitz (1987), p. 52] 70[Gillispie (2004), p. 487]
1.4
History of the tables
It is now possible to draw a fairly accurate picture of the history of the Tables du cadastre. When Prony was given the task to produce new tables of logarithms, he must have naturally thought of the method of differences, in particular since he had written about differences in 1790 in the context of interpolation to determine gas expansion laws.71 The problem was therefore
to find out how these differences should be computed.
Figure 1.3: The Palais Bourbon in the 19th century, the location of the Bureau du cadastre. At the end of the 18th century, the Roman portico had not yet been added. (Source: Wikipedia)
1.4.1
Work organization
In his celebrated work The Wealth of Nations, Adam Smith72 considered the
example of the division of labor in a pin-factory. According to Smith, “a workman not educated to this business, nor acquainted with the use of the machinery employed in it, could scarce, perhaps, with his utmost industry, make one pin in a day.” But if the work is split and specialized, “ten persons, therefore, could make among them upwards of forty-eight thousand pins in a day.”73
Inspired by Smith, Prony decided to use manufacturing processes to com-pute the logarithms.74 Many tasks were similar and could be parallelized.
71[Grattan-Guinness (1990b), p. 177]
72[Smith (1776), Peaucelle (2006), Peaucelle (2007)]
73Smith’s conclusion should of course be relativized, in particular because it is set in an
“ideal” factory where people are merely one-operation machines, and would slow down the work tremendously by applying themselves to tasks for which they have no training. But employees learn, and the discrepancy between Smith’s specialization and the ‘one-person-does-it-all’ version is not as extreme as Smith thought. Moreover, even if the workman who did everything were qualified in his multiple tasks, he would still usually do less than several workmen qualified in only one task.
1.4. HISTORY OF THE TABLES 23 Prony’s division was however not an exact copy of the pin-factory, because there was mainly one computing task, which was divided in about twenty computers, each doing a similar work. In the pin-factory, each of Smith’s ten workers were specialized, and doing a specific task. There was no such spe-cialization in Prony’s scheme, except for the task of providing blank sheets with initial values, and checking the values. Most of the computations were only of one type.
So, with this inspiration, Prony organized the logarithm-factory in three groups:
• In the first group, there were five or six mathematicians of “very high merit,” but only Adrien-Marie Legendre (1752–1833) is named ex-plicitely by Prony.75 Their role was to elaborate formulæ and to
com-pute fundamental values, such as coefficients, number of digits, etc. Prony must certainly be included in this group. Jean-Baptiste Joseph Delambre (1749–1822) is known to have been close to the compu-tations, and probably also Charles de Borda (1733–1799), but they were perhaps not meant by Prony. In his course of the École Poly-technique [Riche de Prony (1796b), p. 555], Prony only mentions José María de Lanz (1764–1839) and Charles Haros who worked on Mou-ton’s interpolation problem. There was probably some overlap between the first and second groups, some members working both on the ana-lytical part and on the application of the formulæ. Obviously, the first
Prony only mentions applying the methods of division of labour [Riche de Prony (1801), p. 2]. In 1819, Lacroix observed that the 1801 report is above all interesting because it shows the utility of the division of labour to the execution of the most long and dif-ficult calculations [Lacroix (1819), p. 19]. In 1820 and 1824, Prony wrote that he ac-cidentally found Smith’s book in an antiquarian bookstore, opened it randomly on the chapter on the division of labour (which happens to be chapter one), and conceived the plan to construct logarithms like one constructs pins. Then Prony wrote that he was prepared to this conception by certain classes he was then teaching at the École Polytech-nique [Riche de Prony (1824), pp. 35–36]. But at that time, there was not yet an École Polytechnique and not even its predecessor. As others have remarked, some of Prony’s writings are inconsistent. Prony finally wrote that after having conceived his plan, he went to the countryside and established the foundations of the new factory. How much of this story is really true is not known. Prony’s example also inspired Babbage, and it has later become a favorite example either for economists studying the division of la-bor, or for cognitive scientists exploring the metaphor of the mind as a computer. Some recent articles exploring these ideas are [Gigerenzer and Goldstein (1996), Green (2001), Langlois (2003), Boden (2006), Bullock (2008), Langlois and Garzarelli (2008)]. On the general question of human computing before computers, see the very interesting book by David Grier [Grier (2005)].
75[Riche de Prony (1801), p. 4] Delambre wrote that Legendre presided the analytical
group had only a temporary existence.76
• In the second group, there were computers acquainted with calculus, sometimes called “calculateurs.” They computed the values of the ini-tial logarithms and of the iniini-tial differences ∆, using the formulæ pro-vided by the first group. They then gave calculation sheets to the members of the third group. They were also in charge of checking the results which came back from the third group. Members of this group must also have computed the first 10000 logarithms to 19 places. The members of this group may have varied, and may not be reflected accu-rately in the salary summaries. For instance, at the end of 1795, there is a group of mathématiciens comprising Langlet père, Antoine Joseph Reboul (1738–1816),77Jacques Joseph Grou, Theveneau,78and Charles
Haros,79but at that time, the work on the tables was mostly finished, so
that these mathématiciens may actually be the calculateurs mentioned
76According to Grattan-Guinness, the first group comprised also Carnot and
Prieur [Grattan-Guinness (1990b), p. 179], but I do not know the source of this infor-mation. Grier also wrote that Legendre and Carnot were part of that group, referring to Babbage who mentions none of them [Grier (2005), p. 37 and note 40].
77Born in Montpellier, 1738–1816, Reboul was a benedictine of the Congregation of
St. Maur and professor of mathematics and physics at the Sorèze military school.(A.N. F1bI44). He apparently published tables of Venus in 1811.
78Probably Charles-Marie-Simon Théveneau (1759–1821) [Nielsen (1929), p. 229].
Théveneau edited Clairaut’s algebra in 1801 and was also a poet. He is mentioned by Callet as having compared the centesimal tables in Callet’s tables with the Tables du cadastre [Callet (1795), p. vi].
79We know that Haros worked on the development of formulæ for the computation of
logarithms. After 1795, Haros was one of the computers of the Connaissance des tems. Among Haros’ scientific works, there is an Instruction abrégée sur les nouvelles mesures qui doivent être introduites dans toute la République, au 1er vendémiaire an 10 : avec des tables de rapports et de réductions (1801, also with editions in at least 1802 and 1810), Comptes faits à la manière de Barême sur les nouveaux Poids et Mesures, avec les prix proportionnels à l’usage des commerçans etc. (1802) and also an article anticipating the Farey sequence (“Tables pour évaluer une fraction ordinaire avec autant de décimales qu’on voudra ; et pour trouver la fraction ordinaire la plus simple, et qui approche sensiblement d’une fraction décimale,” Journal de l’Ecole Polytechnique 4(11) (Messidor X), 364–368). See also Roger Mansuy, Les calculs du citoyen Haros — L’apprentissage du calcul décimal, 2008, 3 pages, and [Guthery (2010)]. On 2 July 1809, Haros’ widow wrote to Prony about tables of logarithms started by her late husband, and that she wanted to be examined by Prony, being now needy. According to her, Haros had wanted to compute the logarithms up to a million, and he thought that it would earn him a lot of money. (PC: Ms. 1745) One might want to correlate this information with the manuscript 8-place tables located in the Ponts et chaussées archives, but these tables are probably unrelated, first because the 8-place tables do not bear the name of Haros, nor any note alluding to such an origin, and second because two identical copies of Haros’ tables would probably not have ended up in Prony’s hands.
1.4. HISTORY OF THE TABLES 25 by Prony in 1801 [Riche de Prony (1801)]. According to Garnier, Nico-las Maurice Chompré (1750–1825) was also involved,80probably in this
section.81 We also know that Nicolas-Antoine Guillard (ca. 1760–1820),
a French mathematician employed at the cadastre in 1794, was work-ing on the analytical part of the computation of the tables.82
Jean-Guillaume Garnier (1766–1840),83 Charles Plauzoles,84 José María de
Lanz (1764–1839),85 Nicolas Halma (1755–1828),86 Étienne-Marie
Bar-ruel (1749–1818),87Marc-Antoine Parseval (1755–1836),88or Jean
Bap-tiste Plessis,89 may have been among the members of this group at one
time or another.90
• The third group was the largest and was in charge of the interpolation; probable members of this group were Jean Baptiste Letellier, Jean Désiré Guyétant, Bridanne, Pierre Antoine Jannin, Alexandre, Ange Christophe Gabaille (born ca. 1771),91 Thomas Robert Philippe Louis
Gineste (born ca. 1768), René Bulton, Pierre Mamet (born ca. 1774),
80Chompré wrote several books on mathematics and physics, and translated English
and Italian works into French. He probably started to work at the Cadastre in Vendémi-aire III.(A.N. F1bI44)
81[Garnier (1826), p. 118]
82[Michaud (1839), pp. 260–261] Guillard was professor of mathematics and published
in particular a Traité élémentaire d’Arithmétique décimale in 1802, as well as a new edition of Bezout’s Cours de mathématiques.
83Garnier published a number of books and was professor at the École Polytechnique.
He was chief of the geometrical section of the cadastre until 1797. Mascart wrote that Garnier worked at the Cadastre until 1794, but it is not correct, as testified by the payment summaries [Mascart (1919), p. 562].
84Plauzoles published a table of logarithms in 1809 [de Plauzoles (1809)].
85Together with Agustín de Betancourt, Lanz developed Hachette’s classification of
mechanisms. In 1808, they published the Essai sur la composition des machines.
86Among his many activities, Halma published the first French translation of Ptolemy’s
Almagest, based on the original Greek text.
87Barruel wrote several books on physics and was among the first professors at the École
Polytechnique.
88Parseval is most famous for what became known as “Parseval’s theorem,” first
pub-lished (but not proven) in 1799.
89Plessis was ingénieur-géographe and later author of cartographic tables. He is
men-tioned in Puissant’s Traité de topographie, 1807, and presumably gave his name to the Plessis ellipsoid, which was the standard ellipsoid used in France in 1817.
90[Bret (1991), p. 123], [Gillispie (2004), p. 483] In 1822, another anonymous author
named Garnier (then professor at the university of Gand), Legendre, Chompré, Plessis (then capitaine in the corps des ingénieurs géographes), Haros, Théveneau, Plauzoles (who died as deputy-chief of the new cadastre), “Langlais” (former professor at the École royale militaire in Paris, and since employed at the Bureau des longitudes), as those who may all have been part of this second group [Anonymous (1822)].
Hervet, Saget (père), La Bussierre, Jean Baptiste André Vibert, Hu-maird, Étienne Antoine François Baudouin (born ca. 1768), Louis Saget (fils), Mazerat, Marc Antoine Parisot, Henry, Leprestre, Pierre Simon Pigeou,92 and a few others.93 These computers had only to perform
additions and subtractions, and put the results on pages submitted to them by the second group. Some of the names appear in the tables.94
There is some uncertainty regarding the actual number of computers. For instance, in 1801, Prony wrote that there were about sixty or eighty computers,95 but in 1832, he wrote that there had been between 150 and
1795) in which he requests that a number of employees of the Bureau du cadastre not be requisitioned for the army.(A.N. F1bI44)
92Probably Pierre-Simon Pigeou (1765 Reims–1812 Trèves), ingénieur-géographe, who
worked with Jean Joseph Tranchot in Corsica and then on the left bank of the Rhine (see [Berthaut (1902), p. 315] and Michel Desbrière, “Les travaux dirigés par Jean Jo-seph Tranchot sur la rive gauche du Rhin, 1801–1814,” Bulletin du Comité Français de Cartographie, number 191, March 2007, pp. 13–24).
93According to Dupin who seems to have been the first to mention it in 1824, and who
was a friend of Prony, some members of the third group were former hairdressers who had been made jobless during the Revolution as a consequence of the change of fash-ion [Dupin (1825), p. 173], [Grattan-Guinness (1990b), p. 179]. Walckenaer, on the other hand, puts this assertion in doubt [Walckenaer (1940)], but then cites another anecdote by Dupin whom he considers trustworthy. Walckenaer’s doubts can therefore safely be ignored. It should also be observed that in the same article, Walckenaer wrote that the manuscript of the tables at the Observatoire was the original one and the one at the Institut its copy, when the truth is that these manuscripts are at the same level. None is a copy of the other. For another critical appraisal of Walckenaer’s text, see p. 35 of Arthur Birembaut, “Les deux déterminations de l’unité de masse du système métrique,” Revue d’histoire des sciences et de leurs applications, 1959, volume 12, issue 1, pp. 25–54. Prony seems never to have mentioned hairdressers, but he wrote in 1824 that several of the computers sought and found a kind of safe haven, one that political circumstances made them necessary [Riche de Prony (1824), pp. 36–37]. Prony read this notice on 7 June 1824 at the Academy of Sciences, of which Dupin was a member, and Dupin’s words are from a lecture given in November of the same year. It is tempting to link the two. The “hair-dressers” were popularized by Grattan-Guinness’ article [Grattan-Guinness (1990a)], but in our opinion Grattan-Guinness gave too much importance to a detail, as if all computers were from that trade. Perhaps there were only two or three of them. It is unfortunate that other authors have amplified this idea.
94Detailed lists of employees of the Cadastre starting in Vendémiaire III
(September-October 1794) are available at the Archives Nationales. These lists include the salary, and, for some of them, the section of the Cadastre to which they were belonging.(A.N. F1bI44) Concerning the rate of calculations, it is interesting to mention a letter by Louis
Saget (fils) to Prony, dated 17 Fructidor III (3 September 1795), who asked for a raise, claiming to compute 200 logarithms per day, and to be one of the best computers (A.N. F142146). He wrote that he earns 2600 francs, whereas the other computers earn 3400
francs. Prony decided to give him 3000 francs.
1.4. HISTORY OF THE TABLES 27 200.96,97,98,99,100
96[Riche de Prony (1832), pp. 67–68] These figures seem widely exaggerated, and at
any one time, there were probably a lot less computers. The number of computers of the tables was probably never greater than 20 or 25, and Lalande even put them at 15 [de Lalande (1795)]. In Vendémiaire III (September-October 1794), for instance, when the table of sines was finished, and presumably work going on with the other tables, the Cadastre was comprised of 44 employees, namely Prony (1st class), Garnier, Plauzoles, and Antoine de Chézy (director of the École nationale des ponts et chaussées in 1797–1798, see [Bradley (1994), p. 235], [Brunot and Coquand (1982), p. 30]) (all 2nd class), Lanz, Jean Baptiste Plessis, Antoine Joseph Reboul, Barruel, Langlet, Nicolas Antoine Guil-lard, Portail, Lecuit, Blanchet, Dujardin, Denayer (probably Jean Isidore, born ca. 1768), Guignet, Bosio (probably the painter Jean-François Bosio (1764–1827)), Jean Jacques Le Queu (1757–1826, famous for his architectural drawings), Ducamp, Gelée, Duprat, Charles Haros, Rousseaux, Jean Baptiste Letellier, Jean Désiré Guyétant, François Hubert Tinet, Gabaille, Pierre Antoine Jannin, Bridanne, Kitzinger (3rd class), Marie, Bouquet, Pounnery, Berny, Balzac, Humaird, Berthier, Bertrand (4th class), Saget, Bruyant (5th class), Butel, François (6th class), Naslot, Leurson (7th class). Prony had a salary of 6000 livres a year, the salary of the 2nd class was ranging from 5000 to 4500 livres a year, the 3rd class from 4000 to 3200, the 4th class from 2760 to 2500, the 5th class from 2200 to 2000, the 6th class from 1800 to 1500, and the 7th class had 1400 livres per year.(A.N. F1bI44)
97A summary of Frimaire IV (November-December 1795) shows that there were a total
of 63 employees (including Prony) and that they were grouped in two divisions, the first of geographers headed by Renard and Chézy, the second of computers, headed by Garnier (chef) and Plauzoles (sous-chef). Employees of the first division were in turn grouped in three “brigades”: 1st (Éloi Lafeuillade and Langlet fils), 2nd (J. F. L. L’Evesque, François Benazet, Antoine Charles Boucher, Louis-Marie Charpentier, Pigeou, Henry, Pierre Eus-tache LeDuc (ca. 1772–1799 Cairo), LePrestre), and 3rd (Bruno Plagniol (b. ca. 1773), Jean-Pierre Faurie, Jean Junie, Boullée, Louis-Jacques Bourgeois, P. Cadillion, Ferat). A number of these first geographers are also given by Bret, in the list of geographers hired in the year II [Bret (2009), p. 145–147]. In this first division, there were also “Géographes dessinateurs” (geographers drawers) (Blanchet, Dujardin, Benayev, Bouquet) and two em-ployees responsible for making and computing tables (Charles Michel Gelée, Jean Baptiste Bertrand, the latter perhaps the Bertrand from [Baudouin-Matuszek (1997)]). The second division was divided into sections. The first section were the “mathématiciens.” There were nine of them, the first four working on the Connaissance des tems (Lanz, Jean Baptiste Marion, Nicolas Antoine Guillard and Dufort), and the others on the Tables du cadastre (Langlet père, Reboul, Jacques Joseph Grou, Theveneau, Charles Haros). Fi-nally, this division had a second section made of 18 computers and verifiers: Jean Baptiste Letellier, Jean Désiré Guyétant, Bridanne, Pierre Antoine Jannin, Alexandre, Gabaille, Gineste, René Bulton, Pierre Mamet, Hervet, Saget (père), La Bussierre, Jean Baptiste André Vibert, Humaird, Antoine Baudouin, Louis Saget (fils), Mazerat and Marc Antoine Parisot. As can be observed by the names appearing in the tables themselves, some of the computers of the tables were part of the first division, at least at that time. In Nivôse V (December 1796-January 1797), 23 employees were explicitely assigned to the Tables du cadastre.(A.N. F1bI44)
98One may question whether others have been working on the tables, not registered on
1.4.2
Computing (1793–1796)
After Prony received the commission to build the tables, and came up with a division of the calculators in three sections, it seems that things went very quickly. It is very likely that the tables were computed in order, and not all at the same time, which would have been possible, but would not have brought any advantages. The table of sines was computed first, starting in 1793. It was probably completed in Fructidor II (August-September 1794).101
been found in the salary summaries. Second, one of the employees (Louis Saget) wrote about his work as a computer of logarithms, and this rules out that the employees listed were not the computers. The figures given by Prony seem therefore wrong, although we don’t have a good explanation why this is so.
99The exaggerated number of computers, as well as the great size and number of
manuscript volumes, and other difficulties, seem to have led to superlative descriptions. For instance, Grattan-Guinness wrote of Prony directing “an enormous team” and also spoke of the “gigantic” tables [Grattan-Guinness (1993)]. Prony, however, is probably the first to blame for these exaggerations.
100A later account was also given by the novelist Maria Edgeworth (1767–1849). She
was visiting France in 1820 and met Prony. In a letter dated 4 June 1820, she wrote the following account: “During Buonaparte’s Spanish War he employed Prony to make logarithm, astronomical, and nautical tables on a magnificent scale. Prony found that to execute what was required would take him and all the philosophers of France a hundred and fifty years. He was very unhappy, having to do with a despot who would have his will executed, when the first volume of Smith’s Wealth of Nations fell into his hands. He opened on the division of Labour, our favourite pin-making: ‘Ha, ha ! voilà mon affaire ; je ferai mes calcules (sic) comme on fait des épingles !’ And he divided the labour among two hundred men, who knew no more than the simple rules of arithmetic, whom he assembled in one large building, and these men-machines worked on, and the tables are now complete.” [Edgeworth (1894), vol. 1, p. 291] This account is interesting, because it contains some errors. For instance, although there was a French-Spanish war between 1793 and 1795 (the so-called “War of the Pyrenees”), Bonaparte was not involved in it. Perhaps Prony mentioned a war with Spain, and Edgeworth made a confusion with the Peninsula War, opposing France and Spain in 1808. Bonaparte also had nothing to do with the Tables du cadastre. In view of these errors, one has to guess that they are both the results of Edgeworth’s confusion, and probably of exaggerations by Prony. Perhaps Edgeworth was subjugated by Prony of whom she wrote that he “is enough without any other person to keep the most active mind in conversation of all sorts, scientific, literary, humorous.” [Edgeworth (1894), vol. 1, p. 289] Two weeks before, on May 20, she had written “Prony, with his hair nearly in my plate, was telling me most entertaining anecdotes of Buonaparte.”
101Report dated Fructidor II, A.N. F142146. We can easily obtain some idea on the
efficiency of the computations. According to Lalande, 600 logarithms were computed daily, and we also know that a good computer could compute 200 logarithms in a day. If we assume an average of 100 correct logarithms per computer in a day, then computing 400000 logarithms or sines, twice, represents about 800000
100 = 8000 man-days of work. If
these computations are done in 500 days, about8000
500 = 16 computers are necessary. It is of
1.4. HISTORY OF THE TABLES 29 In order to speed up the work, forms had been used for the sines, and the report of Fructidor II writes that the computations would then turn to the logarithms of numbers, and that 1100 sheets with forms should be made according to an annexed model.102 But based on the making of the abridged
table in 1795, we think that it is more likely that the logarithms of sines and tangents were then started, as well as possibly the beginning of the logarithms of numbers, since the logarithms of the numbers 1 to 5000 were needed for the first logarithms of sines and tangents.103
Composition must have started immediately, after completion of the sines, for Lalande writes that the printing of the table of sines had started in 1794 with 22 decimals, and with differences up to the fifth order.
Gillispie estimated that each calculator made 900 to 1000 additions or subtractions in the day’s work, which is consistent with about 200 logarithm values.104
All the work was done twice, but this obviously mainly applied to the computations. The first group was probably not made of two sections, al-though in some (but perhaps not all) cases different formulæ were designed, and the fundamental values may have been computed twice. The second and third groups were certainly divided in two sections which were in charge of a similar and independent work.
In order to speed up the making of the cadastre, the decree of the Comité de Salut Public (Committee of Public Safety)105 of 22 Floréal II (11 May
1794) ordered that eight computers be added to the geometric division of the cadastre.106 A few months later, and after the printing of the first tables,
on 4 Pluviôse III (23 January 1795), it was decided to set up a Bureau des correcteurs107 in order to check for errors in the printed tables and therefore
speed up the making of the tables. Eight persons were hired. These correctors were apparently first assigned to the computation of the reduced tables, then
we often do not exactly know how many computers were involved, and what methods and shortcuts were used.
102Given that 190000 logarithms had to be computed, and that these logarithms would
fill 3800 pages, we find that 950 sheets were necessary. A slightly larger number of sheets were probably printed in case of anticipated errors. A similar amount of pages was needed for the logarithms of sines and tangents.
103However, it remains to be seeen whether the logarithms of numbers used in these
sections are those of the Tables du cadastre, or those of Briggs or another source.
104[Gillispie (2004), p. 484]
105The Comité de Salut Public was the executive government in France during the Reign
of Terror (27 June 1793—27 July 1794).
106A.N. F171238
107On the planned organization of this Bureau, see a report from 12 Nivôse III (1 January
to the work on the main tables.108
A long report of 2 Thermidor II (20 July 1794) gave a detailed description of the projected tables.109 The sines would be computed to 25 places, and
printed to 22 places with five columns of differences, every 10000th of the quadrant. The logarithms of sines and tangents would be computed to 15 places and published to 12 places, every 100000th of the quadrant. The logarithms of numbers would be computed to 12 places from 1 to 200000. At that time, only the sines had been completed. The report also sketched the layout of the tables. The table of sines would have 100 pages, the logarithms of sines and tangents would have 500 pages (together), and the logarithms of numbers 400 pages. Although the report does not state it explicitely, this suggests that there would have been four columns of 100 logarithms of sines or tangents per page, and five columns of 100 logarithms of numbers per page, probably with first differences. We call this project, project 1.
The contract with Didot was based on this report110 and stated that
Didot would make a first printing of 500 copies, which had to be delivered 18 months later.111
Lalande was one of the first to describe the project in 1795. He wrote that Prony had fifteen computers trained by him, and that they were doing all computations twice. 600 results were obtained daily.112 He wrote that
108Some of the correctors were hired at the beginning of 1795. These correctors were
Bazin, Blondel, Pedon, Labussierre, Petit, Place, Sinquin, and Vernier. A letter from 29 Pluviôse III (17 February 1795) also suggested to replace Barruel, who left one of the positions to be professor of physics at the newly founded École Polytechnique, by Theveneau.(A.N. F142146)
109A.N. F171238
110See also Prony’s report from 1 Ventôse IV (20 February 1796) summarizing the
fi-nancial difficulties since the beginning of the contract.(A.N. F171238) The initial contract
was for 270000 livres, of which 50000 had to be payed right away, and the remaining part 15000 livres every month. Didot had to print 1000 pages in 500 copies.
111In 1825, a report by Bouvard, Prony and Arago stated that the initial aim was to
reduce the tables to 1200 pages, of which 500 had been composed.(A.N. F1713571) This,
however, is probably a misunderstanding going back to Prony, and this mistake has been repeated numerous times since. In 1801, Prony indeed wrote that the contract with Didot would have resulted in 1200 pages [Riche de Prony (1801)], but the contract does not explicitely mention this amount of plates.(A.N. F171238) Instead, the 500 composed pages
very likely correspond to project 3 which would have totalled about 2000 pages, whereas the 1200 pages seem to be an extrapolation of the initial project of 1000 pages, plus some introduction. When project 4 was set up in 1819, things became even more confuse, because the 1200 pages then meant only part of the initial project. (Didot to the Interior minister, 13 September 1822, A.N. F1713571) In 1819, Prony wrote erroneously that the
initial contract was for 1200 plates, each of which would have had 100 lines. (note dated 2 March 1819, Archives of the Académie des sciences, Prony file, also in PC: Ms. 1183)
1.4. HISTORY OF THE TABLES 31 the logarithms of sines and tangents would be published with 12 decimals and two columns of differences, the logarithms of the numbers up to 200000 with 12 decimals and two columns of differences, the logarithms of the first 10000 numbers with 25 decimals, as well as the logarithms of the ratios of sines and tangents to their arcs for the first 5000 one hundred thousands of the quadrant, with 12 decimals and two columns of differences.113
An undated description of the projected tables at the Archives Nationales almost totally agrees with Lalande’s description, except that the initial tar-get was to compute the first 10000 logarithms to 28 places.114 We call this
project, project 2. This project probably followed the report of 2 Thermi-dor II, and evolved into the actual computations, which we call project 3. It was probably towards the end of 1794 that the accuracy was reduced to 19 places. We have reconstructed project 2, as this is the one which is best specified.115
According to the description of the tables found in Callet’s tables of log-arithms,116 it seems that a table of tangents with 22 exact decimals and all
necessary differences for each centesimal degree was also planned, although the interpolation itself would not be carried out. This is consistent with the introductory volume of the tables, which has a section explaining how tangents could be computed.117
Moreover, on 6 Ventôse III (24 February 1795), Prony was asked to col-laborate with Lagrange and Laplace to make reduced tables of logarithms of sines and tangents for the students of the École Normale,118 and that these
by Hobert and Ideler, when the latter compared their 300 daily results with those of Prony. [Hobert and Ideler (1799), p. xxxiii]
113[de Lalande (1803), p. 743] 114A.N. F171238
115Interestingly, Edward Sang computed the logarithms of all numbers up to 20000 to 28
places. Sang’s aim was to compute a table of nine-place logarithms from 100000 to one mil-lion, an endeavour of which only a by-product and fragments were published [Sang (1871), Sang (1872a)]. See Craik [Craik (2003), p. 55] and Fletcher [Fletcher et al. (1962), p. 159].
116[Callet (1795), p. vi]
117The actual pivots are however nowhere to be found and have probably not been
computed.
118The École Normale de l’an III (École Normale “of year III”) was created in 1794
and had only a brief existence. The more than 1000 students of the École Normale were delegates from the various regions of France, and the purpose was to have them later in charge of organizing the education in the provinces. The professors of math-ematics were Lagrange and Laplace, and Monge was professor of descriptive geometry (see [de Laplace et al. (1992)] for details on their lessons). The first course was given on 1 Pluviôse III (20 January 1795) and the last on 30 Floréal III (19 May 1795). The school failed because of the heterogeneity of the students. On the École Normale de l’an III , see [Gillispie (2004), pp. 494–520] and [Dupuy (1895)]. On education reforms during the


![Table 2.1: An excerpt of the logarithms published by Legen- Legen-dre [LegenLegen-dre (1826), table V, page 260]](https://thumb-eu.123doks.com/thumbv2/123doknet/12795013.362636/69.892.189.768.173.893/table-excerpt-logarithms-published-legen-legen-legenlegen-table.webp)


