HAL Id: cea-01360364
https://hal-cea.archives-ouvertes.fr/cea-01360364
Preprint submitted on 5 Sep 2016
HAL is a multi-disciplinary open access
archive for the deposit and dissemination of
sci-entific research documents, whether they are
pub-lished or not. The documents may come from
teaching and research institutions in France or
abroad, or from public or private research centers.
L’archive ouverte pluridisciplinaire HAL, est
destinée au dépôt et à la diffusion de documents
scientifiques de niveau recherche, publiés ou non,
émanant des établissements d’enseignement et de
recherche français ou étrangers, des laboratoires
publics ou privés.
Re-examining the significance of the 750 GeV diphoton
excess at ATLAS
Bradley J. Kavanagh
To cite this version:
Bradley J. Kavanagh. Re-examining the significance of the 750 GeV diphoton excess at ATLAS. 2016.
�cea-01360364�
Bradley J. Kavanagh∗
LPTHE, CNRS, UMR 7589, 4 Place Jussieu, F-75252, Paris, France and
Institut de physique th´eorique, Universit´e Paris Saclay, CNRS, CEA, F-91191 Gif-sur-Yvette, France The excess seen in the diphoton channel at around 750 GeV by both ATLAS and CMS has caused a great deal of excitement in the particle physics community. However, there has recently been much discussion about uncertainties in the significance of the peak seen by the ATLAS experiment. In this note, we aim to estimate this significance using a range of possible parametrisations for the smooth diphoton background. We obtain a local significance close to that reported by ATLAS and further demonstrate that the significance of the excess is not substantially reduced when more complicated background functions are considered. In particular, the background contribution is strongly constrained by the small numbers of events at large diphoton invariant mass. Future data releases will improve constraints on the diphoton background, as well as clarifying the true nature of the 750 GeV excess.
I. INTRODUCTION
In the first results from Run-II of the LHC, both the ATLAS and CMS collaborations reported an excess above the expected background in the diphoton channel [1, 2] at a diphoton invariant mass of mγγ ∼ 750 GeV.
The local significance of this excess was reported as 3.9σ (2.3σ global) by ATLAS and 2.6σ (1.2σ global) by CMS. The possibility that this excess could be due to a new bosonic particle has caused a great deal of excitement in the particle physics community and the list of papers ex-ploring the implications for New Physics is of course too long to mention.
Since the announcement of these results [3], a number of authors have performed fits to the Run-II diphoton data from a theory perspective in order to estimate the mass, width and cross section times branching ratio of a possible new particle (see e.g. Ref. [4]). However, these analyses typically assume a fixed form for the diphoton background whose parameters are not included in the fits. This procedure is not strictly correct, as parameter values extracted from the data should take into account uncertainties in the background. A full likelihood analy-sis of both the ATLAS and CMS binned diphoton data was performed in Ref. [5], assuming the same background models used by the respective collaborations. The lo-cal significances reported therein are in broad agreement with those reported by ATLAS and CMS.
However, a recent paper by Davis et al. [6] explored the possibility of allowing more freedom in the modelling of the ATLAS continuum diphoton background. Their con-clusion was that the background could be fit by a number of different functional forms and that some of these forms lead to a lower significance for the diphoton excess than that reported by ATLAS, perhaps as low as 2.0σ. Moti-vated by this discrepancy between the results of the AT-LAS collaboration and those of Davis et al., we perform an independent analysis of the binned ATLAS diphoton
∗bradley.kavanagh@lpthe.jussieu.fr
invariant mass spectrum to estimate the significance of the excess under different background assumptions. In particular, we perform a Poissonian likelihood fit over 40 bins in the diphoton invariant mass mγγ, making this
analysis distinct from that of Davis et al. The code used to perform this analysis is publicly available online [7].
The intention of this note is not to improve upon the ATLAS analysis or to report definitive values for the significance of the 750 GeV excess. Indeed, this is not possible with the information which is publicly available. Instead, we aim to explore the robustness of the excess to variations in background fitting, as well as to clarify certain aspects of the fits performed by ATLAS.
The different functional forms we consider for the diphoton background are given in Eq. 2, while the local significances we obtain for the 750 GeV diphoton excess (using each functional form) are given in Table III. We describe in detail the fitting procedure used in this work in Sec. II, followed by the results of background-only and signal + background fits in Sec. III and Sec. IV. Finally, in Sec. V we discuss the implications of these results for the significance of the 750 GeV excess.
II. FITTING PROCEDURE
Within a frequentist framework, the significance of a possible excess in the diphoton spectrum can be esti-mated by calculating the maximum likelihood obtained assuming that only backgrounds contribute to the ob-served events (background-only) and that obtained as-suming that both signal and background have a contri-bution to the observed event rate (signal + background). By comparing the maximum likelihood obtained under these two assumptions, we can then calculate the signif-icance of a possible signal in the data.
The likelihood L(θ) is simply the probability of obtain-ing the observed data assumobtain-ing a particular set of param-eters θ. For binned data, this has the Poisson form:
2 L(θ) = nbins Y i=1 (Ni e)N i o Ni o! exp(−Nei) , (1) where Ni
e = Nei(θ) is the expected number of events in
the ith bin (for a given set of parameters under the
back-ground or signal + backback-ground hypothesis) and Ni ois the
observed number of events in the ith bin. In particular,
we do not include any additional terms in the likelihood due to uncertainties on the diphoton invariant mass res-olution (as in Ref. [1]).
We use a total of nbins = 40 bins in the mγγ
invari-ant mass, each with width 40 GeV, spanning the range mγγ ∈ [150, 1750] GeV. We obtain the number of events
observed in each bin from Ref. [1] (by digitising Fig. 1 therein using a publicly available plot digitiser [8]). This procedure may introduce some digitisation error into the analysis, particularly for bins which contain a large num-ber of events. However, we have explicitly checked the impact of digitisation errors on our results and, as de-scribed in Sec. V, these do not affect the conclusions we report.
The expected number of background events is obtained by integrating the background event distribution over each bin in mγγ, for a given choice of functional form
and for a given set of background parameters θb. In
Ref. [1], the ATLAS collaboration discuss a set of pos-sible empirical functions for the continuum background. These have been adapted from functions used in multi-jet searches for New Physics [9] and have been validated against both Monte Carlo and data samples. In Ref. [6], Davis et al. introduced another possible parameterisation for the continuum diphoton background (also validated with a Monte Carlo study) which we discuss further in Sec. V. In this work, however, we focus on those back-ground functions used by the ATLAS collaboration, given explicitly by fk(x) = N (1 − x1/3)bx Pk j=0aj(log x)j (2) where x = mγγ/ √
s and f (x) is the differential distribu-tion of expected background events (in units of events/40 GeV).1We will consider k = 0, 1, 2 in this work, for which
the parameters b, a0, a1 and a2 determine the shape of
the background and are allowed to vary in the analysis. The parameter N which controls the overall normalisa-tion of the background is typically included when using this class of functions [9]. While it is not explicitly de-scribed in Ref. [1], the free normalisation parameter has been included in previous analyses of the diphoton chan-nel [10] and its inclusion will allow us to better match the results reported by ATLAS. In light of this, we will assume that ATLAS allow for a free normalisation of the
1 Note that we use the notation log for the natural logarithm log
e.
Parameter Prior range log10N [-25, 25]
b, a0, a1, a2 [-25, 25]
mγγ [700, 800] GeV
α [1, 10] % NS [0.01, 100]
TABLE I. Prior ranges for the background and signal param-eters used in this analysis. In each case, the prior is constant over the specified range. We note that because we use MCMC only to find the maximum likelihood point, the exact form of the prior does not affect the results presented.
background in their analysis, though for comparison we will consider cases where N is set to 1 (‘fixed-N ’) as well as where N is allowed to vary (‘free-N ’).
The expected number of signal events coming from a possible new resonance near mγγ ∼ 750 GeV is obtained
using either the narrow width approximation (NWA) or by allowing the width of the resonance to vary freely (free-width). Under the NWA, the signal is modelled as a Gaussian centred on mγγ= mB with standard deviation
σ given by the diphoton invariant mass resolution. This resolution is taken to increase linearly from σ = 2 GeV at mγγ = 200 GeV to σ = 13 GeV at mγγ = 2 TeV [1],
giving a value of around σ = 5.4 GeV near the putative resonance at 750 GeV. This is a rather crude approxima-tion to the double-sided Crystal Ball funcapproxima-tion (DCSB) used by the ATLAS collaboration in their NWA anal-ysis. However, given that the bin widths used in this analysis are much larger than the mass resolution, we do not expect the precise shape of the narrow resonance to strongly affect our results. Indeed, we are still able to recover a significance close to that reported in Ref. [1]. The signal is normalised so as to contribute a total of NS events, meaning that for the NWA we have two free
parameters describing the signal: θs= (mB, NS).
In the free-width analysis, we model the signal as a Breit-Wigner distribution with width Γ = αmB. We do
not include the effects of finite diphoton invariant mass resolution in the free-width analysis. However, as in the NWA analysis, we can still recover a significance close to that reported in Ref. [1]. In the free-width analysis, we have three free parameters: θs= (mB, NS, α).
In order to explore the signal and background param-eter spaces, we use the publicly available Markov Chain Monte Carlo (MCMC) software emcee [11], which uses Affine Invariant MCMC Ensemble sampling [12]. We perform at least 20000 likelihood evaluations for each fit. The prior ranges for the parameters used in this work are listed in Table I, though we emphasise that emcee was only used to find the maximum likelihood points and therefore that the precise form of the priors should have little impact on the analysis.
We quantify the significance of a possible excess by constructing the test statistic q0 [13]:
q0= −2 log L(NS = 0, ˆ ˆ θb) L( ˆNS, mB, α, ˆθb) ˆ NS ≥ 0 0 NˆS < 0 , (3)
whereˆˆθbis the set of background parameters which
max-imise the likelihood under the background-only hypoth-esis and ˆθ is the set of parameters which maximise the full likelihood under the signal + background hypothe-sis for a given value of mB and (if we are considering
the free-width analysis) α. Here, we restrict to positive parameter values for the number of signal events, so the best fit value ˆNS will always be positive.
The local p-value for the background-only hypothesis is obtained from the observed value of the test statistic q0,obsusing,
p0=
Z ∞
q0,obs
f (q0) dq0 (4)
where f (q0) is the probability density function of q0
un-der the background-only hypothesis. According to Wilks’ Theorem [14], the log-likelihood ratio (appearing in the top line of Eq. 3) is asymptotically χ2
mdistributed if the
background-only hypothesis is correct. The number of degrees of freedom m is given by the difference between the number of parameters in the background-only and the signal + background hypotheses. For a fixed value of mB (and α), there is only one free parameter (the
num-ber of signal events NS) so we have m = 1. As detailed
in Ref. [13], in this case q0 follows a ‘half chi-square’
dis-tribution and the local signal significance is simply given by Z =√q0,obs. The maximum value of the local
signif-icance can then be obtained by maximising over mB (or
mB and α in the free-width analysis).
III. BACKGROUND-ONLY FITS
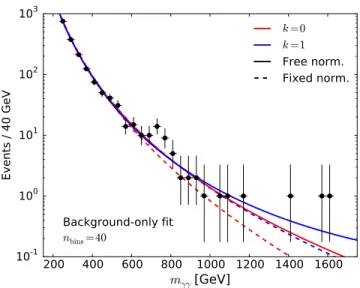
We begin by examining in Fig. 1 the fits to the ATLAS data (black points) which are obtained when no signal contribution is included. We show the best fit (maxi-mum likelihood) background curves for k = 0 (red) and k = 1 (blue), both using a free normalisation N (solid lines) and when setting N = 1 (dashed lines). We note that the error bars on the data points are for illustrative purposes and denote the 1σ confidence intervals on the mean number of expected events in each bin given the number of observed events.
As pointed out by Davis et al. [6], the k = 0 fixed-normalisation background curve (dashed red) appears to underestimate the background above mγγ > 1000 GeV.
It is perhaps not surprising that this parametrisation is not able to give a good fit to the background over the en-tire invariant mass range, given that it includes only two
200 400 600 800 1000 1200 1400 1600
m
γγ[GeV]
10
-110
010
110
210
3Events / 40 GeV
Background-only fit
n
bins=40k
=0k
=1Free norm.
Fixed norm.
FIG. 1. Background-only fits to the ATLAS diphoton in-variant mass spectrum. The observed numbers of events in each bin are shown as black circles, while the curves show the background distribution for the k = 0 (red) and k = 1 (blue) empirical functions defined in Eq. 2. We show background fits with both free normalisation (solid) and with fixed normali-sation (dashed). The background parameters used are those which maximise the likelihood for the background-only hy-pothesis. Note that the k = 2 background fits are not shown as they lie close to the k = 1, free normalisation curve (solid blue).
free parameter. When adding an additional parameter to the background function, either using k = 0 with free normalisation (solid red) or k = 1 with fixed normalisa-tion (dashed blue), the fits tend to prefer a higher back-ground at high mass in order to alleviate this possible tension. The background contribution is also increased in the region of the 750 GeV excess, suggesting that the significance of the peak will be reduced when including these additional parameters.
We note that both the k = 0, free-N background and the k = 1, fixed-N background appear to match closely the background-only fit reported in Fig. 1 of Ref. [1]. The ATLAS collaboration state that they use the k = 0 background function in Ref. [1] and we therefore assume that they also fit the normalisation N of the background, in order to match the results shown here in Fig. 1. It therefore appears then that the background curve used by ATLAS fits the data well, apart from in the region of the 750 GeV excess and above mγγ ∼ 1600 GeV (where
ATLAS report an excess with 2.8σ local significance). Following Ref. [6], we have calculated the Bayesian In-formation Crierion (BIC) [15], a model selection crite-rion which be used to compare the fit to data obtained using different models, penalising models which have ad-ditional free parameters. The Akaike Information Cri-terion (AIC) [16] is a related model selection criCri-terion, though in general the BIC penalises the addition of ex-tra parameters more strongly. The BIC is defined as:
4
Background function Np log ˆL BIC
Fixed normalisation k = 0 2 -87.9 183.2 k = 1 3 -82.4 175.9 k = 2 4 -80.4 175.6 Free normalisation k = 0† 3 -81.9 174.9 k = 1 4 -80.9 176.6 k = 2 5 -80.0 178.4
TABLE II. Number of parameters Np, maximum
log-likelihood log ˆL and Bayesian Information Criterion (BIC) ob-tained in background-only fits to the ATLAS diphoton invari-ant mass spectrum using the background functions in Eq. 2. The BIC is defined in Eq. 5. The background function used by the ATLAS collaboration in Ref. [1] is marked with a dagger.
BIC = −2 log ˆL + Nplog nbins, (5)
where ˆL is the maximum likelihood and Npis the number
of free parameters in the model. The lower the BIC, the stronger the evidence for the model in question. A difference of around 2 in the BIC between two different models is considered positive evidence that the model with the higher BIC should be rejected in favour of the one with the lower. A difference in BIC greater than 6 is considered strong evidence [17].
We show in Table II the maximum log-likelihood and the value of the BIC obtained in background-only fits using the three parametrisations k = 0, 1, 2 with both free and fixed normalisation. We find that the k = 0, fixed-N background gives the largest BIC, indicating that there is strong evidence to reject this background in favour of the alternative parametrisations. Note that the remaining BIC values are all rather close in value, indicating that there should be no strong preference amongst them. This matches the conclusion of the ATLAS collaboration [1], which used both a Fisher test and a ‘spurious signal’ analysis2 to determine that no background models more
complex than k = 0, free-N were necessary to fit the data.
We finally note that increasing the number of param-eters further, with the k = 2 functional form, does not substantially improve the fits, as reflected by the slightly larger BIC value for k = 2, free-N . We do not show these functional forms in Fig. 1, because they lie very close to the solid blue k = 1, free-N curve. The smooth background at high mγγ cannot be increased further due
to the tension with a number of empty bins. It there-fore seems difficult to further increase the background
2 The ‘spurious signal’ analysis requires that (for a given functional
form for the background) the bias on the fitted signal yield is significantly smaller than the statistical uncertainty on the signal yield, as determined from Monte Carlo samples. See Refs. [1, 10] for further details.
200 400 600 800 1000 1200 1400 1600
m
γγ[GeV]
10
-110
010
110
210
3Events / 40 GeV
Signal+Background fit
n
bins=40k
=0k
=1Free norm.
Fixed norm.
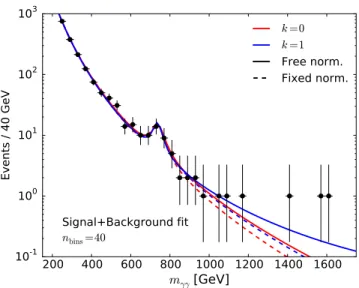
FIG. 2. Signal + background fits to the ATLAS diphoton invariant mass spectrum, allowing the width of the resonance near 750 GeV to vary freely. The colour scheme matches that of Fig. 1. The parameters used are those which maximise the likelihood for the signal + background hypothesis. As in Fig. 1, we do not show the fits for k = 2, as these lie close to the k = 1, free normalisation curve (solid blue).
contribution to the rate at either mγγ ∼ 750 GeV or
mγγ ∼ 1600 GeV by going to more complex smooth
background parametrisations.
IV. SIGNAL + BACKGROUND FITS
We now examine the signal + background fits to the ATLAS diphoton spectrum and determine the signifi-cance of the diphoton excess under different assumptions for the background. In Fig. 2, we show the maximum likelihood fits to the data for the signal + background hypothesis using the free-width analysis for the possible new resonance near 750 GeV. As before, we include fits for k = 0, 1 (see Eq. 2) using both free and fixed normal-isation, with the colour scheme matching that of Fig. 1.
Adding a new resonance near 750 GeV clearly allows the data to be better fit with all background parametri-sations. As in the background-only fits, the k = 0, free-N and k = 1, fixed-free-N backgrounds produce similar re-sults. In all cases, the expected rate at high mγγ is
re-duced compared with the background-only fits. With the 750 GeV excess saturated by the signal contribution, the background above 1000 GeV can be reduced to better fit the large number of empty bins.
In Table III, we report the maximum local significance of the ATLAS 750 GeV excess obtained in this work, us-ing each of the functional forms introduced in Eq. 2. For reference, the significances reported by ATLAS in Ref. [1] are 3.6σ (NWA) and 3.9σ (free-width). The significances obtained in this work, using the same background func-tion used by ATLAS, are 3.4σ (NWA) and 3.6σ
(free-Background function NWA Free-width Fixed normalisation k = 0 4.2σ 4.9σ k = 1 3.4σ 3.7σ k = 2 3.4σ 3.7σ Free normalisation k = 0† 3.4σ 3.6σ k = 1 3.5σ 3.8σ k = 2 3.4σ 3.6σ ATLAS reported 3.6σ 3.9σ
TABLE III. Estimated local significance of the ATLAS 750 GeV diphoton excess obtained in this work using each of the background functions described in Eq. 2, assuming a freely varying resonance width (free-width) and under the narrow width approximation (NWA). The background function used by the ATLAS collaboration in Ref. [1] is marked with a dag-ger. For comparison, we also give the local significance re-ported by the ATLAS collaboration.
width). We discuss in Sec. V the possible sources of this small discrepancy.
For the simplest background function (k = 0, fixed-N ) the significance of the excess is significantly larger.3
How-ever, in Sec. III, we found (in agreement with ATLAS) that this simple function fits the background significantly worse than the more complex ones. The remaining back-ground parametrisations lead to very similar significances compared with the k = 0, free-N function. Thus, the sig-nificance of the excess appears to be robust against the choice of background.
V. DISCUSSION
As initially pointed out by Davis et al. [6], the signif-icance of the 750 GeV diphoton excess reported by AT-LAS is higher when the background is fit with the k = 0, fixed-normalisation parametrisation and is reduced when an extra parameter is added to the background fit. How-ever, this appears to be consistent with the results re-ported by ATLAS. Assuming that the overall normalisa-tion of the k = 0 background is also included in the fit, we recover the background-only fit presented in Ref. [1] and obtain significances close to (but slightly smaller than) those reported by the ATLAS collaboration.
We also note that the data show no preference for an increase in complexity of the background function (as demonstrated by the Bayesian Information Criterion study in Table II). Furthermore, we find that adding ad-ditional parameters to the background fit does not have any impact on the significance of the excess. This is be-cause of a number of bins above mγγ ∼ 1100 GeV which
3 We note that we find an even larger significance using this
back-ground than that reported by Davis et al. [6], though given the different statistical approaches, this is perhaps not surprising.
see no events. Any smooth background is constrained not to overshoot these bins.
Davis et al. introduce a different possible parametri-sation for the background (which was also validated by a Monte Carlo study) and find that the significance of the excess is further reduced with respect to the k = 1, fixed-N case. However, the empty bins at high mγγ were
not included in that analysis, leading to a background fit which overestimates the high mγγ event rate.
In-deed, using the Davis et al. background parametrisation (with free normalisation) in this analysis gives a local significance of 3.8σ for a free-width resonance. This does not discount the possibility that exploring a wider range of possible background functions may impact the signifi-cance of the 750 GeV excess, but the correct constraints from the entire range of mγγ should be taken into
ac-count.
It is of course necessary to point out that the signif-icances we report are only estimates and care must be taken when comparing with the official ATLAS analy-sis. In particular, the results reported by ATLAS use the full unbinned data set, while we consider here only binned data. This has the largest impact on our NWA results. The diphoton invariant mass resolution (∼5.4 GeV) is substantially smaller than the bin width (40 GeV), meaning that a narrow resonance cannot be re-solved in the binned data. The fitted signal resonance is effectively widened by integration over a single bin, im-proving the fit to the relatively wide observed excess (∼3 bins). This means that the significance we obtain for the NWA is larger than it would be using the unbinned data. However, the ATLAS analysis includes an additional nui-sance parameter for the invariant mass resolution, which we have omitted. This mass resolution parameter can be increased to improve the fit to the data, leading to a significance similar to that obtained here.
We also emphasise that the binned data was obtained by digitising the results released in Ref. [1]. However, we have investigated the possible impact of digitisation error on our analysis. In order to do this, we added random noise to the first 10 bins in mγγ (distributed
uniformly between −3% and +3% of the number of events in each bin) in order to simulate digitisation errors.4 Ten
such ‘randomised’ datasets were generated and the peak significance for each was calculated assuming the k = 0, free-N background. The resulting local significances were in the range:
NWA: 3.3σ–3.5σ
Free-width: 3.5σ–3.8σ . (6)
4At larger values of m
γγ the small number of events means that
integer numbers of events can accurately be read off the figure. However at small values of mγγ digitisation error could induce
6
These tests indicate that digitisation could have induced an error of order 0.2σ in the analysis, and may also ex-plain some of the discrepancy between our results and those reported by ATLAS.
We further note that in this work we have used only approximate functional forms for the signal distributions and while we approximately recover the significances re-ported by the ATLAS collaboration, our analysis does not capture many of the important details involved in fit-ting the signal and background (for example, uncertain-ties in the diphoton mass reconstruction). Furthermore, we have taken an empirical approach and allowed a wide range of values for the background parameters N , b, a0,
a1, a2. This may not accurately reflect the background
distributions seen in MCMC and data samples. How-ever, restricting the possible ranges of the background parameters is likely only to increase the significance of a possible excess.
In spite of these simplifications, the broad message of this note still holds. The significance of the 750 GeV excess does not appear to be strongly affected by differ-ent choices of smooth background model. While more complicated background distributions could be explored
to ensure the robustness of the significance reported by ATLAS, these are likely to be highly constrained by the lack of observed events at high diphoton invariant mass.
ACKNOWLEDGMENTS
The author would like to thank the authors of Ref. [6] for stimulating and helpful discussions. The help of Adam Falkowski was invaluable in the completion of this work and the preparation of this manuscript. The or-ganisers and participants of the Magic Journal Club are also thanked for interesting (if long) discussions on the 750 GeV excess. The author is supported by the John Templeton Foundation Grant 48222 and by the European Research Council (Erc) under the EU Seventh Frame-work Programme (FP7/2007-2013)/Erc Starting Grant (agreement n. 278234 — ‘NewDark’ project). The au-thor also acknowledges the hospitality of the Institut d’Astrophysique de Paris, where part of this work was completed.
[1] ATLAS collaboration, “Search for resonances decaying to photon pairs in 3.2 fb−1of pp collisions at√s = 13 TeV with the ATLAS detector,” ATLAS-CONF-2015-081. [2] CMS Collaboration, “Search for new physics in high mass
diphoton events in proton-proton collisions at 13TeV,” CMS-PAS-EXO-15-004.
[3] ATLAS and CMS physics results from Run 2 - Dec. 15th talks by Jim Olsen and Marumi Kado.
[4] A. Falkowski, O. Slone, and T. Volansky, (2015), arXiv:1512.05777 [hep-ph].
[5] M. R. Buckley, (2016), arXiv:1601.04751 [hep-ph]. [6] J. H. Davis, M. Fairbairn, J. Heal, and P. Tunney,
(2016), arXiv:1601.03153 [hep-ph].
[7] https://github.com/bradkav/ATLASfits/releases/ latest.
[8] A. Rohatgi, “Webplotdigitizer v3.9,” http://arohatgi. info/WebPlotDigitizer, accessed: 20 January 2016. [9] G. Aad et al. (ATLAS), Phys. Rev. Lett. 105, 161801
(2010), arXiv:1008.2461 [hep-ex].
[10] G. Aad et al. (ATLAS), Phys. Rev. D90, 112015 (2014), arXiv:1408.7084 [hep-ex].
[11] D. Foreman-Mackey, D. W. Hogg, D. Lang, and J. Goodman, Publ. Astron. Soc. Pac. 125, 306 (2013), arXiv:1202.3665 [astro-ph.IM].
[12] J. Goodman and J. Weare, CAMCoS 5, 65 (2010). [13] G. Cowan, K. Cranmer, E. Gross, and O. Vitells,
Eur. Phys. J. C71, 1554 (2011), [Erratum: Eur. Phys. J.C73,2501(2013)], arXiv:1007.1727 [physics.data-an]. [14] S. S. Wilks, Ann. Math. Statist. 9, 60 (1938). [15] G. Schwarz, Ann. Statist. 6, 461 (1978).
[16] H. Akaike, IEEE Transactions on Automatic Control 19, 716 (1974).
[17] R. E. Kass and A. E. Raftery, Journal of the American Statistical Association 90, 773 (1995).