THE EARLY STAGES OF PLASTIC FLOW IN COPPER by
William Thomas Brydges III
S. B., S. M., Massachusetts Institute of Technology (1963)
SUBMITTED IN PARTIAL FULFILLMENT OF THE REQUIREMENTS FOR THE
DEGREE OF DOCTOR OF SCIENCE
at the
MASSACHUSETTS INSTITUTE OF TECHNOLOGY
Signature of Au Certified by
ithor
Department of Mechanical Engipeerir, &ctober 31, 1966
• / Thesis Suoervisor
Accepted by
Chairman, Departmental Committee on Graduate Students
TYOIIii
THE EARLY STAGES OF PLASTIC FLOW IN COPPER
b oy
William Thomas Brydges III
Submitted to the Department of Mechanical Engineering on October 31, 1966 in partial fulfillment of the require-ments for the degree of Doctor of Science.
ABSTRACT
The early stages of plastic flow in copper single crystals have been explored by dislocation etch pit experiments.
By twisting crystals to introduce known forest dislocation densi-ties, the tension yield stress has been related to the forest density in the form
T =T + a GbN
y yo y f
where Tyo - 5 g/mm2 and a y 0.65, indicating a strong interaction
be-tween primary and forest dislocations.
The motion of dislocations and their arrangement in multipole clus-ters have been studied as a function of stress in the pre-yield and easy glide regimes. Below the multiplication stress, about five per cent of the initial dislocations move, on slip planes subjected to a finite stress, distances comparable to the spacing of forest dislocations (25 * 10- 4 cm).
Above the multiplication stress, pre-yield strain is due to dislocations moving the order of ten forest spacings. In easy glide, dislocation mul-tiplication experiments suggest that the distance of motion is constant and comparable to the crystal size (0. 5 cm), and not sensitive to strain rate and temperature.
The dislocation motion accounting for the strain recovered on un-loading has been determined. The distance of dislocation back motion
-4
decreases from about 60 to 25 * 10 cm in the pre-yield region, and be-comes constant at about 15 * 10-4 cm in easy glide. The dislocation den-sity in motion during unloading increases as the square root of strain through the pre-yield and easy glide regions.
The results support the view that the flow stress is determined by the forest dislocation density, and is the stress necessary for primary dislocations to move large distances through the forest.
Thesis Supervisor: Ali S. Argon
iii
TABLE OF CONTENTS
Page
ABS TRACT ii
LIST OF FIGURES iv
LIST OF TABLES viii
I. INTRODUCTION 1
II. CRYSTAL PREPARATION AND GENERAL
EXPERIMENTAL PROCEDURE 5
III. EXPERIMENTAL RESULTS 19
3. 1 Dislocation Multiplication in Easy Glide 19
3. 2 Dislocation Arrangements as a Function of Stress 28
3. 3 MVIicrostrain Measurements 44
3. 4 Dislocation Motion Accounting for Recovered
Unloading Strain 51
3. 5 Relation of the Yield Stress to the Forest
Dislocation Density 63 IV. DISCUSSION 70 V. CONCLUSIONS 77 REFERENCES 78 APPENDICES A. Observations on Etching 80
B. Damage Due to Spark-Sectioning 93
C. Dislocation Distribution Introduced by Twisting
the Crystal 97
D. Behavior in Alternating Tension and Compression 101
E. Dislocation Etching of Magnesium 104
ACKNOWLEDGMENTS 107
LIST OF FIGURES
Number Page
1-1. Shear stress-shear strain curve for a copper single
crystal with characteristic parameters labelled. 2
2-1. Crystal orientation and nomenclature for (111) slip
planes. 8
2-2. Sub-structure in an annealed crystal. The growth
direction is from left to right. 12
2-3. Crystal soldered in brass collars to mate knife-edge
grips for tensile loading. 14
2-4. Polygonization of dislocations of opposite sign on
opposite faces near crystal grips. 15
3. 1-1. Relation between the increase in etch pit density after yielding and shear strain for all crystals tested in
easy glide multiplication experiments. 23
3. 1-2. The interaction of dislocations with sub-boundaries
in easy glide, crystal 5-17. 24
3. 1-3. Relation between the etch pit density and shear stress for all crystals tested in easy glide multiplication
experiments. 26
3. 1-4. Relation between the dislocation multiplication rate
and temperature in easy glide. 27
3. 1-5. Relation between the normalized dislocation
multi-plication rate and inverse temperature in easy glide. 29 3. 2-1. Relation between etch pit density and shear stress in
the pre-yield and easy glide regions, crystal 4-8. 32 3. 2-2. Dislocation motion on the primary (A) and conjugate
(B) planes, -r = 16 g/mm2, crystal 4-8. 33
3. 2-3. Preferential formation of clusters in neighborhood
of pre-existing dislocations, crystal 4-1. 36
3. 2-4. A cluster in the pre-yield region, -r = 30 g/mm2 crystal 4-8. Many of the dipoles lie at about 450 to the orimarv slio direction.
i_ ____~______________~_
Number Page 3. 2-5. Clusters composed of both positive and negative
dislocations, indicated by black and white pits,
crystal 5-17. 38
3. 2-6. Histogram of pit separation distances in pre-yield
region, - = 30 g/mm2, crystal 4-8. 40
3. 2-7. Clusters in a sub-grain, T = 89 g/mm2, crystal 4-8. 42 3. 2-8. Histogram of pit separation distances, T = 89 g/mm2
crystal 4-8. 43
3. 2-9. Streamer composed mainly of dipoles, T = 89 g/mm2
crystal 4-8. 45
3. 3-1. Typical load-unload cycle for microstrain
measure-ments, with parameters labelled. 48
3. 3-2. Relation between recovered strain and forward strain,
crystal 5-5. 49
3. 3-3. Relation between flow stress, unloading stress, and
forward strain, crystal 5-5. 50
3. 4-1. Examples of dislocation motion during unloading,
crystal 4-1. 53
3. 4-2. Histogram of dislocation motion on unloading, -3
y = 9 * 10 , crystal 4-3. 54
3. 4-3. Opposite sense motion of opposite sign dislocations-4
on unloading, y = 7 10- , crystal 4-3. 56
3. 4-4. Glide polygonization on unloading, crystal 4-3. 58 3. 4-5. Unloading relaxation of a polygonized wall of
dis-locations, crystal 5-5. 58
3. 4-6. Unloading motion of dislocations between clusters,
crystal 4-3. 59
3. 4-7. Relation between distance of dislocation movement
on unloading and forward strain, crystal 4-3. 60
3. 4-8. Relation between density of dislocations moving during unloading and forward strain, crystal 4-3.
___ __
vi
Number Page
3. 4-9. Relation between recovered unloading strain and
forward strain, crystal 4-3. 62
3.4-10. Relation between recovered unloading strain and flow
stress, crystal 4-3. 64
3. 5-1. Relation between etch pit density on primary and cross planes and cumulative twist per unit length,
crystal 5-18. 66
3. 5-2. Relation between yield stress in tension and square
root of forest density, crystal 4-10. 68
A-i. Dislocations revealed by Livingston's etch on a
{•11} face of copper. 82
A-2. Electron micrograph of a surface replica showing
fine structure of black (A) and white (B) pits. 82 A-3. Dislocations of opposite sign, shown by black and
white pits, piling up at opposite sides of a
sub-boundary in easy glide. 84
A-4. Sub-boundaries black, white, and mixed, and a
sub-grain filled with white pits. 84
A-5. Predominantly white pits resulting from a twisting
cycle. 86
A-6. Re-etching behavior. A and B are, respectively, black and white pits at the sites of dislocations which did not move during straining; C a new pit; D and E,
respec-tively, white and black pits where dislocations moved. 86
A-7. A possible mechanism for re-etching behavior. 88
A-8. Electron micrograph of a surface replica showing fine structure of pit and ledges on surface following
re-etching. 89
A-9. Dislocations revealed by Livingston's (1962b) etch on a 1o00 surface of copper. (a) Virgin crystal showing black (A) and white (B) pits; (b) after 2 10- 3 strain;
(c) after 8 10- 3 strain. 92
B-I. Relation between etch pit density on primary plane exposed by spark-sectioning and distance below
the cut.~
the cut.
A-2. Electron micrograph of a surface replica showing
fine structure of black (A) and white (B) pits. 82
A-3. Dislocations of opposite sign, shown by black and
white pits, piling up at opposite sides of a
sub-boundary in easy glide. 84
A-4. Sub-boundaries black, white, and mixed, and a
sub-grain filled with white pits. 84
A-5. Predominantly white pits resulting from a twisting
cycle. 86
A-6. Re-etching behavior. A and B are, respectively, black
and white pits at the sites of dislocations which did not move during straining; C a new pit; D and E,
respec-tively, white and black pits where dislocations moved. 86
A-7. A possible mechanism for re-etching behavior. 88
A-8. Electron micrograph of a surface replica showing
fine structure of pit and ledges on surface following
re-etching. 89
A-9. Dislocations revealed by Livingston's (1962b) etch on
a C100) surface of copper. (a) Virgin crystal showing
black -(A) and wite (B) pits; (b) after 2 10-3 strain;
(c) after 8 ~O str ain. 92
B-l. Relation between etch pit dedsity on primary plane
vii
Number Page
B-2. Etch pits at successive depths below spark-cut primary plane. (a) 0. 1 mm; (b) 0. 2; (c) 0. 3;
(d) 0. 4; (e) 0. 7. 96
C-I. Etch pit distribution on cross plane after twisting
crystal. 100
D-1. Etch pits in same region on virgin crystal (a), after tensile cycle (b), and after compressive half-cycle (c). The cluster (A) formed in tension remains after compression (A'). Etch pit band B' is formed
by critical plane dislocations. 102
E-1. Etching of magnesium. The composition of the etchant was 100 ml 0.01N HC1 with one drop of
viii
LIST OF TABLES
Number Page
2-1. Impurity content of copper in various stages of
preparation 6
2-2. Schmid factors for all {111} <110 > slip systems. 10 3. 1-1. Parameters determined for crystals in easy glide
multiplication experiments. 21
3. 2-1. Pre-yield dislocation movement on {111} slip planes.
I. INTRODUC TION
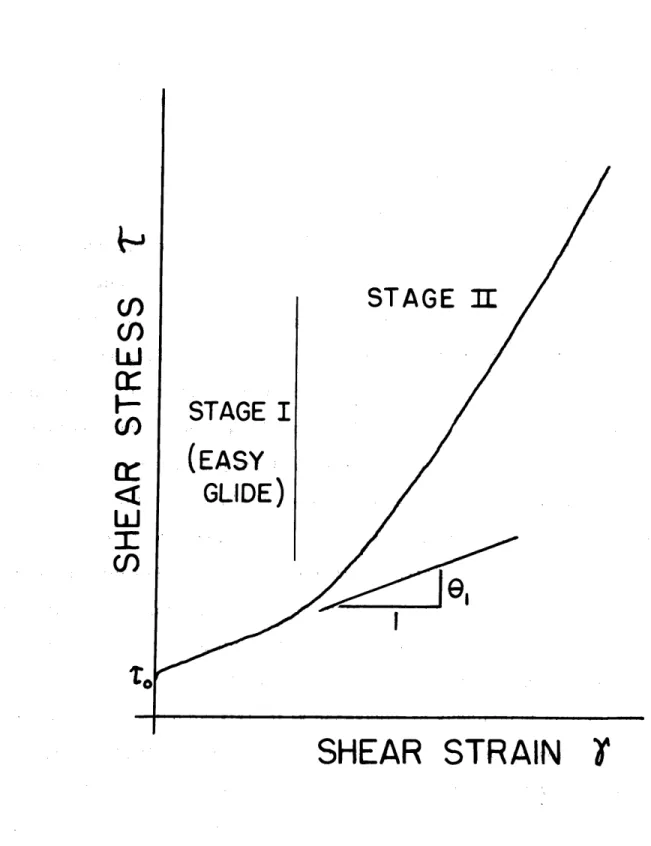
It was recognized by Orowan (1934), Polanyi (1934), and Taylor (1934) that dislocations in a crystal lattice are responsible for values of the yield strength of crystals being several orders of magnitude lower than the theoretical lattice shear strength. Yet after thirty years of in-vestigation of the relationships between dislocations and the plasticity of crystals, the initial portion of the stress-strain curve is quantitatively little understood. The tensile shear stress-shear strain curve for a copper single crystal used in this study is shown in Figure 1-1, with the characteristic parameters labelled. The attention of this work is direct-ed to the pre-yield region (below Tr, the macroscopic yield point), and
to easy glide (Stage I).
Several factors contributed to the choice of copper for the study. It is a face-centered cubic metal which exhibits three stage hardening at room temperature and on which a considerable literature exists about mechanical behavior; it can be obtained in spectrographic purity and
grown into single crystals of controlled orientation by standard techniques; and, of primary importance for this work, on certain crystallographic surfaces the points of emergence of dislocations can be revealed reliably by pits produced by chemical attack.
Experiments in the early stages of plastic deformation are afflicted by at least two inherent difficulties. First, mechanical properties in these regimes are strongly dependent on the initial structure of the crys-tals, and experimentally there is always some variation in structure
STAGE I
(EASY:
GLIDE)
STAGE 1I
SHEAR
STRAIN
Fig. 1-1. Shear stress-shear strain curve for a copper single crystal with characteristic parameters labelled.
0
F-.. 3
STAGE I
(EASY
GLIDE)
STAGE
3I
SHEAR
STRAIN
1-1. Shear stress-shear strain curve for a copper single crystal with characteristic parameters labelled.
0
0
Q
I
U
C,
Fig.between crystals grown or annealed in different batches. Second, because the stresses required to alter the initial structure are exceedingly low, handling of the crystals presents difficulties. Ideally, measurements of all parameters would be made on each crystal, using techniques which require a minimum of specimen handling, the measurements being repro-duced on as many crystals of similar initial structure as possible. Prac-tically, it is usually not possible to make measurements of all desired quantities on each crystal; hence, when observations from different crys-tals are put together, the variability in cryscrys-tals and their handling is a latent variable.
The dislocation etch-pitting technique is particularly suitable for
studies in the early stages of plastic flow. The technique is non-destructive, permits repetitive observations on the same crystal, and requires a mini-mum of specimen handling. It is possible also to perform etching while a crystal is in the testing machine, and even under load. The technique is best applied to relatively large specimens in which the danger of hand-ling stresses is reduced. It has its best resolution at low dislocation den-sities, and furnishes a view of the entire crystal. These are unique
advantages etch-pitting has over transmission electron microscopy (TEM). The major limitation of the etch pit technique is that only surface obser-vations are being made. In order to gain a complete picture of dislocation configurations in the crystal, it is necessary to supplement etch pit obser-vations with TEM obserobser-vations. Although no TEM studies were made, the etch pit results of this work are compatible with the TEM findings of others, as will be discussed.
Following Section II, Crystal Preparation and General Experimental
4
Procedure, the experimental results are described in Section III, divided as follows: 3. 1, Dislocation Multiplication in Easy Glide; 3. 2, Disloca-tion Arrangements as a FuncDisloca-tion of Stress; 3. 3, Microstrain Measure-ments; 3. 4, Dislocation Motion Accounting for Recovered Unloading
Strain; 3. 5, Relation of the Yield Stress to the Forest Dislocation Density. The Discussion (Section IV) and Conclusions (Section V) are followed by five appendices describing experimental procedures and findings which have no direct bearing on the understanding of the early stages of plastic flow in copper.
II. CRYSTAL PREPARATION AND GENERAL EXPERIMENTAL PROCEDURE
The starting material was obtained from the Johnson, Matthey Com-pany in the form of rods 5 mm in diameter and 15 cm long (Johnson, Matthey catalogue designation JM 30). The impurity analysis of the copper, sup-plied by the manufacturer, is shown in Table 2-1.
Crystals were grown in vacuum (10-1 microns Hg) from a seed which had been mechanically cut from a large single crystal of the same material and then annealed. Prior to growth the charge was cut into small pieces, polished in nitric acid, rinsed in water and then methanol, and dried in a warm air stream. The charge was placed in an antechamber above the mold and cast into the mold after the vacuum was attained. It was then re-melted in place and solidification begun. A modified Bridgman growth technique consisted of holding the mold stationary in a furnace having a temperature gradient (100C per cm) and moving the solidification front upwards relative to it by continuously decreasing the power supplied to the furnace. The growth rate was 0. 5 cm per hour. An impurity analysis of an as-grown crystal is given in Table 2-1.
The mold was dry-machined from Carbone Corporation graphite having a total impurity content less than ten parts per million (manufac-turer's specifications). Twenty 1/4" X 1/4" X 3 1/2" crystals were grown at a time by branching from a header region connected to the seed. The yield of single crystals retaining the seed orientation was usually 15/20. After growth the crystals were mechanically sawed off the header while
~--~-Table 2-1. Impurity content of copper in various stages of preparation. As Purchased (supplier's analysis) After Growth (crystal 5-3) After Anneal (3-4) (5-15) (5-10) Spectrographic Analyses Iron 2 Silicon Silver Magnesium Calcium N Lead N Manganese N Aluminum Nickel Chemical Analyses Carbon Oxygen D D D ND ND NA ND
NA: not analyzed Impurity Element ppm 1-10 10-100 1-10 1-10 1 1 ND ND ND ND 1 1 1 1-10 10 1 1 ND ND 1-10 1 1 1 1 ND NA NA <1 NA NA NA NA <5
-·--.. -. I---l.,,;-P·;I---rrm~s~LW~~ LCY b. - -- · 1. -~-~ I--- 7g ~_C ~~X--CPF __
still confined in the channels of the mold. This procedure insured that there would be no large-scale deformation to the crystals in the cutting operation. Deformation introduced by the sawing at one end of the crys-tal was tolerated because (1) the cryscrys-tals were to be annealed before testing, and (2) the grips covered 1/2" from each end of the crystal in testing. Crystals were numbered for reference in the manner '4-13', indicating the crystal in mold position thirteen in the fourth batch grown. A more detailed description of the furnace, mold and method of crystal
growth has been given previously (Brydges 1963).
Before testing, crystals were annealed five days at 10000C in a -2
vacuum of 2. 10-2 microns Hg, followed by cooling to 3000C at a rate of 150C per hour, then to room temperature by furnace cooling. During annealing the crystals were laid horizontally on a slab of graphite of the same purity used in the mold. The {111} side faces, which were later to be etched, were vertical. The slab was placed in a Vycor test tube, which in turn was put in the hot zone of a quartz tube furnace. A piece of commercial purity copper sheet was used as a roof over the boat to prevent products from the devitrification of the Vycor tube from falling on the crystals. An impurity analysis of crystals after annealing is shown in Table 2-1.
The crystal orientation was selected to fulfill two requirements: (1) allow easy glide by having one 111} < 110 > slip system more highly stressed by the applied tension than the rest, and (2) provide surfaces close to {111) for dislocation etching of the crystal. Figure 2-1 shows the location of the crystal axis on a standard stereographic projection and indicates the nomenclature for the various slip planes. The Schmid factors __
CRYSTAL ORIENTATION FOR
EASY-GLIDE INVESTIGATION
Cf. nnju +(TTi
gv i rI woT
o
II)
Hi il iPlane
Primary
Schmid
Slip System:
Factor
(111)
on Primary
[To,]
System:
Fig. 2-1.Critical
Primary
Conjugate
Crystal orientation and nomenclature for {111} slip planes.
0.46
wo+ 0
ct Ur I- 1lu
ry
9
for all slip systems for this orientation are given in Table 2-2. If two side faces were exactly (1i1), the cross-slip system would be entirely unstressed by applied tension. However, the etching faces of the crys-tals were off (1T1) orientation by one degree, with an uncertainty of one degree, as determined from Laue back reflection x-ray photographs; in the table the Schmid factor for the cross system is shown for the worst case - two degrees off.
To prepare crystals for etching, they were electropolished in a solution of 50% orthophosphoric acid and 50% tap water. The electrolyte was stirred with a magnetic stirrer and the specimen, suspended verti-cally from one end, was rotated counter to the electrolyte flow with a motor-driven device. A copper screen was used as cathode. It was found that mirror-like polishes could be obtained either at 1. 5 to 2. 0 volts (on the usual polishing plateau), or at 5. O0 volts where bubble evolution occurred. To protect the grips during etching they were coated with Miccrostop lacquer. If the crystal was to be etched immediately after
polishing, it was rinsed in tap water and then etched wet; if it was to be etched at a later time, it was rinsed in tap water, then methanol, then dried in a warm air stream. As a matter of good laboratory practice the running water, methanol, and etchant were maintained within 1C of room temperature, although the polishing bath became somewhat warmer. An experiment in which a crystal was polished, rinsed and etched, and then re-polished, rinsed in cold water and etched again showed that the
different temperatures of solutions did not cause any dislocations to be introduced into the crystal.
Table 2-2. Schmid factors for all {(11)<110> slip systems. I ^%AF% r%
7
<110>
DIRE
AREA A
Slip Plane(II
SCO
Slip DirectionNORMAL
s x cos
#
Schmid Factor (cos X cos 0) 111 (Primary) T11il (Critical)TTi
(Conjugate)IT1 (Cross and Etching)
1
IP PLANE
P To1O'Tl
Tio
TTo
oT1
101Tio
011 101T10
To01
011 0. 46 .06 .* 39 .* 25 .08 .34 .12 .20 .08 .01 .02 .03 I -·--·a
P
P
(1962b) formula: 90 parts water, 25 hydrochloric acid, 15 acetic acid and 1 bromine. After etching, the crystal was rinsed in tap water, then in methanol, and dried in a warm air stream. A detailed account of the etching process is given in Appendix A.
Etch pit counts were generally made from Polaroid photographs taken on either a Leitz Panphot or a Zeiss Ultraphot microscope. No preset number of photographs was taken for a particular data point; rather, the number (and the magnification) was adjusted to give what was felt to be a valid sample of the particular pit distribution.
After annealing the crystal exhibited an etch pit density (excluding
5 2
dislocations in sub-boundaries) of about 10 per cm . The range was
4 5 2
from 7 * 104 to 4 - 105 per cm . The structure of an annealed crystal is revealed in Figure 2-2. A variation in sub-structure was evident along the growth direction. In general, one or more growth striations or sub-boundaries ran the whole length of the crystal, more or less parallel to the axis. Small cells (dimension about 1 mm) were most numerous at the end of the crystal first solidified. It was established by etching the cross plane and the primary plane (exposed by spark-sectioning, see Appendix B) that the dislocation density after annealing was isotropic.
This structure was comparable to or more perfect than that in crys-tals employed by other investigators using starting material of similar purity. The differences are likely due to growth and annealing conditions. In general, investigators using etch pit techniques obtain crystals of high-er starting phigh-erfection than investigators utilizing transmission electron microscopy. Young (1962c), Livingston (1962b), Hordon (1962), and Basinski and Basinski (1964), all utilizing etch pits, experimented on
I
CM
Fig. 2-2. Sub-structure in an annealed crystal.
The growth direction is from left to right.
I .z ;z I;e in ,i . · · :J · r : I· *. - ~ t · ·--L- II:-[ · · *-·irC~~i ..
crystals with starting densities of 10 5 per cm or less. Essmann (1965) and Steeds (1966), for transmission work, us ed crys tals with initial
6 2
densities in excess of 10 per cm . Also with the higher initial density group are some investigators who have performed mechanical property tests without examining the structures which develop, such as Bilello (1965) who measured an initial etch pit density of 2 , 106 per cm 2
The testing procedure varied depending on the experiment and will be described in later sections, but the method of gripping the specimens for tension tests was the same throughout. The crystals were soft-soldered into one-half inch long brass collars and were loaded through knife-edge grips as shown in Figure 2-3. The axis of the knife edges was normal to the (1T1) specimen surfaces, which contain the primary slip system Burgers vector. The knife edges could pivot about an axis normal to their own through a pin joint. These two degrees of freedom were intro-duced to allow the grips to rotate to accommodate the crystal lattice rota-tion during deformarota-tion. Even with these precaurota-tions, however, bending occurred in the specimen to a distance of one specimen thickness from the grips. This was observed by etch pits which showed polygonization of dislocations of opposite signs (shown by black and white pits, see
Appendix A) on opposite faces of the crystal, Figure 2-4. In studying dis-location structures developed from deformation no observations were taken in these end regions.
It was also found that bending was introduced into the specimen by asymmetric loading if the crystal was soldered into the grips on three sides. This was due to unbalanced loading - the tractions on the odd face were not paired on its opposite face and a moment was generated. This Mý
Polygonization of dislocations of opposite sign on opposite faces near crystal grips.
IF. ig. 2-4.
r--was confirmed by tests on lead cast in the shape of the specimens and glued into the grips, first on three sides and then on two. In the final grip design, soldering on only two faces was accomplished by relieving the bottom of the groove with a second groove, leaving two thin ledges on which the specimen rested.
Tensile tests were performed on electric-motor-driven machines of 1000-pound capacity. Two machines of essentially the same construc-tion were employed. One was equipped with strain-gauge load and ma-chine displacement cells; the other had only a load cell. The actual manner in which stress and strain were determined for any particular experiment will be discussed in the experimental results sections.
Although loading was in tension for the experiments to be reported, the effective stress for plastic flow is the shear stress resolved on the slip plane and in the slip direction of the dislocations whose motion accounts for the strain. Because in the early stages of straining the predominant motion is that of dislocations with Burgers's vector [To01l on the primary slip plane (111), the stress values which will be reported are shear stresses resolved to this system by multiplying the normal stress by the primary system Schmid factor 0. 46. The strain values to be reported are shear strains resolved to this system by dividing the normal strain by the same Schmid factor. Stress and strain were not corrected for lattice rotation, the correction terms being negligibly small (Schmid and Boas 1950, p. 59).
Etch pit densities are denoted by N when they are densities ob-served on the cross plane (1T1), and by Nf when they are observed on the primary slip plane (111) exposed by spark-sectioning (Appendix C). _i~l·l _1
17
g
gJ
normal
equal to the dislocation volume length density p (cm/cm 3). However, if the dislocation lines make an angle 9 with the etching plane normal, the intersection etch pit density will be related to the length density (or, equivalently, to the intersection density Nnormal on a plane normal to the dislocation lines) by the equation
N = p - cos 9.
If the dislocation lines are isotropically distributed in space, an integra-tion of this geometric relaintegra-tion yields the result that the intersecintegra-tion den-sity on any plane will be one-half the volume length denden-sity. A corre-sponding relation can be worked out for any given distribution of dislocation lines with respect to an etching surface. In the particular case of (111)
[To01 dislocations intersecting the (1T1) etching plane, the dislocations
make an angle of 70. 5 degrees (the {111) interplanar angle) with the etching surface, and the relation between the observed etch pit density
+1
+
fh 1-; T n a nlane normal to tfhe dilrcatinn lines is
In general, these etch pit measurements have been used to interpret the mechanical behavior of the crystals through their correlation with location densities and thus with plastic strains due to the motion of dis-locations. These relations will now be analyzed.
Although there may be considered to be a one-to-one correspond-ence between etch pits on a {1 11} surface and dislocations intersecting the surface (Livingston 1960), the etch pit density on a surface is not, in general, equal to the dislocation length per unit volume in the crystal. In the simple case of dislocation lines intersecting an etching plane at
irh in±,,ti-nn •no• th •h nit ~n~~itv NT ~ (em-2 3 wn rir ht an les the intersection etch pit depnscity N cm) wou~ld be
an
e ens
y o p
L
1
18
P
N = p cos (19. 50) = 1.06
The plastic shear strain y due to motion through an average dis-tance f of a length density p of dislocations with Burgers vector b is (Cottrell 1953, p. 18)
S= bpf.
To relate this strain to etch pit densities and displacements observed on the etching face, the particular dislocations whose motion contributed to the strain must be known. If the strain is produced by the motion of primary system edge dislocations alone, the relation between N and p is as worked out above, and the distance of motion x observed on the (IT1) etching face is identical to the distance of motion measured normal to the dislocation lines. Thus the relation between the shear strain y resolved on the primary system, etch pit densities N observed on (IT1), and distances of movement x observed on (iTi) becomes
y = 1. 06 bNx.
Because the uncertainties in etch pit density measurements are usually greater than 10%, the factor 1. 06 will usually be taken as unity.
Considerable use will be made of these relations in later sections. Also recurring in calculations will be the numerical values of the Burgers
1 -8 11
vector b 4-<110>) = 2. 5 * 10 cm, and the shear modulus G = 4.9 1011 dynes/cm2 = 5 106 g/mm2 (Friedel 1964, p. 455).
y ~ 06 bNx.
Because the uncertainties in etch pit density measurements are usually y ~ 06 bNx.
Because the uncertainties in etch pit density measurements are usually
greater than 100/o, the factor i. 06 will usually be taken as unity.
Considerable use will be made of these relations in later sections.
Also recurring in calculations will be the numerical values of the Burgers
-8 11
vector b ~-<110~ 2. 5 10 cm, and the shear modulus G 4. 9
III. EXPERIMENTAL RESULTS 3. 1 Dislocation Multiplication in Easy Glide
Dislocation multiplication is particularly amenable to study by etch pit techniques; Livingston (1962b), Young (1962b), Hordon (1962), and Basinski and Basinski (1964) have performed experiments to measure etch pit densities as functions of stress and strain. The experiments reported here are similar to these in technique but introduce the addi-tional parameters of temperature and strain rate.
The procedure was to polish and etch a crystal to determine the initial density No on the (IT1) surfaces, then to deform the crystal into
the easy glide range, unload, re-polish and etch, and determine the etch pit density N. The sequence was repeated with successive strain incre-ments through easy glide or until the technique began to fail either be-cause the etch pit density became unresolvable by light microscopy or
because the side faces became un-etchable due to rounding from successive polishings.
Crystals were tested at three strain rates at each of three temper-atures. The specimen length between grips was nearly constant, 6 cm,
-6
and the shear strain rates based on this length were 1. 4 * 10 , 8. O0 10-5 , and 5. 0 * 10-3 per second. The temperatures were room temper-ature, 2980K; the equilibrium temperature of dry ice and alcohol, 1950K; and the equilibrium temperature of liquid nitrogen and its vapor, 770K. The baths were contained in a Dewar flask which surrounded the lower portion of the testing machine frame, the bath being in direct contact with
the specimen. The experiments were performed on the machine equipped with load and displacement cells, the outputs of which were fed into a Sanborn recorder and then into anX-Y recorder to provide a load-elonga-tion curve which could be monitored during the test. The actual strains were measured by observing with an optical cathetometer the change in separation of two pin scratches made across the gauge section on the ir-rational specimen surfaces. Prior to adopting this method it was shown with etch pits that although dislocations are introduced into the crystal by scratching, subsequent straining occurs without multiplication of these dislocations. Presumably the scratching introduces dislocations of many systems which are in a highly work-hardened configuration.
Table 3. 1-1 shows the parameters measured in the tests. The strain rates have been abbreviated S (for the slowest), M (medium) and F (fast).
The initial etch-pit density No does not include dislocations in sub-bound-aries. The value of the yield stress, To, was obtained from a construc-tion on the X-Y recording as the point of intersecconstruc-tion of two lines, one coincident with the loading slope prior to yielding, the other coincident with the easy glide slope. Although the yielding process is a gradual one (as will be discussed in a later section), on the X-Y plot the yield point appears rather sharp because the strain scale is compressed. The easy glide strain-hardening coefficient 91 was computed from the true strain values. The extent of easy glide was determined only in those cases when the accumulated strain increments showed an upward turn in the
dN X-Y load elongation recording. The dislocation multiplication rate dN was taken from a straight line fit to the etch pit density versus strain plot. The etch pit density at the yield point, Ny, was determined by 'II
Parameters determined for crystals in easy glide multiplication experiments. N o (10 5 cm - 2 ) T (g/mm ) 21 (kg/mm ,y) Extent of Easy Glide
(%o
Y)
dN dy 8 cm-2) 1 dN N 0 dy Ny 3 5 -2 (10 ) (10 cm ) 77 S 3-8 M 3-2 F 3-5 95 S 5-2 M 3-11 M 3-12 F 5-20 98 S 3-9 M 3-19 M 3-6 F 3-1 Strain Rate Temp(
0K)
Crystal 1 2 1.6 0. 7 1. 3 1.6 7.0 2. 6 2. 8 3. 4 2.0 2. 3 3. 8 31 35 40 43 110 57 82 31 47 32 0. 8 1.0 1.4 1.9 2. 8 1.4 1. 1 1. 3 1. 7 1. 5 2. 5 >4. 1 7. 4 6. 5 1. 7 >0. 7 4.0 >4. 2 3. 9 >2. 7 3. 5 2. 2 1. 7 0. 7 1. 5 1. 6 2. 9 1.0 1.4 0. 9 0.9 0. 8 0. 9 1.1 1.0 1. 2 1.0 0.4 0.4 0. 5 0. 3 0. 4 0. 3 0. 2 1.5 4.0 5.0 10.0 6. 5 11.0 0.0 3. 5 11.0 0.0 Il~iiXl~yr*·ii:?..i.if. - _ _ _ _ _II i_ i C - --- I -a- --- I --- ---~irr~_ix---;P--r-:-*-;-i-irercir Table 3. 1-1.extrapolating this line to zero strain. In almost all cases this intercept was considerably above the initial etch pit density value.
Dislocation multiplication data may be presented in a variety of ways, some having a more straightforward physical interpretation than others.
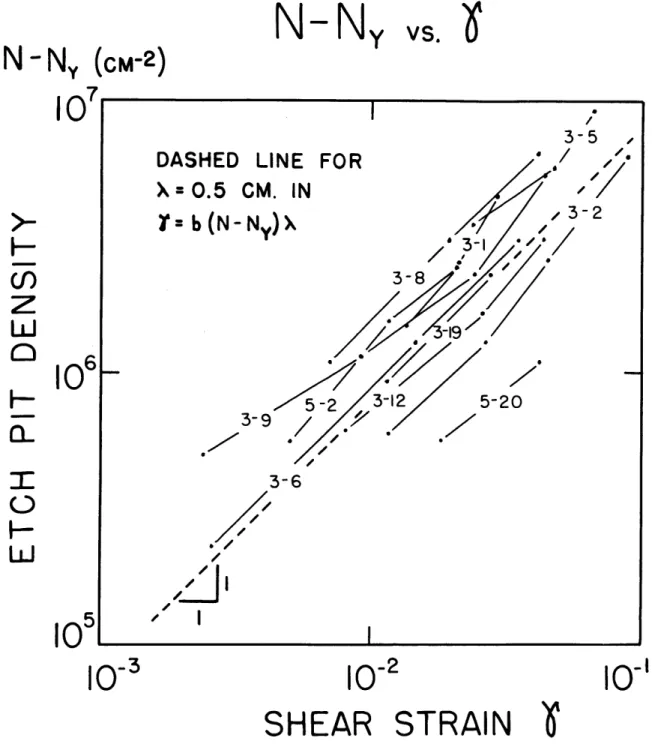
The approximately linear relation between the increase in etch pit density after yielding, N-Ny, and the plastic strain is shown in Fig-ure 3. 1-1, which includes the data for all crystals tested. A linear in-crease of etch pit density with strain implies that the mean free path X for dislocation motion is constant. This follows from the geometric equation for strain in terms of dislocation density and motion; if dislo-cation density increases linearly with strain, each dislodislo-cation will, on the average, have moved the same distance. Taking N = p and X = x the geometric strain equation becomes
y = bNX
and for the unity slope line in Figure 3. 1-1, X = 5 mm, which is on the order of the specimen thickness. If the total etch pit density is plotted instead of the increase in density after yielding, the density-strain cor-relation is not linear because of the pre-yield multiplication.
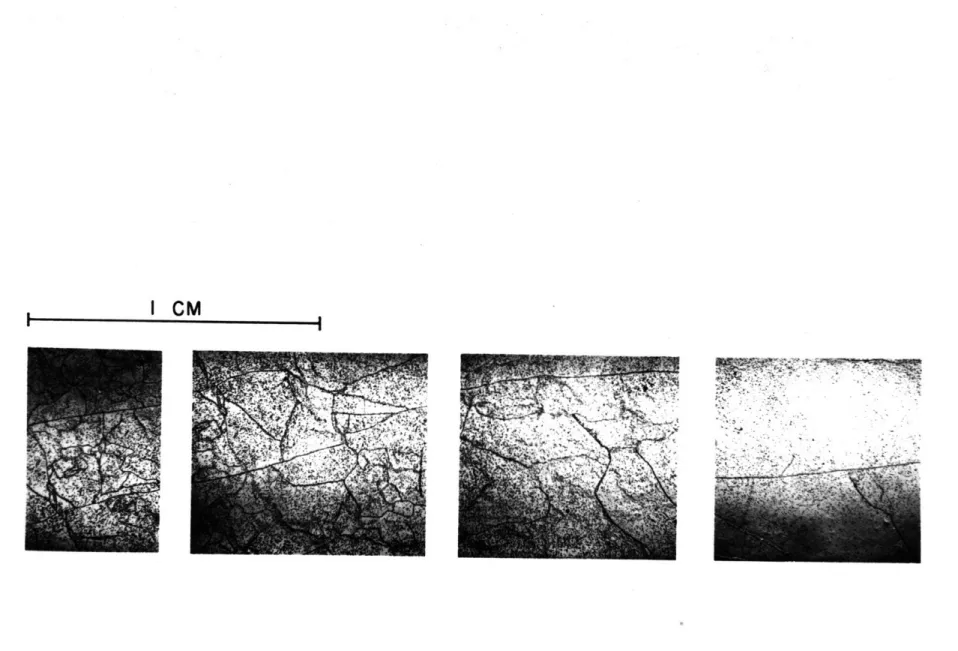
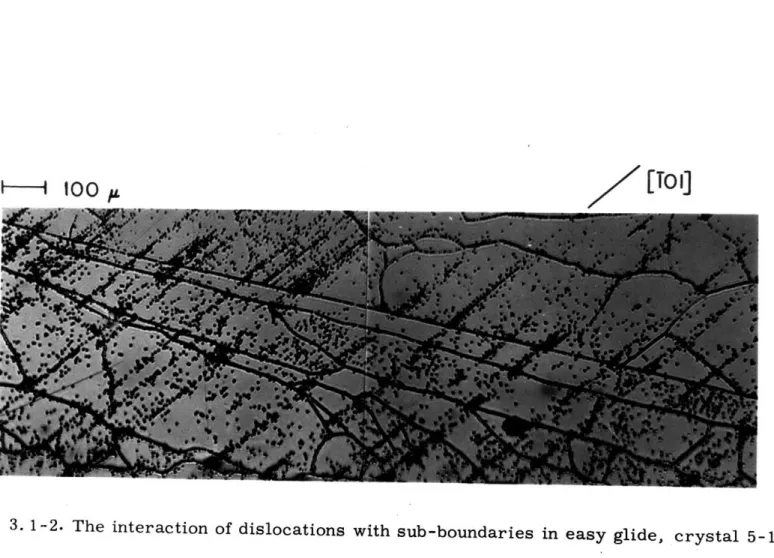
The value of mean free path just calculated is larger than the sub-grain size. Evidence that dislocations are able to penetrate sub-boundaries is presented in Figure 3. 1-2, where dislocation clusters at successive sub-boundaries appear to be associated across the crystal. It was
ob-served that the character and amount of slip were roughly the same through-out a crystal, with no apparent dependence on sub-structure.
N-Ny
I A I ai-- a-I 9a,
3-8 ,-.J / UDA•SU LI
X = 0.5
CM
)=b(N- N
3-9 3-6 / I10-2
5-20 -210-'
SHEAR
STRAIN
Fig. 3. 1-1. Relation between the increase in etch pit density after yielding and shear strain for all crystals tested in easy glide multiplication experiments.
N-Ny
(CM-2)
_710'
vs. W
106
W
n
;7
-r
[To,]
-i
1o00
ý.Fig. 3. 1-2. The interaction of dislocations with sub-boundaries in easy glide, crystal 5-17.
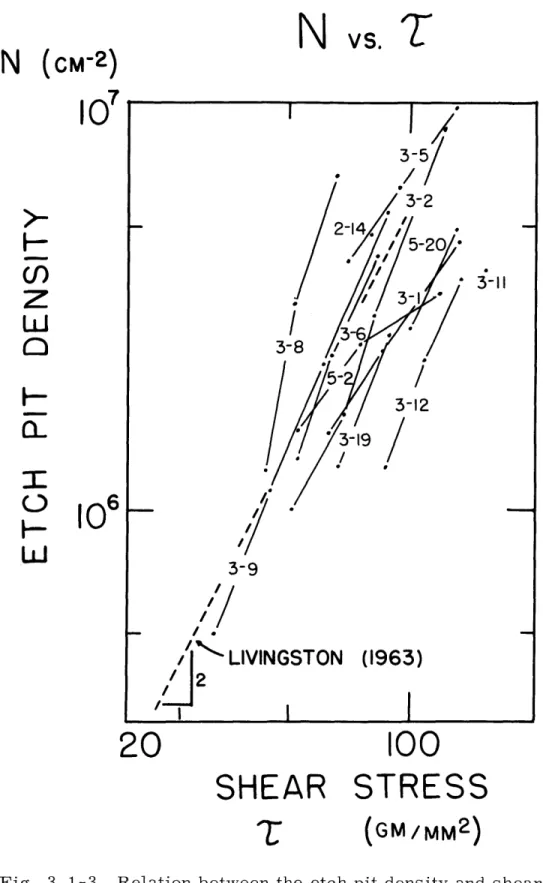
The relation between total etch pit density and shear stress resolved on the primary slip system is shown in Figure 3. 1-3. The correlation line shown is that given by Livingston (1963) to represent his (196 2b) data and that of Young (196 2b).
The physical importance of this correlation between the flow stress and the square root of the etch pit density measured on the cross plane is uncertain. Clearly, the data here has too much scatter and is over too limited a range to allow drawing any conclusions about the accuracy of the correlation. Basinski and Basinski (1964), while agreeing with Livingston that a square root correlation is valid in Stage II, find that in easy glide such a correlation is valid only for the forest dislocation etch pit density (the density measured on the primary plane), and that the density measured on the cross plane does not satisfy the relation. They report that the forest density-stress correlation is in fact valid throughout easy glide and Stage II. In a later section experiments will be reported which indicate that the yield stress is determined by a square-root correlation with the forest density. The cumulative effect of these observations is to suggest that the forest density correlation is the more physically significant.
The temperature and strain rate dependence of the dislocation mul-dN
tiplication rate is shown in Figure 3. 1-4. Although less than a factor dy
of two separates all the rates, a general trend toward higher multiplica-tion rates at lower temperatures does seem tenable. There is no reason to suppose that there is a transition in strain rate effect for the strain rates applied, so it is concluded that the difference in multiplication parameter for different strain rates at the same temperature is due to
N
(CM-2)
i7
I0
U)
LLd
zr
LU
106
N
20
vs.
2
100
SHEAR
STRESS
T
(GM/MM
2)
Fig. 3. 1-3. Relation between the etch pit density and shear stress for all crystals tested in easy glide multiplication experiments.
dN
d
"S
dN
(CM-2)
d
Y
.In
STRAIN RATES
0
1.4-10-6 SEC
-'
A 8. 10
- 5O
5 10
- 30---0
LUj
.-!1:
rr
z
0
CL
0
0
C)
0
n
100
200
TEMPERATURE
Fig. 3. 1-4.T
Relation between the dislocation multiplication rate and tem-perature in easy glide.
VS.
T
I
I
2
1
0
300
"K)
~1 " • II "IV28
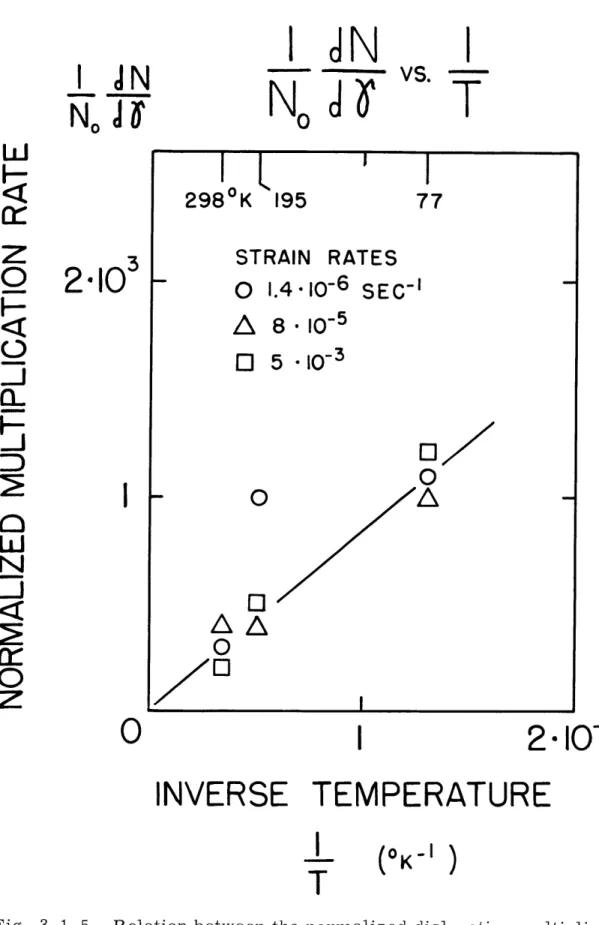
unanalyzed differences between crystals and experimental errors. It has been suggested by Reid, Gilbert and Rosenfield (1965) that the rate of dislocation multiplication depends on the initial grown-in dis-location density. Figure 3. 1-5 illustrates the result of normalizing the dislocation multiplication rates by dividing them by the initial etch pit density. Apart from one point, this normalization has had the effect of accentuating the difference between multiplication rates at differing tem-peratures. Extrapolation on the 1/T plot predicts that at high tempera-ture the normalized multiplication rate becomes very small.
3. 2 Dislocation Arrangements As a Function of Stress
The multiplication experiments have been presented without atten-tion being given to the manner in which the dislocaatten-tions are arranged in the deformed crystal. In this section will be presented the results of a systematic study of the development of dislocation arrangements from the pre-yield through the easy-glide regimes. The only etch pit study to overlap these regions has been that of Young (1962b), who measured etch pit densities but not distributions. In a separate study examining the pre-yield region, Young (1961b) also was concerned mainly with dis-location numbers and not arrangements.
The tests to be described were made on crystal 4-8, which was polished, etched and examined before loading, then re-polished. Loading was performed on the machine without a displacement cell; no measument was made of strain. The load signal was fed into the Sanborn re-corder. The procedure was to etch the electropolished crystal while it
LuJ
I--Z
CL
z
I-0
t.
-J
0
z
I
JN
N
o
JQd
2*103
I
VS.
-T
I
L
I
I
298
0K 195
77
STRAIN RATES
0
1.4-10-6 SEC
-'
A 8.10
- 50
5 -10
- 30
A
AA~
0
C
0
-0
I-,2*10
-3
INVERSE TEMPERATURE
(oK
-I )
I
T
Fig. 3. 1-5. Relation between the normalized dislocation multiplica-tion rate and inverse temperature in easy glide.
I AN
30
was in the machine prior to loading, remove the etch (which was in a beaker), load to a predetermined value, unload, re-etch the crystal while it was still in the machine, rinse in water and methanol and dry in an air stream. The crystal was then removed from the machine and micro-scope observations made of the dislocation motion which had occurred. The density of dislocations which moved during the straining increment was determined by counting the flat-bottomed pits; such pits mark the initial sites of dislocations which moved. The distance moved by a dis-location was identified as the distance between such a flat-bottomed pit and a (generally) nearby smaller, pointed-bottom pit which was on a line parallel to a < 110 > slip direction from the flat pit. The formation of flat-bottomed and new pointed-bottomed pits in a double-etching experi-ment is described more fully in Appendix A.
In the double-etched condition etch pit resolution is not optimum, both because of the several types of pits showing, and because a
double-etching does not leave clean, sharp pits (see Appendix A). Consequently, the crystal was electropolished and etched again so that more accurate
etch pit counts could be made and etch pit clusters analyzed. The crystal, electropolished again, was then ready for the next loading increment.
The shear stress resulting from the first loading increment was 5 g/mm2. Subsequent loadings were to stresses of 10, 16, 17, 21, 30, 39, 50, 65 and 89 g/mm . The macroscopic yield point of the crystal was 34 g/mm2. This was determined from the point on the load-time chart of the Sanborn recorder at which the loading rate sharply decreased (the crosshead displacement rate of the testing machine was constant).
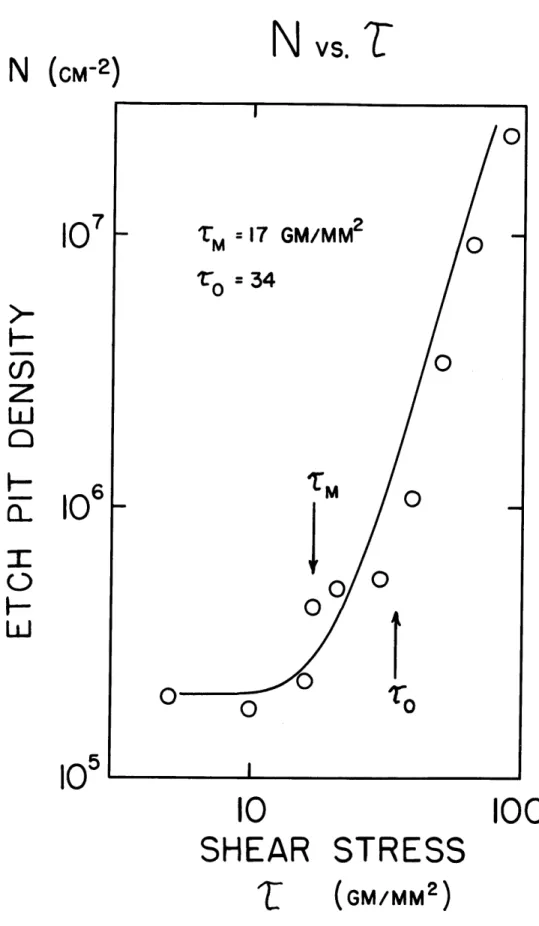
Figure 3. 2-1. In this plot, N represents an average of the densities measured at several points in the crystal, the same regions being used
each time. It can be seen that the etch pit density did not increase from
5 2
its initial value of about 2. 10 per cm until the stress reached about 17 g/mm2, which agrees well with Young's (1961b) similar observation. Above this stress the density increased rapidly.
Below the multiplication stress there was always some motion of dislocations initially present. At T = 10 g/mm2, about five per cent of the dislocations moved. The fraction of dislocations which moved did not increase with stress below the multiplication value. Below 7 mo-tion was not confined to the primary system: Figure 3. 2-2 shows momo-tion on both the primary and conjugate planes. The plane of a moving disloca-tion was determined as the plane whose < 110 > line of intersecdisloca-tion with the etching face (IT1) was parallel to the pit movement. The number of dislocations moving on the different systems was measured and it appeared that there was a transition from motion on three (111} planes to motion almost exclusively on the primary plane at the multiplication stress. The relative frequencies of motion observed for (111} planes are shown in
Table 3. 2-1. Motion on the cross plane could not, of course, be detected since that was the etching plane. The counting for these determinations was done on the projection screen of the microscope. The crystal was scanned to locate flat-bottomed pits and then a search was made for a small pointed-bottomed pit in one of the three < 110 > slip directions away from it. When it was questionable to which flat pit a fresh pit correspond-ed, it was not included in the count. At T = 16 g/mm2, 91 associations were made; at 21 g/mm2, a lesser number 27, were made because after
Figure 3. 2-1. In this plot, N represents an average of the densities measured at several points in the crystal, the same regions being used
each time. It can be seen that the etch pit density did not increase from
5 2
its initial value of about 2. 10 per cm until the stress reached about 17 g/mm2, which agrees well with Young's (1961b) similar observation.
Above this stress the density increased rapidly.
Below the multiplication stress there was always some motion of dislocations initially present. At T = 10 g/mm2, about five per cent of the dislocations moved. The fraction of dislocations which moved did not increase with stress below the multiplication value. Below 7 mo-tion was not confined to the primary system: Figure 3. 2-2 shows momo-tion on both the primary and conjugate planes. The plane of a moving disloca-tion was determined as the plane whose < 110 > line of intersecdisloca-tion with the etching face (1T1) was parallel to the pit movement. The number of dislocations moving on the different systems was measured and it appeared that there was a transition from motion on three 1 1 1} planes to motion almost exclusively on the primary plane at the multiplication stress. The relative frequencies of motion observed for { 111 planes are shown in Table 3. 2-1. Motion on the cross plane could not, of course, be detected since that was the etching plane. The counting for these determinations was done on the projection screen of the microscope. The crystal was scanned to locate flat-bottomed pits and then a search was made for a small pointed-bottomed pit in one of the three < 110 > slip directions away from it. When it was questionable to which flat pit a fresh pit correspond-ed, it was not included in the count. At T = 16 g/mm2, 91 associations were made; at 21 g/mm2, a lesser number 27, were made because after
N
(CM-2)
uJ
>-
Ha.
C)
H_
-r"
106
N
vs. T
I0
SHEAR
T
100
STRESS
(GM/MM
2)
Fig. 3. 2-1. Relation between etch pit density and shear stress in the pre-yield and easy glide regions, crystal4-8.
\"OU
Be
Fig. 3. 2-2. Dislocation motion on the primary (A) and planes, T = 16 g/mm , crystal 4-8.
conjugate (B)
I-I
IOpi
Table 3. 2-1.
Resolved Stress r
on Primary System
(g/mm2 )
Per Cent of Movements Observed
as a Function of {111} Planes
Primary
69
Critic al Conjugate
Average Distance of Movement for Dislocations
on Primary Plane
(cm)
25 • 10-4 96 4 0 9~1~ --- ~--- ';' I --- ~-/llsp~--~---~IRIIC- --~- ~L--~r 1^ -L·-ldlRB~B~B~llh -. 1 - P-~I~J-~----T~ ----·-Pre-yield dislocation movement on various -111} slip planes.
cC-35
multiplication the difficulty of unambiguously making an association in-creased.
Although it could be seen that dislocation multiplication was occur-ring, the sources of the new dislocations could not be located. Evidence such as the occurrence on the same slip plane of separated pile-ups (which might bracket a source) was not found.
A striking feature which was observed from the lowest stresses in the pre-yield region was the development of dislocation clusters in the sub-grains. The tendency for newly generated dislocations to collect in clusters is indicated in Figure 3. 2-3, the result of a double-etching, be-fore loading and after unloading. The new pits appear preferentially in regions around the dislocations present prior to loading.
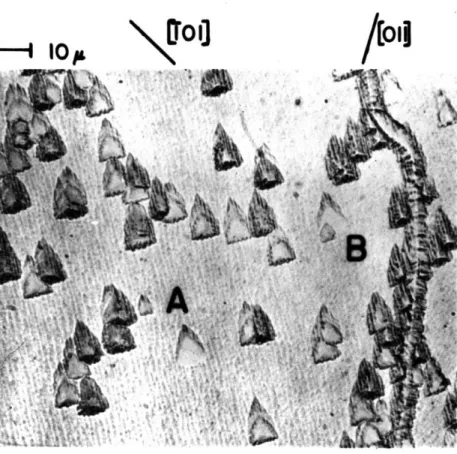
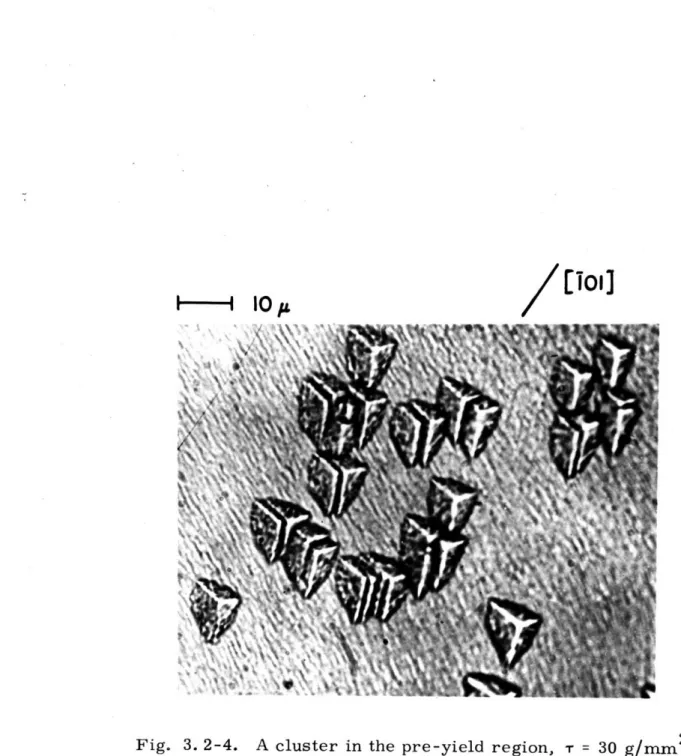
A cluster observed by etching after unloading from T = 30 g/mm2 is shown in Figure 3. 2 4. Many of the dislocations are associated pair-wise one with another, that is, in dipoles. The lines of centers of many pairs make nearly a 450 angle with the primary slip direction, suggesting that these dipoles are opposite sign edge dislocation dipoles of the primary system. The cluster may be considered a multipole, having a net Burgers vector much less than the total number of dislocations in the cluster.
The multipole nature of clusters may also be seen in Figure 3. 2-5, the result of an etching with black-white pit differentiation denoting posi-tive and negaposi-tive dislocations (the subject of black-white etching is dis-cussed in Appendix A). Although a quantitative measure of the dipole con-centration in a cluster can not be obtained from this photograph, it can be seen that the clusters contain both positive and negative (black and white) dislocations.
/[roil
7
Fig. 3. 2-3. Preferential formation of clusters in neighborhood of pre-existing dislocations, crystal 4-1.
____ __ _i__·__i ~ ;___
/
o01i]
H-I
pIO.U
Fig. 3. 2-4. A cluster in the pre-yield region, T = 30 g/mm2 , crystal 4-8. Many of the dipoles lie at about 45* to the primary slip direction.
SI00A
/
[TOi]
Fig. 3. 2-5. Clusters composed of both positive and negative dislocations, indicated by black and white pits, crystal 5-17.
3 ·I -- ·~- --epe~l ·- · a* _~__ _ ---~L-~_ic~ ·
As a further check on the nature of the dipoles in clusters, the distribution of etch pit spacings has been analyzed. An edge dislocation dipole will be stable, that is, it can form and will not be driven apart by the applied stress, only if the spacing between the slip planes of the dis-locations is less than a distance set by the stress level and given (Cottrell 1953, p. 152) by the relation
h Gb
87T(1-v)T
To analyze the dipoles a histogram was constructed by picking a particular pit and measuring the center-to-center distance to its nearest neighbor, then from that pit to its nearest neighbor, and so on until a return was made to a pit previously involved in the sequence. When this occurred, a pit not yet reached was taken as a new starting point and the procedure begun again until a pit from either current or a past sequence was reached. This procedure implied that certain separations, particu-larly the smaller ones, would be counted twice, but not more than twice.
A number of photographs of clusters at T = 30 g/mm2 were analyzed in this fashion and the frequency of occurrence f of center-to-center dis-tances observed as a function of the distance D is shown in Figure 3. 2-6. The center-to-center distance corresponding to the critical interplanar spacing is indicated in the histogram. The relation between interplanar spacing h and center-to-center distance D is a geometric one,
h = D • cos 450 - sin 70. 5'.
50
0L
o
LU
0
U-ZD
LU
40
30
20
I0
0
t
=30
GM/MM
2 I-'LCRITICAL
I0
Average Values15
20 10
-4
NEAREST PIT DISTANCE
(CM)
Fig. 3. 2-6. Histogram of pit separation distances in pre-yield
region, T = 30 g/mm 2, crystal 4-8.
JIIL--h-L
of an opposite-sign dipole (line of centers of the dislocations at 450 to the slip direction), and the term sin 70. 50 derives from the angle be-tween the (IT1) observation plane and the plane normal to the dislocation lines.
The fact that f falls off at about the critical spacing supports the hypothesis that the dislocation dipoles are the basic building blocks of the clusters. The second peak in the historgam reflects the spacing of dislocations which are not in dipoles. If all dislocations were distributed evenly, the nearest neighbor spacing would be the reciprocal square root of the etch pit density, which at T = 30 g/mm2 was about 5 • 10 per cm .
-4
This spacing would be 14 • 10-4 cm; the position of the peak at a smaller distance is a measure of the clustering.
In easy glide, the number of clusters increased from the pre-yield level, but not as rapidly as did the number of dislocations associated with
each cluster. Once formed, clusters did not break up as a result of fur-ther deformation; a similar stability was observed when a crystal was
subjected to a compressive strain after deformation in tension (Appen-dix D).
Figure 3. 2-7 shows almost a complete sub-grain at T = 89 g/mm2 The density of clusters such as those labelled A, B and C is about 2 * 105
2
per cm , equal to the initial density of the crystal. The tendency for clusters to show an orientation effect, either parallel or perpendicular to the primary slip direction, was observed only at stresses above the yield point.
Figure 3. 2-8, an etch pit spacing histogram for r = 89 g/mm2
[Tol]
* ~ . .·* I At *r~ U. f 4-' -.<·':f
*rr
Fig. 3. 2-7. Clusters in a sub-grain, T = 89 g/mm ,
crystal 4-8.
I
10
Opu
p " C * °° ·'I ¼'A, * f.: 5 r .4vs.
D
40
30
20
10
0
4-10
-
4
Fig. 3. 2-8.NEAREST PIT DISTANCE
D
(cM)
Histogram of pit separation distances, i = 89 g/mm2 crystal 4-8.
50
0
LLU
0
:D
0,
I
2
3
r
44
implying that at the higher stress a greater fraction of the dislocations are in dipole configurations. In this histogram as in the previous one, the dipole peak falls off at the critical passing spacing.
A dislocation configuration of particular interest is shown in Fig-ure 3. 2-9. Streamers of this sort are frequently observed, but if the etch pits are not clearly resolvable they may be mistaken for pile-ups. This photograph, the result of a short (one second) etching, shows that the streamer consists mainly of dipoles, perhaps all on the same two parallel planes, stacked one next to another. The dipole spacing is less than the passing spacing for the stress level, 89 g/mm2
3. 3 Microstrain Measurements
The topic of microstrain, the plastic behavior of a crystal below its macroscopic yield point, has received attention for the information it sheds on the behavior of dislocations in non-strain-hardened material.
The parameters which can be measured in microstrain experiments are more or less distinct from those determined in macroscopic mechanical tests, though, of course, a successful theory of crystal plasticity must
satisfactorily explain observations on both scales.
The parameters which are measured in microstrain experiments may be divided into two classes, those which are sensitive to the strain resolution and those which are not. Experimental determinations of elastic limits, either in loading or unloading, are extremely sensitive to the strain resolution employed; magnitudes of strain, such as forward plastic strain or recovered unloading strain, are relatively insensitive to strain resolution on the micro-scale, that is, a strain resolution of
[01]
I I
r e -* *' * *tp~ S * III. ~e * I -*0 0,.'%
S. 1 i a £ GO&m .Am mpl.
* ' * SI
SFig. 3. 2-9. Streamer composed mainly of dipo] crystal 4-8. 6 0 A *. 4· 4.r v
I
__
I ~ I I Il I Iabout 10-6. This was the resolution in the present experiments, as well as in earlier work on copper single crystals by Rosenfield and Averbach (1962) and Bilello (1965), and on zinc by Roberts and Brown (1960).
Loading of crystals prepared in the usual manner was carried out on the testing machine equipped with a load cell. A linear variable dif-ferential transformer (Schaevitz Engineering, Model 020M-L) measured displacements in the specimen. The transformer coil housing was mount-ed along the specimen axis in an aluminum collar which was screwmount-ed to one grip. The core was held by an aluminum bracket which was affixed by screws to the other grip and ran the length of the specimen. The bracket was split into three pieces held together by screws, with slotted clearance holes employed so that the core could always be centered con-centrically with the coil regardless of specimen length and slight varia-tions in grip alignment. The output of the LVDT was fed into a Sanborn recorder through a phase shift network which kept the output signal in phase with the input. The load cell output was also fed into the Sanborn, from which both load and displacement signals went to an X-Y recorder. Data was analyzed from the X-Y record.
The LVDT was calibrated and checked for hysteresis with dummy specimens of aluminum and polycrystalline copper with assumed elastic moduli of 10 and 18 * 106 pounds per square inch, respectively. When single crystals of copper were subsequently tested, the apparent elastic modulus was always within ten per cent of the value for the particular orientation computed from the elastic coefficients given by Schmid and Boas (1950, p. 191). This value was 1. 38 * 104 kg/mm2. The source