Distinct preplay of multiple novel spatial experiences in the rat
The MIT Faculty has made this article openly available.
Please share
how this access benefits you. Your story matters.
Citation
Dragoi, George and Susumu Tonegawa. "Distinct preplay of multiple
novel spatial experiences in the rat." PNAS 2013 110 (22) 9100-9105.
As Published
http://dx.doi.org/10.1073/pnas.1306031110
Publisher
National Academy of Sciences (U.S.)
Version
Final published version
Citable link
http://hdl.handle.net/1721.1/85178
Terms of Use
Article is made available in accordance with the publisher's
policy and may be subject to US copyright law. Please refer to the
publisher's site for terms of use.
Distinct preplay of multiple novel spatial experiences
in the rat
George Dragoi
1and Susumu Tonegawa
1The Picower Institute for Learning and Memory, RIKEN-MIT Center for Neural Circuit Genetics, Department of Biology, and Department of Brain and Cognitive Sciences, Massachusetts Institute of Technology, Cambridge, MA 02139
Contributed by Susumu Tonegawa, April 11, 2013 (sent for review March 4, 2013) The activity of ensembles of hippocampal place cells represents
a hallmark of an animal’s spatial experience. The neuronal
mech-anisms that enable the rapid expression of novel place cell sequen-ces are not entirely understood. Here we report that during sleep or rest, distinct sets of hippocampal temporal sequences in the rat preplay multiple corresponding novel spatial experiences with high specificity. These findings suggest that the place cell sequence of a novel spatial experience is determined, in part, by an online
se-lection of a subset of cellularfiring sequences from a larger
reper-toire of preexisting temporalfiring sequences in the hippocampal
cellular assembly network that become rapidly bound to the novel experience. We estimate that for the given context, the recorded hippocampal network activity has the capacity to preplay an ex-tended repertoire of at least 15 future spatial experiences of similar distinctiveness and complexity.
I
t is a matter of debate whether specific sequences of place cells
(1) encoding different novel spatial experiences in the rat are
formed exclusively during the experiences (2–4) or are, in part,
preconfigured in the form of correlated temporal sequences that
are expressed before the experience (5–7). Previous work in mice
has shown that in the naïve animal, temporal
firing sequences
expressed in association with sharp-wave ripples during sleep or
rest can preplay future spatial sequences of place cells encoding
novel environments (5). However, it remains unclear whether
place cell sequences encoding a novel spatial experience are
pre-configured as a dominant cluster of temporal sequences
prefer-entially preplaying the subsequent experience or whether they are
selected from an existing larger repertoire of temporally organized
sequences. The latter would confer the hippocampal network with
the capacity to rapidly encode multiple parallel spatial
experi-ences, but the extent of this capacity has not been addressed
ex-perimentally. Here we investigate these two issues.
Results
Preplay of Future Place Cell Sequences and Spatial Trajectories.
Ensembles of place cells were recorded from the CA1 area of
the hippocampus in three experimentally naïve rats during sleep/
rest sessions and during subsequent
first-time exploration of
1.5-m–long linear tracks (Fig. 1A). The sleep/rest sessions were
conducted in a sleep/rest box surrounded by high opaque walls
that blocked the rats’ view of the room except for a limited
portion of the ceiling. After the naïve rats went through an
∼1-h
sleep/rest period, a linear track (Materials and Methods) was
in-troduced into the room for the
first time. Place cell sequence
templates were computed by ordering the place cells based on
the location of their place
field peak firing during exploration of
the linear track (Fig. 1B, Right). Spiking events were detected
during sleep/rest frames (8) as epochs of multiunit activity
recorded from at least six different pyramidal cells with a
<100-ms interspike interval in the multiunit activity,
flanked by epochs
of
>100 ms of silence (4, 5, 9). For each spiking event, the order
of cells
firing during sleep/rest (temporal sequence) was
corre-lated with the order in which they subsequently
fired as place
cells during exploration of the linear track (spatial sequence) (2,
4, 5, 9). During an event, if a cell
fired more than one spike, only
the
first spike was further considered to calculate the “temporal”
sequence of neuronal
firing (2, 8, 9). Similar results (
Fig. S1
)
were obtained when individual cell
firing rates were accounted
for by considering all of the spikes emitted during the events
(4, 10). An event was considered as preplay of the future place
cell sequence (Fig. 1B, Left) when the absolute value of the
corresponding temporal–spatial correlation exceeded the 97.5
percentile of a distribution of absolute correlation values
calcu-lated between the event and 500 surrogate spatial sequences
created by shuffling the original spatial order of place cells (5).
We used a Bayesian reconstruction algorithm (5, 11, 12) to
decode the rat’s position from the neuronal activity recorded
during the
first run session on the novel track or during the
preceding sleep/rest session in the box. The decoded
(recon-structed) position during the run was compared with the actual
trajectory of the animal (Fig. 1C). The cumulative error (Fig. 1D,
red lines) and average error (Fig. 1E, red lines) of the
recon-structed position were significantly smaller than the distribution
of errors obtained by shuffling for 500 times the time bins (Fig. 1
D and E, Left) or position bins (Fig. 1 D and E) of the original
reconstructed position of the animal during the run. Moreover,
in a significant number of cases, the firing rate-based Bayesian
decoding of the neuronal activity of
“all” spikes during each
spiking event detected as above during sleep/rest revealed
pat-terns of activation of place cells subsequently coding spatial
trajectories on the novel linear track that was only later explored
for the
first time (Fig. 1F). For each event, the decoded
trajec-tory during the preceding sleep/rest was significant if the original
score for the line
fitting along the trajectory (5, 12) exceeded
the 99th percentile of each of the two distributions of 500 scores
(P
< 0.01; Fig. 1F). These scores were calculated by fitting a line
through the surrogate probability distributions of positions (12)
(Materials and Methods) obtained by shuffling the time bins or
position bins of the original probability distribution function
decoded during the sleep/rest session (5, 12).
Statistical Significance of Preplay of Single Novel Spatial Experience.
Of all the detected spiking events during sleep/rest in the three
rats, 9.8% were classified as significant preplay of the future
spatial sequences because they were significantly correlated with
place cell sequences expressed during the
first-time exploration
of the novel track. Preplay sequences spanned 82.6% of the track
length on average (n
= 1,388; P < 10
−200, binomial probability
test; Fig. 1G and
Fig. S2
). They occurred in the forward or
re-verse order (forward:rere-verse ratio
= 1.04) and generally were
significantly correlated specifically with place cell sequences of
one direction of movement (85.3% of preplay sequences were
Author contributions: G.D. and S.T. designed research; G.D. performed research; G.D. analyzed data; and G.D. and S.T. wrote the paper.
The authors declare no conflict of interest.
Freely available online through the PNAS open access option.
1To whom correspondence may be addressed. E-mail: [email protected] or tonegawa@ mit.edu.
This article contains supporting information online atwww.pnas.org/lookup/suppl/doi:10.
1073/pnas.1306031110/-/DCSupplemental.
16 14 12 10 8 6 4 2 1 15 13 11 9 7 5 3 17 24 22 20 18 23 21 19 25 26 27 30 28 31 29 Pre-Run Sleep/Rest
Preplay events Novel track
De novo - Run 0 150 Position (cm) Time (ms) 400 ms -1 -0.5 0 0.5 1 0 500 1000 1500 Data . .ShuffleSignificant Correlation value Num b er o fe v e n ts Time (s) Data . .ShuffleSignificant Number of events N umber of events Reconstruction score Reconstruction score
H
G
B
-500 0 500 0 20 40 60 80 N um ber of ri pple s Time lag (ms)I
0 0.2 0.4 0.6 0.8 1 0.5 0.6 0.7 0.8 0.9 1 0 20 40 60 80 100 120 P os ition(cm )C
0 0.1 0.2 0.3 0.4 0.5 0.6 0.7 0.8 0.9 1 0 40 120 160 0.5 20 60 100 140 0 6 12 18 0 Time (s) 25 0 160 P o sit ion (cm) C u m u lati v e frac ti o n Error (cm) Error (cm) Co u nt s 80D
E
F
Run 0 1 0 20 40 60 0 40 80 120 160Time-bin shuffle Position-bin shuffle 16 14 12 10 8 6 4 2 1 15 13 11 9 7 5 3 17 24 22 20 18 23 21 19 25 26 27 30 28 31 29 Cell number 0.05 0.1 0.15 0 150 0.020.04 0.06 0.08 0.1 0.12 0.02 0.040.06 0.08 0.1 0.12 0.14 0.05 0.1 0.15 0.2 0.05 0.1 0.15 0.05 0.1 0.15 0.2 0 150 0.05 0.1 0.15 0.02 0.04 0.06 0.08 0.1 0.1 0.15 0.2 0 150 0.15 0.2 0.25 0.3 0.05 0.1 0.15 0.2 0.05 0.1 0.15 0.2 0.25 0.3 0.05 0.1 0.15 0.2 0.04 0.06 0.08 0.1 0.12 0.14 0.05 0.1 0.15
Preplay of novel track
0 150 0.02 0.04 0.06 0.08 500 1500 2500 3500 4500 -35 p<10 p<10-100 Sleep/Rest box
A
Novel linear track-0.83 -0.70 0.93 0.65 0.85 -0.89 -0.68 0.57 0.66 -0.87
Fig. 1. Preplay of future place cell sequences and spatial trajectories during sleep/rest in the naïve rat. (A) Schematic of the sequence of experimental sessions
(one-track experiment). Preplay events were detected during thefirst sleep/rest session of naïve rats (Left) and correlated with the place cell sequences on the
linear track (Right). (B) Examples of preplay spiking events during the sleep/rest session in the sleep box preceding thefirst run on the novel linear track (first
10 boxes; Left) and the corresponding place cell sequence during the run (Right) in one naïve rat. Tick marks (first 10 boxes; Left) indicate individual spikes
during preplay events. For each event and for each participating cell, thefirst spike emitted during the event is represented in red, whereas all of the
remaining spikes are in gray. The numbers in the boxes are the correlation values between the temporal order of spiking and the spatial order of activation
corresponding to each preplay event. Corresponding localfield potential recordings are shown above the spiking events. The horizontal arrow (Right)
indicates the order of the place cell activation during the run. (C) Bayesian decoding of the rat’s position from the spiking activity of all cells during one lap
run on the novel track (250-ms bins, animal velocity>10 cm/s). The heat map represents the decoded position of the animal, whereas the yellow line displays
its actual position on the track. (D) Cumulative probability distribution of the error of the Bayesian decoding of the rat’s position (red curves) compared with
the distribution of errors of 500 shuffles (blue curves) of time bins (Left) and position bins (Right). (E) Average error of the Bayesian decoding of the rat’s
position (red lines; scaled up 10 times) compared with the distribution of average errors of 500 shuffles (blue curves) of time bins (Left) and position bins
(Right). (F) Examples of significant decoding of a future trajectory on the novel track from ensemble place cell activity during the sleep/rest session before
novel track exploration (i.e., prerun sleep/rest) in one naïve rat (20-ms bins, animal velocity<1 cm/s). The white lines show the linear fit maximizing the
likelihood along the virtual trajectory. (G) Distribution of correlation values between spiking events and the place cell sequence for all events occurring during
the prerun sleep/rest in three animals. Open bars, spiking events vs. the original (unshuffled) templates; filled black bars, spiking events vs. 500 shuffled
templates scaled down 500 times; red bars, distribution of preplay (i.e., significant) events. The P value reflects the minimum significance level (i.e., the largest
P value) of the difference between the original set (open bars) and any of the 500 sets of shuffled (black bars) correlation values using the rank-sum test. (H)
Distribution of decoding scores for the virtual novel track trajectory for all events occurring during the prerun sleep/rest in three rats. Open bars, scores during
all spiking events;filled black bars, scores of 500 time-bin shuffles scaled down 500 times; red bars, scores of significant events exceeding the 99th percentile
of both time-bin and position-bin shuffle distributions. The P value reflects the minimum significance level (i.e., the largest P value) of the difference between
the original set (open bars) and any of the 500 sets of shuffled (black bars) scores using the rank-sum test. (Inset) Enlarged display of the distribution for score
values between 0.5 and 1. (I) Cross-correlation between preplay events and ripple occurrence in CA1 during prerun sleep/rest in the three rats (the distribution
of the time of ripple occurrence with reference to the time of occurrence of the significant preplay events).
NEUROSCI
unidirectional; mean absolute correlations with the preferred vs.
unpreferred direction templates, 0.78 vs. 0.44, P
< 10
−141,
rank-sum test). The peak of the distribution of absolute correlation
values of all events with the novel track (Fig. 1G) is around 0.25.
This indicates that whereas some events have no correlation with
the future experience (r
∼ 0; Fig. 1G), most of the temporal
sequences in the naïve rats are not completely independent from
the future place cell sequence activity on the linear track, despite
only a minority of them reaching significance (Fig. 1G). This
residual correlation could be due to the organization of neurons
in cellular assemblies based on nonstructured past experiences
in similar contexts. In addition, in 4% of the spiking events,
decoding revealed significant spatial trajectories on the novel
linear track that spanned 42.2% of the track length on average
10 28 16 14 26 35 7 37 46 47 36 19 54 30 20 12 18 40 52 6 31 53 11 34 55 32 38 50 15 51 43 26 56 20 12 21 47 2 4 18 29 55 54 52 8 1 16 15 55 19 37 28 46 31 41 17 5 3 50 6 30 20 14 16 1 21 15 6 43 54 34 37 28 17 50 2 51 47 19 4 5 52 8 26 7 29 38 0 150 300 450 0 150 300 450 0 150 300 450 Pre-Run Sleep/Rest Preplay events Track 2 Run Cel l number Time (ms) 400 ms Ce lln u mb e r Cel l number Track 3 Track 1 43 26 56 20 12 21 47 2 4 18 29 55 54 52 8 1 16 15 55 19 37 28 46 31 41 17 5 3 50 6 30 10 28 16 14 26 35 7 37 46 47 36 19 54 30 20 12 18 40 52 6 31 53 11 34 55 32 38 50 15 51 20 14 16 1 21 15 6 43 54 34 37 28 17 50 2 51 47 19 4 5 52 8 26 7 29 38 Track 1 Trac k 2 Tr a c k 3 Sleep/Rest box
A
B
0 0.5 1 0 0.5 1 0 0.2 0.4 0.6 0.8 1C
D
.Track 1 ..Track 2 . .Track 3 A v e rag e corr e la ti on val ue Preplay Track 1 Preplay Track 2 Preplay Track 3 Correlations with Track 1Correlations with Track 2
Co rr e lat ion s wi th Tr a ck 3 .Preplay Track 1 ..Preplay Track 2 . .Preplay Track 3 * * * 0.98 0.92 0.64 0.84 1 0.81 0.89 -0.88 -0.87 0.78 0.92 -1 0.85 -0.92 0.87 0 0.2 0.4 0.6 0.8 * Position (cm)
Fig. 2. Selection of specific
hippocam-pal temporal sequences during encod-ing of multiple novel spatial experiences in the rat. (A) Schematic showing the sequence of experimental sessions (three-track experiment). All preplay events
were detected from thefirst sleep/rest
session of naïve rats (black box) and correlated with the place cell sequences from the three tracks (U-shape maze). Animals were familiarized with track 1 (run and sleep/rest sessions depicted in light gray) before the exploration of the U-shape maze, whereas tracks 2 and 3 remained novel. (B) Examples of pre-play (Left) of three distinct future place cell sequences on three linear tracks (Right) during sleep/rest in one naïve rat. For each track, the format display is the same as in Fig. 1B. Activity corresponding to tracks 1, 2, and 3 is in the Top, Middle, and Bottom, respectively. For compari-son, the place cell activity on the other two tracks is presented adjacent to the place cell sequences corresponding to tracks 1 (Top), 2 (Middle), and 3 (Bot-tom). The U-shaped track has been linearized for easier display. (C) Three-dimensional scatterplot of absolute cor-relation values between spatial tem-plates of the three novel tracks and
preplay events that are significantly
correlated with only one novel track. Red, blue, and green dots, events that preplay track 1 only, track 2 only, and track 3 only, respectively. Note the presence of three well-isolated clusters corresponding to preplay events,
in-dicating specific correlations with each of
the three novel tracks. (D) Average abso-lute correlation values between spatial templates of the three novel tracks and
preplay events specific to one novel
linear track. The Left, Center, and Right groups of three bars correspond to the red, blue, and green points from C,
re-spectively. Stars represent significant
differences between groups determined using the paired t test. Error bars are standard error of the mean.
(n
= 502, P < 10
−143, binomial probability test; Fig. 1H and
Fig.
S3
; Materials and Methods). The incidence of significant decoded
trajectories that exceeded the 97.5 percentile of each of the two
distributions of 500 shuffle scores (P < 0.025) was over 7.3% (n =
919, P
< 10
−174, binomial probability test). The significant preplay
events occurred in association with ripple oscillations (Fig. 1I), and
the spatial sequences were compressed in time (Fig. 1B, Left) and
were preplayed at an average speed of 4.9 m/s, about 20 times
faster than the running speed of the rats (average 25 cm/s).
Distinct Preplay of Multiple Novel Spatial Experiences.
The existence
of a significant set of correlated preplay events indicates that the
internal dynamics of the hippocampal network contribute to the
online expression of the very next place cell sequence. However,
it remains unclear whether the remaining set of uncorrelated
temporal sequences reflects noisy brain states or rather reflects
internal organization of neurons in sequential cell assemblies
(13) that could result in additional preplay sequences of yet to be
performed spatial experiences. To test whether, in the naïve rat,
given temporal sequences during sleep/rest preplay in parallel
multiple potential novel spatial experiences, the naïve animals
were exposed within 1 d to three contiguous novel linear tracks
that were each 1.5-m–long and attached in a U shape (Fig. 2A;
Materials and Methods). The rats were
first exposed to track 1;
later they accessed each of the two parallel tracks (tracks 2 and
3) (Fig. 2A) by explicitly exiting track 1 and turning 90° at corner
locations where tracks 2 and 3 were previously separated by
barriers from track 1. A unique sequence of place cells encoded
each of the three tracks with high specificity (Fig. 2B). Using the
above criteria for significance, each of the three tracks had
sig-nificantly matching temporal sequences that could be recorded
several hours earlier during the sleep/rest session in the naïve state,
before the rats had
“any” access to the linear tracks. Independent
clusters of spiking events (Fig. 2C) were highly correlated
specif-ically with only one track (P
< 10
−200, paired t test; corresponding
tracks, r
> 0.73 vs. noncorresponding tracks, r < 0.26, for tracks 1–
3; Fig. 2D), and all tracks had equally strong correlation values
with the corresponding cluster of preplay events (mean of absolute
correlations, r
> 0.73 for each track; Fig. 2D).
A similar proportion of temporal sequences out of all detected
spiking events significantly correlated exclusively with one track
but not the other two (6.65%, 6.8%, and 6.76% events
specifi-cally preplayed tracks 1, 2, and 3, respectively; Fig. 3A, Upper and
Fig. S4
). Overall, preplay sequences displayed high specificity
(>90% track specificity on any pair of tracks; Fig. 3A, Lower and
Fig. S4
) and little overall overlap across tracks (1.5% of all
events correlated with more than one track; Fig. 3A and
Fig. S4
).
In contrast, 93.7% of individual place cells were active in more
than one track in at least one direction (Fig. 3B), suggesting that
in the CA1 area, the basic unit that specifically represents
dif-ferent novel spatial experiences is the sequence of place cell
firing rather than the identity of individual cells. Overall, these
findings indicate that neurons in hippocampal area CA1 are
organized during sleep/rest by default into distinct sequential
cellular assemblies in the temporal domain (Fig. 3B, colored
lines) that can rapidly, simultaneously, and specifically encode
multiple future novel spatial experiences (note that the arrows
in Fig. 3B do not indicate synaptic connections of CA1 cells,
just the order in which they
fire).
Estimation of the Hippocampal Network Capacity for Preplay.
We
speculate that the remaining uncorrelated events comprising
78% of all of the detected events during sleep/rest in the naïve
state have the potential to preplay additional distinct future
novel spatial experiences (Fig. 3B, gray lines). To estimate the
capacity of the hippocampal network to preplay novel spatial
experiences during the sleep/rest session in the naïve state, we
took into account the relationship that exists in our data between
the number of novel linear tracks explored by our animals and the
proportion of highly specific preplay sequences that we detected
A
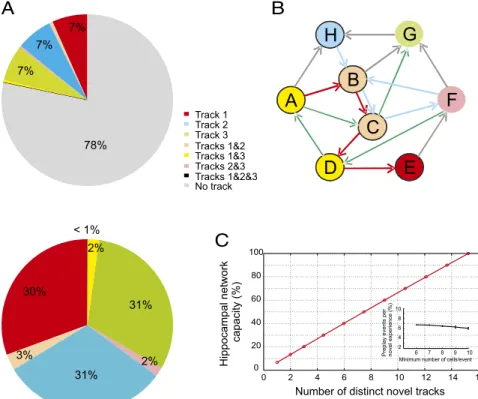
... .. Track 3 . Track 1 Track 2 . .. Tracks 2&3 . Tracks 1&2 Tracks 1&3 . . Tracks 1&2&3 . . No trackA
B
C
D
E
F
G
H
B
C
Number of distinct novel tracks
H ip po ca mpal ne tw or k c a p acity (% )
Minimum number of cells/event
Pre p lay e ven tsp er n o vel exp er ien c e( % ) 0 2 4 6 8 10 12 14 16 0 20 40 60 80 100 6 7 8 9 10 2 4 6 8 10 7% 7% 7% 78% 30% 3% 31% 2% 31% 2% < 1%
Fig. 3. Quantification and further estimation of
the capacity of the hippocampal network during sleep/rest to preplay multiple novel experiences.
(A) Proportion of preplay events significantly
cor-related with at least one track (see legend for color code) out of all detected spiking events
(Upper) and all significant preplay events (Lower)
during sleep/rest in the naïve rat from Fig. 2 (n=
9,835 total events). (B) Cartoon model of functional connectivity of hippocampal cellular assemblies corresponding to the three tracks. Each circled letter corresponds to an individual cell; arrows do not indicate synaptic connections of CA1 cells but
rather the order of cellfiring in CA1 as a result of
anatomical connectivity with the upstream CA3,
in which pyramidal cells are efficiently connected
by recurrent circuits. Arrows are color-coded (track
1, red, sequence A→B→C→D→E; track 2, blue,
F→D→A→C→G; track 3, green, H→B→C→F→B; no
track, gray). Individual cells are color-coded accord-ing to their participation in encodaccord-ing individual tracks as in A. (C) Estimation of the number of novel linear tracks the hippocampal network can preplay in a given sleep/rest session. The red curve
dis-plays a polynomial extrapolation of thefirst three
data points (1–3 on the abscissa) that represent
the percentage of preplay events out of the total number of spiking events that significantly cor-related with one track (e.g., track 1), two tracks (e.g., track 1 or track 2), and three tracks (e.g., track 1, track 2, or track 3), respectively, as described
in A. (Inset) Mean percentage of preplay events per novel linear track as a function of the minimum number of cells required to be simultaneously active during a spiking event. Error bars are SEM.
NEUROSCI
during sleep/rest. We modeled this relationship as a polynomial
function to extrapolate the number of potential novel tracks that
could be preplayed by individual subsets of temporal sequences
from the larger repertoire expressed during sleep/rest that would
be specifically correlated with only one track (Fig. 3C). We
esti-mate that during a given sleep/rest session, the hippocampal
net-work of the recorded neurons has the capacity to preplay with high
specificity at least 15 distinct novel tracks of similar distinctiveness
(>90% temporal sequence specificity on a pair of tracks) and level
of complexity (Fig. 3C). The average proportion of preplay events
per novel track, and implicitly our estimate of network capacity,
does not change significantly when the minimum number of cells
simultaneously active during a spiking event changes from 6 to 10
(P
> 0.05, rank-sum test; Fig. 3C, Inset).
Discussion
Our
findings show that the specificity of the representation of
a particular novel spatial experience in the rat is achieved during
the experience via the
“selection” of subsets of corresponding
temporal sequences from a larger repertoire of preconfigured
temporal sequences rather than from a dominant cluster of
tem-poral sequences preplaying the very next experience (5). The
corresponding temporal
firing sequences are rapidly bound to
the specific novel experiences in the form of specific place cell
sequences. The selection of specific sequences from a larger
preconfigured repertoire confers the hippocampal network with
the capacity to rapidly encode multiple parallel novel
experi-ences. The preplay events described in our study were recorded
exclusively in the sleep/rest box with high opaque walls during
the sleep/rest session before the linear tracks were
first
in-troduced into the room. We can thus exclude the possibility that
during these events the animals
“mentally traveled” within the
room, having view of the linear tracks. Moreover, the fact that
more than 90% of all the recorded CA1 place cells are active on
more than one track indicates that individual CA1 cells
partici-pate in multiple cellular assemblies encoding different spatial
experiences and that individually they cannot accurately
distin-guish the identity of multiple linear tracks. Instead, the sequences
of CA1 place cells in our data accurately distinguish across
mul-tiple linear tracks. Given that the subsets of preplay sequences
devoted to the representation of each of the three tracks represent
6–7% of all detected spiking events with similar proportions across
tracks, we estimate that for a similar experimental setting and
based on the activity of the same group of CA1 neurons, the
hippocampal network has the capacity to simultaneously encode
at least 15 different novel spatial experiences of similar
distinc-tiveness and complexity. These estimates are based on an average
of 6–7% of all temporal sequences preplaying each track and
∼90% novel track specificity between pairs of tracks. If a smaller
proportion of events preplays each track or if a greater overlap is
tolerated for the distinction of a pair of experiences, then the total
encoding repertoire of the hippocampal network will be greater.
Similarly, if the activity of all of the hippocampal cells were to be
taken into account in multiple contexts (14), the hippocampal
capacity to encode different novel experiences would be expected
to be higher. The capacity of the hippocampal network for a rich
repertoire of temporal preplay sequences may contribute to the
role of the hippocampus in prospective coding (15), rapid learning
(16), and imagining (17, 18).
Materials and Methods
Surgery and Experimental Design. Electrophysiological recordings were
per-formed on three adult Long–Evans male rats. All animals were implanted
under isoflurane anesthesia with either 22 independently movable tetrodes
(rats 1 and 3) or 64-channel 8-shank NeuroNexus linear silicone octatrodes (rat 2) aiming for area CA1 of the right hippocampus (4 mm postbregma,
1.5–3 mm lateral to midline). The reference electrode was implanted
pos-terior to lambda over the cerebellum. During the following week of
recovery, the electrodes were advanced daily while animals rested in a
high-wall opaque sleeping box [30× 45 × 40 (h)-cm]. The animal’s position was
monitored via two infrared diodes attached to the headstage.
The experimental apparatus consisted of a 150× 150-cm rectangular
el-evated linear track maze. All tracks were 6.25-cm–wide and 50 cm above the
floor. Experimental sessions were conducted while the animals explored for chocolate sprinkle rewards placed always at the ends of the corresponding linear tracks (one sprinkle at each end of the track on each lap). Neuronal activity was recorded in naïve animals during the prerun sleep/rest session in
the sleep box for∼1 h, after which the linear maze was brought into the
room and installed, followed by the recording of an additional∼1 h of sleep/
rest. Subsequently, the animals were transferred onto the linear maze for
thefirst time and allowed to explore a 150-cm–long linear track whose ends
were blocked by 20-cm–high, 10-cm–wide barriers (track 1). The animals
were familiarized with the linear track via repeated run–sleep/rest sessions.
Finally, while the animals were on the linear track, the two end barriers were
lifted, allowing the animals to explore for thefirst time two additional
150-cm–long linear tracks attached to the ends of track 1 (tracks 2 and 3) to form
the shape of the letter“U.” After completion of all experiments, the brains
of all the rats were perfused,fixed, sectioned, and stained using cresyl violet
for electrode track reconstruction. The rats were kept on a 12-h light/dark cycle and cared for in accordance with the standards of the Massachusetts Institute of Technology Committee on Animal Care and in compliance with National Institutes of Health guidelines.
Recordings and Single-Unit Analysis. A total of 114 neurons were recorded from hippocampal area CA1 in the three rats (31, 27, and 56 neurons)
during the sleep/rest and run sessions. Single cells were identified and
isolated using the manual clustering method Xclust (19). Pyramidal cells were distinguished from interneurons based on spike width, average rate, and autocorrelations (20).
Placefields were computed as the ratio between the number of spikes and
the time spent in 2-cm bins along the track, smoothed with a Gaussian kernel with an SD of 2 cm. Bins where the animal spent a total of less than 0.1 s and
periods during which the animal’s velocity was below 5 cm/s were excluded.
Placefield length and peak rate were calculated after separating the
di-rection of movement and linearizing the trajectory of the animal. Linearized
placefields were defined as areas with a localized increase in firing rate
above 1 Hz for at leastfive contiguous bins (10 cm). The place field peak rate
and location were given by the rate and location of the bin with the highest
ratio between spike counts and time spent. Placefield borders were defined
as the points where thefiring rate became less than 10% of the peak firing
rate or 1 Hz (whichever was bigger) for at least 2 cm.
Local Field Potential Analysis. Ripple oscillations were detected during sleep/
rest periods in the sleep box. The EEG signal wasfiltered (120–200 Hz) and the
ripple-band amplitude was computed using the Hilbert transform. Ripple epochs with maximal amplitude higher than 4 SDs above the mean, begin-ning and ending at 1 SD, were detected. The time of ripple occurrence (Fig. 1I) was the time of its maximal amplitude.
Preplay Analyses Using Template-Matching Procedure. To analyze the preplay process, spiking events were detected during prerun sleep/rest periods in the
sleep box (velocity<1 cm/s). Only the spiking events detected in the sleep/rest
session before the naïve animalsfirst ran on track 1 were used throughout
this study. A spiking event was defined as a transient increase in the
multi-unitfiring activity of a population of at least six different pyramidal cells
within a temporal window preceded and followed by at least 100 ms of silence that delimited the beginning and end of the event. The spikes of all the place cells active on the novel track that were emitted during the prerun sleep in the box were sorted by time and further used for the detection of
the spiking events. All three naïve animals exhibited a significant number of
spiking events in the prerun sleep/rest session. The time of the spiking events used to compute the cross-correlation with the ripple epoch occurrence (Fig. 1I) was the average time of all spikes composing the individual spiking events. Place cell sequences (templates) were calculated for each direction of
the animal’s movement and for each run session for each track by ordering
the spatial location of the placefield peaks that corresponded to the peak
firing rate for each cell above 1 Hz on that track. In the three-track maze design, the spiking events were detected during sleep/rest using the spiking activity of all of the recorded CA1 pyramidal cells regardless of them later
becoming place cells on the linear tracks or not. For place cells withfields
above 1 Hz on more than one track, only the placefield corresponding to
the peakfiring rate of the place cell on a particular track was considered for
the construction of the template of that particular track; individual cells
could participate in the construction of templates of the other tracks.
Sta-tistical significance was calculated for each event by comparing the
rank-order correlation between the sequence of cellfiring in the event (i.e., event
sequence) and the place cell sequence (template) on one hand, and the distribution of correlation values between the event sequence and 500
surrogate templates obtained by shuffling the order of place cells on the
other (Fig. 1G). The significance level was set at 0.025 to control for multiple
comparisons (two directions of the run). The proportions of significant
preplay events were calculated as the ratio between the number of signif-icant events and the total number of spiking events in which at least six pyramidal cells were active.
The overall significance of the preplay (Fig. 1 G and H) was calculated by
comparing the set of absolute correlation values (and scores) of all events relative to the original template with each of the 500 sets of absolute
cor-relation values (and scores) relative to the shuffled surrogate templates
using the rank-sum test.
Bayesian Decoding of Spatial Trajectories. For each cell, we calculated a line-arized spatial tuning curve on the novel track during run sessions. Tuning curves were constructed in 2-cm bins from spikes emitted in both run directions at velocities higher than 5 cm/s, and were smoothed with a Gaussian kernel with an SD of 2 cm. We also detected for each cell all of the spiking activity emitted during the spiking events detected during prerun sleep/rest using the rank-order correlation method. We used a Bayesian reconstruction algorithm to decode the position of the animal from the spiking activity during the run (Fig. 1C) and during sleep/rest (Fig. 1F) in nonoverlapping 250-ms and 20-ms bins, respectively, using the spatial tuning curves (5, 11, 12). The error of the Bayesian decoding during the run was calculated for each time bin as the absolute value of the difference between the spatial position of the maximum decoded probability and the actual
position of the animal within that bin. To test for the significance of the
decoding during the run, we used two types of shuffles (time bin and
sition bin) of the original probability distribution of the reconstructed
po-sition (PDRP). The shuffling was repeated 500 times for each type. In parallel,
we extracted epochs of reconstructed trajectory matching the time of the spiking events as detected using multiunit activity (rank-order correlation method; Preplay Analyses Using Template-Matching Procedure). We simi-larly used two shuffling procedures to measure the quality of the Bayesian decoding during sleep. First, for each event, the original time-bin columns of the PDRP during sleep were replaced with an equal number of time-bin columns randomly extracted from a pool containing the time-bin columns of
all PDRPs of all detected events. The shuffling procedure was repeated 500
times. Second, for each event, the position bins of the original PDRP were
independently shuffled 500 times. For all original and shuffled PDRPs, a line
wasfit to the data using a previously described line-finding algorithm (12)
that specifies a future linear trajectory on the novel track. The best linear fit
was calculated for each event (12) as the preplay score corresponding to the mean estimated likelihood that the animal was on the preplayed trajectory.
The scores of linesfitted to the original data were compared with the
dis-tributions of scores of shuffled data (12). The trajectory was defined across a set of position estimates during the corresponding epoch (Fig. 1F). Only epochs that lasted between 80 ms and 1.2 s and that contained recon-structed trajectories spanning at least 25 cm were considered for further
analysis. An epoch was considered significant if the original preplay score
exceeded the 99th percentile of both the time-bin and position-bin shuffled
distributions of preplay scores.
Estimation of the Network Capacity for Preplay. About 20% of the detected spiking events represented preplay of the three tracks with no overlap across
the three tracks (Fig. 3A). The remaining∼80% of the sequences were
as-sumed to represent additional capacity of the hippocampal network to
re-present new tracks in the given context. Because each track specifically
correlated with 6–7% of the spiking events, with minimal overlap (a total of
an additional 1.5% of events), we estimated how many additional tracks the
remaining∼80% of events could preplay.
The function relating the proportion of preplay events to the number of novel linear tracks was calculated based on the three tracks explored (Fig. 3A) and was extrapolated using Matlab (MathWorks) as a polynomial (i.e., spline) function (Fig. 3C) and as a linear function. The extrapolation used step increases in the proportion of preplay events out of the total number of spiking events detected during sleep/rest for the three tracks to estimate the total number of linear tracks that could be simultaneously and distinctly
preplayed in the given spatial context by the remaining∼80% of events. The
linear and polynomial extrapolations resulted in similar numbers of linear
tracks being estimated. This estimate depends on the proportion of specific
preplay events per track and the amount of overlap between pairs of tracks
(i.e., preplay specificity) calculated for the range of a minimum of 6–10 cells
per event that was common in our datasets. Changes in these parameters will affect the estimate of the network capacity to preplay additional tracks. The total number of recorded neurons will also likely affect these estimates, with more neurons being expected to increase the overall network capacity. ACKNOWLEDGMENTS. We thank S. P. Layton for comments. This work was supported by National Institutes of Health Grants R01-MH078821 and P50-MH58880 and the RIKEN Brain Science Institute (S.T.).
1. O’Keefe J, Dostrovsky J (1971) The hippocampus as a spatial map. Preliminary evi-dence from unit activity in the freely-moving rat. Brain Res 34(1):171–175. 2. Lee AK, Wilson MA (2002) Memory of sequential experience in the hippocampus
during slow wave sleep. Neuron 36(6):1183–1194.
3. Kudrimoti HS, Barnes CA, McNaughton BL (1999) Reactivation of hippocampal cell assemblies: Effects of behavioral state, experience, and EEG dynamics. J Neurosci 19(10):4090–4101.
4. Foster DJ, Wilson MA (2006) Reverse replay of behavioural sequences in hippocampal place cells during the awake state. Nature 440(7084):680–683.
5. Dragoi G, Tonegawa S (2011) Preplay of future place cell sequences by hippocampal cellular assemblies. Nature 469(7330):397–401.
6. Samsonovich A, McNaughton BL (1997) Path integration and cognitive mapping in a continuous attractor neural network model. J Neurosci 17(15):5900–5920. 7. Dupret D, O’Neill J, Pleydell-Bouverie B, Csicsvari J (2010) The reorganization and
reactivation of hippocampal maps predict spatial memory performance. Nat Neurosci 13(8):995–1002.
8. Ji D, Wilson MA (2007) Coordinated memory replay in the visual cortex and hippo-campus during sleep. Nat Neurosci 10(1):100–107.
9. Diba K, Buzsáki G (2007) Forward and reverse hippocampal place-cell sequences during ripples. Nat Neurosci 10(10):1241–1242.
10. Gupta AS, van der Meer MA, Touretzky DS, Redish AD (2010) Hippocampal replay is not a simple function of experience. Neuron 65(5):695–705.
11. Zhang K, Ginzburg I, McNaughton BL, Sejnowski TJ (1998) Interpreting neuronal population activity by reconstruction: Unified framework with application to hippo-campal place cells. J Neurophysiol 79(2):1017–1044.
12. Davidson TJ, Kloosterman F, Wilson MA (2009) Hippocampal replay of extended ex-perience. Neuron 63(4):497–507.
13. Hebb DO (1949) The Organization of Behavior: A Neuropsychological Theory (Wiley, New York).
14. Brown TI, Ross RS, Keller JB, Hasselmo ME, Stern CE (2010) Which way was I going? Contextual retrieval supports the disambiguation of well learned overlapping navi-gational routes. J Neurosci 30(21):7414–7422.
15. Schacter DL, Addis DR, Buckner RL (2008) Episodic simulation of future events: Con-cepts, data, and applications. Ann N Y Acad Sci 1124:39–60.
16. Tse D, et al. (2007) Schemas and memory consolidation. Science 316(5821):76–82. 17. Hassabis D, Kumaran D, Vann SD, Maguire EA (2007) Patients with hippocampal
amnesia cannot imagine new experiences. Proc Natl Acad Sci USA 104(5):1726–1731. 18. Erdem UM, Hasselmo M (2012) A goal-directed spatial navigation model using
for-ward trajectory planning based on grid cells. Eur J Neurosci 35(6):916–931. 19. Wilson MA, McNaughton BL (1993) Dynamics of the hippocampal ensemble code for
space. Science 261(5124):1055–1058.
20. Csicsvari J, Hirase H, Czurkó A, Mamiya A, Buzsáki G (1999) Oscillatory coupling of hippocampal pyramidal cells and interneurons in the behaving rat. J Neurosci 19(1): 274–287.
NEUROSCI
Supporting Information
Dragoi and Tonegawa 10.1073/pnas.1306031110
-1 -0.5 0 0.5 1 0 1000 2000 3000 -100 p<10
Correlation value
Number
o
f
e
vents
Fig. S1. Quantification of preplay in the rat using all spike analysis. Distribution of correlation values between spiking events and the place cell sequence for all
events occurring during the prerun sleep/rest in three animals. For each spike used in the spiking event to compute the correlation, its associated place cell rank
order was entered in the place cell sequence. Open bars, spiking events vs. the original (unshuffled) templates; filled black bars, spiking events vs. 500 shuffled
templates scaled down 500 times; red bars, distribution of preplay (i.e., significant) events. The P value reflects the minimum significance level (i.e., the largest
P value) of the difference between the original set (open bars) and any of the 500 sets of shuffled (black bars) correlation values using the rank-sum test.
-1 -0.5 0 0.5 1 0 10 20 30 40 -1 -0.5 0 0.5 1 0 100 200 300 -1 -0.5 0 0.5 1 0 400 800 1200 Data
.
.
ShuffleSignificantCorrelation value
Number
o
f
e
vents
Data.
.
ShuffleSignificant Data.
.
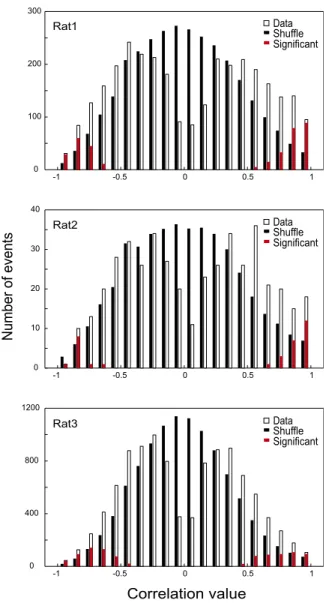
ShuffleSignificant Rat3 Rat2 Rat1Fig. S2. Quantification of the preplay phenomenon in individual rats. Distribution of correlation values between spiking events and place cell sequence on the
novel track for all events occurring during the prerun sleep/rest for rat 1 (Top), rat 2 (Middle), and rat 3 (Bottom). Open bars, spiking events vs. the original
(unshuffled) templates; filled bars, spiking events vs. 500 shuffled templates scaled down 500 times; red bars, distribution of preplay (i.e., significant) events. A
total of 11.8% of events were significant preplay in rat 1 (368 significant per 3,095 events; P < 10−130, binomial probability test), 7.7% in rat 2 (34/441; P< 10−8),
Number
of
events
Reconstruction score
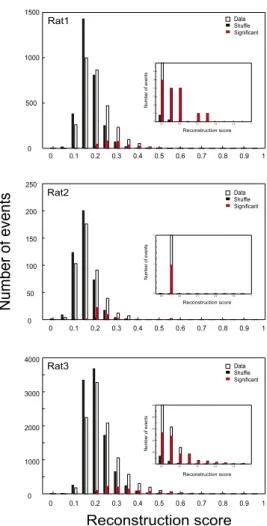
Number of events Numb e ro fe v ents N um ber o f even ts Reconstruction score Reconstruction score Reconstruction score Data . .ShuffleSignificant Data . .ShuffleSignificant Data . .ShuffleSignificant Rat3 Rat2 Rat1 0 0.1 0.2 0.3 0.4 0.5 0.6 0.7 0.8 0.9 1 0 500 1000 1500 0 0.1 0.2 0.3 0.4 0.5 0.6 0.7 0.8 0.9 1 0 50 100 150 200 250 0 0.1 0.2 0.3 0.4 0.5 0.6 0.7 0.8 0.9 1 0 1000 2000 3000 4000 0.5 0.6 0.7 0.8 0.9 1 0 1 2 3 4 5 6 7 0.5 0.6 0.7 0.8 0.9 1 0 1 2 0.5 0.6 0.7 0.8 0.9 1 0 20 40 60 80 100 5Fig. S3. Quantification of the decoding of future spatial trajectories in individual rats. Distribution of decoding scores for the virtual novel track trajectories
for all events occurring during the prerun sleep/rest for rat 1 (Top), rat 2 (Middle), and rat 3 (Bottom). Bars are as in Fig. 1H. (Insets) Enlarged display of the
distribution for corresponding score values between 0.5 and 1. A total of 2.7% (5.4%) of events showed significant decoding of the future trajectories in rat 1
at P< 0.01 (P < 0.025): 80 (160) significant per 2,945 events, P < 10−14(P< 10−19), binomial probability test; 2.3% (5.6%) in rat 2: 10 (24) per 426, P< 0.008 (P <
0.0002); 4.5% (8%) in rat 3: 412 (735) per 9,159, P< 10−130(P< 10−155).
..
..
Track 3
.
Track 1
Track 2
.
..
Tracks 2&3
.
Tracks 1&2
Tracks 1&3
.
.
Tracks 1&2&3
.
.
No track
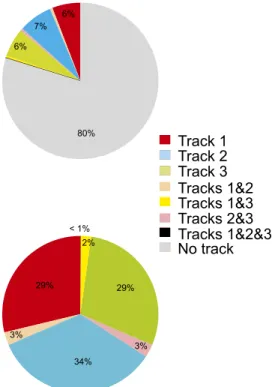
6% 7% 6% 80% 29% 3% 34% 3% 29% 2% < 1%Fig. S4. Proportion of preplay events in the three-track maze. Proportion of preplay events correlated with at least one track (see legend for color code) out
of all detected spiking events using all pyramidal cells regardless of their placefield activity on the three tracks (Upper) and out of all preplay events (Lower)
detected as above during prerun sleep/rest in the three rats (n= 768 events preplaying track 1 only, n = 920 events preplaying track 2 only, n = 781 events
preplaying track 3 only, n= 72 events preplaying tracks 1 and 2 only, n = 71 events preplaying tracks 2 and 3 only, n = 56 events preplaying tracks 1 and 3 only,