HAL Id: hal-00318054
https://hal.archives-ouvertes.fr/hal-00318054
Submitted on 3 Jul 2006
HAL is a multi-disciplinary open access
archive for the deposit and dissemination of
sci-entific research documents, whether they are
pub-lished or not. The documents may come from
teaching and research institutions in France or
abroad, or from public or private research centers.
L’archive ouverte pluridisciplinaire HAL, est
destinée au dépôt et à la diffusion de documents
scientifiques de niveau recherche, publiés ou non,
émanant des établissements d’enseignement et de
recherche français ou étrangers, des laboratoires
publics ou privés.
Relationships between electron density, height and
sub-peak ionospheric thickness in the night equatorial
ionosphere
K. J. W. Lynn, T. J. Harris, M. Sjarifudin
To cite this version:
K. J. W. Lynn, T. J. Harris, M. Sjarifudin. Relationships between electron density, height and
sub-peak ionospheric thickness in the night equatorial ionosphere. Annales Geophysicae, European
Geosciences Union, 2006, 24 (5), pp.1343-1353. �hal-00318054�
Ann. Geophys., 24, 1343–1353, 2006 www.ann-geophys.net/24/1343/2006/ © European Geosciences Union 2006
Annales
Geophysicae
Relationships between electron density, height and sub-peak
ionospheric thickness in the night equatorial ionosphere
K. J. W. Lynn1, T. J. Harris2, and M. Sjarifudin31Ionospheric Systems Research, Noosaville, Australia
2Defence Science & Technology Organisation, P.O. Box 1500, Edinburgh, Australia 3National Institute for Aeronautics and Space (LAPAN), Bandung, Indonesia
Received: 10 August 2005 – Revised: 19 December 2005 – Accepted: 9 January 2006 – Published: 3 July 2006 Part of Special Issue “The 11th International Symposium on Equatorial Aeronomy (ISEA-11), Taipei, May 2005”
Abstract. The development and decay of the southern
equa-torial anomaly night-time peak in electron density as seen at a number of ionosonde reflection points extending from New Guinea and Indonesia into northern Australia was examined in terms of the characteristic rise and fall in height associ-ated with the sunset ionisation-drift vortex at the magnetic equator. The observations relate to measurements made in November 1997. Following sunset, the ionospheric profile was observed to narrow as the maximum electron density increased during a fall in height that took the peak of the layer at Vanimo and Sumedang down to some 240 km. The fall was followed by a strong rise in which the electron den-sity sub-peak profile expanded from a slab width (as given by POLAN) of 20 km to over 100 km with no corresponding change in peak electron density. The post-sunset equatorial fall in height and associated changes in profile density and thickness continued to be seen with diminishing amplitude and increasing local time delay in moving from the anomaly peak at Vanimo to the southernmost site of observation at Townsville. Secondary events on a lesser scale sometimes occurred later in the night and may provide evidence of the multiple vortices suggested by Kudeki and Bhattacharyya (1999). Doppler measurements of vertical velocity as seen at Sumedang in Java are compared with the observed changes in electron density profile in the post-sunset period. The nor-mal post-sunset variation in ionospheric parameters was dis-rupted on the night of 7 November, the night before a nega-tive ionospheric storm was observed.
Keywords. Ionosphere (Equatorial ionosphere, Ionospheric
disturbances, Electric fields and currents)
Correspondence to: K. J. W.Lynn
(kenjwlynn@bigpond.com)
1 Introduction
An upward vertical drift of ionisation characteristically oc-curs at equatorial latitudes around sunset at F2 heights in the ionosphere. A post-sunset reversal from upward to down-ward vertical drift follows later in the night (Fejer, 1991; Fejer et al., 1995). There is an accompanying lift and fall in F2 layer height associated with the changing drift pat-tern. At Southeast Asian longitudes, the phenomenon is usu-ally most evident near the equinoxes. More recently, inco-herent scatter radar measurements at Jicamarca (Kudeki and Bhattacharyya, 1999) and satellite measurements (Eccles et al., 1999) have produced a more detailed picture of chang-ing plasma drifts with height through the sunset period and into the night. These measurements show that the upward and downward drifts at F2 heights pre-midnight are part of a larger vortex pattern centered at some 250 km in height and around 20 LT in time. As originally suggested by Tsunoda, 1981, the base of the vortex is formed by a westward drift in the E region which corresponds to an eastward drift at F2 heights. The existence of a vortex in E×B drift implies a divergent field structure with E field vectors pointing to a negatively charged core region (Kudeki and Bhattacharyya, 1999).
While the vertical component of drift associated with sun-set has long been known to be the result of E×B forces, a full theoretical explanation has been more difficult to deter-mine. The upward drift which produces the daytime equa-torial anomaly is produced by eastward electric fields gen-erated in the E region. The resurgence of the equatorial anomaly at night associated with an increase in vertical drift around sunset and its subsequent reversal is a more complex phenomenon involving both E and F region dynamos. The-ories to explain the observed vortex motion are discussed by
1344 K. J. W. Lynn et al.: Relationships between electron density, height and sub-peak ionospheric thickness
Fig.1. Location of ionosondes and reflection points.
18
Fig. 1. Location of ionosondes and reflection points.
Eccles (1998). An empirical global equatorial model of F region vertical drift has been prepared by Scherliess and Fe-jer (1999) based on radar and satellite measurements. The dependence of post-sunset vertical drift magnitude on solar flux is discussed by Whalen (2004).
In daytime, ionisation lifted by E×B forces at the mag-netic equator diffuses down the field lines where it accumu-lates forming the equatorial anomaly which consists of twin peaks of electron density in the F2 region symmetrically dis-posed around the magnetic equator. Although the magni-tude of the night-time equatorial anomaly still depends on the strength of the post-sunset vertical drift (Whalen, 2004), the build-up of the anomaly itself occurs mainly during the post-sunset reversal to downward drift associated with the eastern side of the sunset vortex. Balan and Bailey, 1995 re-fer to this as the reverse plasma fountain and illustrate the subsequent development of the night-time anomaly as given by the Sheffield University plasmasphere-ionosphere model. The post-sunset period is also marked by the development of equatorial bubbles produced by the Rayleigh-Taylor in-stability. These bubbles are often seen as Equatorial Spread F (EQSF). The occurrence of such bubbles reaches a maxi-mum when the sunset terminator aligns with the Earth’s mag-netic field lines (Tsunoda, 1985). This alignment occurs near the equinoxes where the Earth’s magnetic field declination is small as at Southeast Asian longitudes. Outstanding prob-lems in the relationship between the post-sunset height rise and fall and the occurrence of equatorial spread F are dis-cussed by Abdu (2001).
This paper examines the relationships between foF2, vir-tual and true height, sub-peak slab thickness and Doppler shift in reflected radio signals in the post sunset ionosphere as seen by ionosondes near the peak of the night equatorial anomaly. The ionosondes were situated at various sites in and to the north of Australia. These latitudes cover an area where variations in observed ionospheric characteristics at any given time are largely associated with the development and magnitude of the day and night equatorial anomalies which in turn are driven by changes in ionisation drift at the magnetic equator.
2 Observing sites
Sites and paths of vertical and oblique ionosondes discussed in this paper are shown in Fig. 1. The vertical ionosondes at Vanimo and Townsville were operated by the Australian Ionospheric Prediction Service (IPS). Oblique ionosondes were operated by the Australian Defence Science and Tech-nology Organisation (DSTO) between a transmitter at Van-imo and receivers at Darwin and Townsville. All other oblique path ionograms were obtained with DSTO equip-ment. A KEL IPS71 ionosonde at Sumedang (also called Tanjungsari) in Java was operated by the Indonesian Na-tional Institute for Aeronautics and Space (LAPAN). This ionosonde has the additional unique feature of being able to record high resolution Doppler ionograms.
K. J. W. Lynn et al.: Relationships between electron density, height and sub-peak ionospheric thickness 1345
Fig.2. Diurnal variations in foF2 at ionospheric reflection points of increasing latitude observed over the period 2-6 November 1997.
19
Fig. 2. Diurnal variations in foF2 at ionospheric reflection points of
increasing latitude observed over the period 2–6 November 1997.
3 Latitudinal variation in foF2
In early November, 1997, unusually large surges in post-sunset values of foF2 were observed at Vanimo. Data from other sites were sought in order to obtain some idea of the lat-itudinal and longlat-itudinal extent of these extreme variations. Ionograms over the oblique paths were converted to equiva-lent verticals from which foF2 could be obtained.
As seen in Fig. 2, post-sunset surges in foF2 were strongly present at Vanimo and over the oblique path Vanimo-Darwin. The peak values in foF2 at such times greatly exceeded foF2 values observed at any other time of day. Such surges, with diminishing magnitude, continued to be seen at reflection points further south. The surge on the night of 5 Novem-ber is particularly notable for being clearly visible at all sites. While post-sunset surges in foF2 were also present at Sumedang during this time, variations in the magnitude of the post-sunset surges at Sumedang were uncorrelated with those at the eastern sites.
It should be pointed out that while the post-sunset surges in foF2 seen at Vanimo and discussed here represent extreme examples, surges of lesser magnitude are normally present at
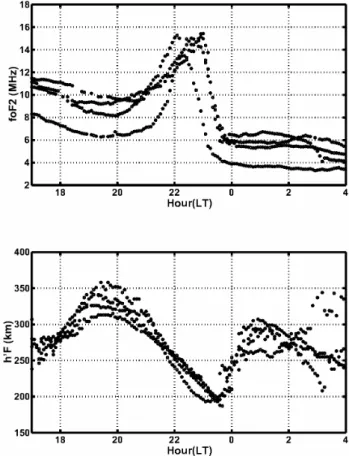
Fig.3. Superimposed variations in foF2 (upper) and h’F (lower) observed at Vanimo over the period 1-4 November 1997.
20 Fig. 3. Superimposed variations in foF2 (upper) and h0F (lower) observed at Vanimo over the period 1–4 November 1997.
magnetic latitudes corresponding to Vanimo and Sumedang. The post-sunset surge represents the time-dependent build up and decay of the night-time southern equatorial anomaly peak at these latitudes. The period discussed here (1– 8 November 1997) was one of relatively low sunspot number (39) rising from the sunspot minimum in 1995–1996.
4 Relations between electron density, height and
iono-spheric thickness
In Fig. 3, diurnal values of foF2 and ionospheric base height h0F at Vanimo are superimposed to demonstrate the time and magnitude consistency of the post-sunset surges in foF2 and the associated height variations. The pre-reversal increase in ionospheric height reached its maximum at approximately 19:30 LT. From there the ionosphere descended continuously for the next four hours before a relatively abrupt recovery starting at approximately 23:30 LT. The maximum electron density of the ionosphere as measured by foF2 builds up as the ionosphere falls reaching a peak around 22–23 LT before decreasing to steady night values by the time the fall in iono-spheric height has finished (just prior to local midnight).
1346 K. J. W. Lynn et al.: Relationships between electron density, height and sub-peak ionospheric thickness
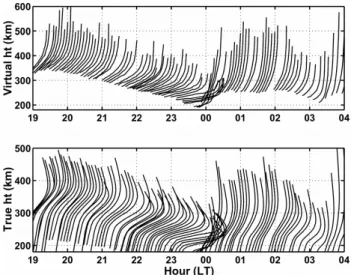
Fig.4. Ionograms (upper) and the derived true height profiles given by POLAN (lower) measured on the night of 4 November 1997 and plotted as a function of time.
21 Fig. 4. Ionograms (upper) and the derived true height profiles given
by POLAN (lower) measured on the night of 4 November 1997 and plotted as a function of time.
The program POLAN (Titheridge, 1988) was used to con-vert virtual height to true height. Virtual and true height electron density profiles (expressed as a plasma frequency) are shown in Fig. 4 as obtained at Vanimo on the night of 4 November. Here a sharpening of the ionospheric profile is seen to be associated with an increase in maximum elec-tron density as the ionosphere falls. An abrupt recovery to a broader profile with an increase in peak height occurs at the end of the fall in height. This post-reversal recovery in peak height and profile thickness was not associated with any par-ticular change in foF2.
There is a new fall in ionospheric height with an associ-ated sharpening of the profile and subsequent recovery in the period 01–03 LT which will be discussed further in Sect. 7. While much weaker than the previous surge, this lesser event exhibits the same characteristics in all parameters and is typi-cal of such events occasionally observed to occur in the post-midnight period.
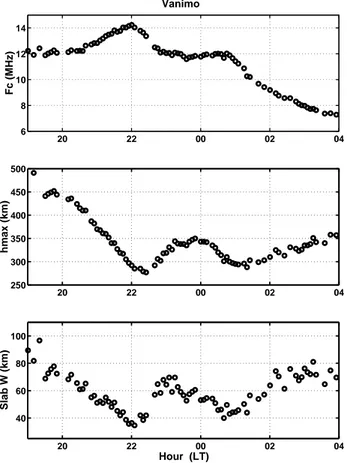
A selection of maximum ionospheric electron density val-ues (measured as a critical frequency) and base (h0f) or true height (hmF2) values is given in Figs. 5a–e as a function of time. Figures 5a, d and, e show the calculated results of POLAN for both the magnitude and variation in true height of the maximum electron density value as well as the equiv-alent slab thickness W of the sub-peak ionosphere. Here the slab thickness W uses the definition given by POLAN as the integrated sub-peak electron density divided by the peak electron density. As such it is a measure of the profile width between the base of the F2 layer and the layer peak.
As seen at Vanimo in Fig. 5a (4 November 1997), The fall in ionospheric peak height (hmF2) begins at 19:00 LT and continues over a 3.8-h period at a rate increasing from some 7 m/s to 14 m/s (12 m/s average). An abrupt recovery to a
broader profile with an increase in peak height commences at 23:30 LT. This recovery lasted some 25 min with an aver-age rise velocity of 67 m/s. The fall in height of the peak F2 electron density from 400 km to 240 km is accompanied by a reduction in sub-peak slab thickness W by a factor of three. A similar variation was seen at Sumedang on 1 Novem-ber 1997, although here the maximum increase in electron density is seen to be less. Both Vanimo and Sumedang lie near the peak of the southern equatorial night-time anomaly. The fall in peak layer height at both Vanimo and Sumedang ended at a height around 240 km. At this time, the difference between base and peak F2 layer height at Vanimo was about 50 km. The maximum in foF2 values occurred as the layer peak fell below some 250–270 km. The subsequent reduction in foF2 can be attributed to the rapid increase in recombina-tion rate at these low heights. Thus the exact time at which the foF2 values peak can be expected to occur may depend on the rapidity with which the height falls. There was a lesser though similar variation of all three parameters with a shift in occurrence to later in the night on 4 November 1997 at the southernmost site of Townsville (Fig. 5d).
True height profiles for the oblique path from Vanimo to Townsville and at Darwin were not available but variations in maximum frequency and minimum time delay (Fig. 5b, 4 November 1997) and base F2 virtual height h0F (Fig. 5c, 5 November 1997) are included to show that there was a similar relationship between falling height and surging max-imum frequency at these ionospheric reflection points.
5 Latitudinal time variation
A time shift is evident between Vanimo and Townsville surge events on 4 November 1997 shown in Fig. 5. Verification of this feature as a consistent result was obtained by superim-posing a number of base ionospheric height variations (h0F) measured at Vanimo, Darwin and Townsville over the same nights with results shown in Fig. 6.
Peak ionospheric base height at Vanimo is seen to occur within two hours of ground-sunset. The subsequent fall in height ends just before local midnight. At Darwin, the peak height is reached some three to four hours after local ground-sunset and the fall in height finishes just after local midnight. At the southernmost site of Townsville, the peak height is reached slightly later than at Darwin and the subsequent fall ends between one and two hours after local midnight.
6 Doppler observations at Sumedang
The Kel IPS71 ionosonde at Sumedang recorded Doppler ionograms at a 15-min rate. At each sweep frequency a Doppler Spectrum was taken and the Doppler frequency with the maximum amplitude value was recorded. These Doppler
K. J. W. Lynn et al.: Relationships between electron density, height and sub-peak ionospheric thickness 1347
Fig.5. Fc, hmF2 and sub-peak slab width W measured at Vanimo, Sumedang and
Townsville. Fmax and time delay observed over the oblique path Vanimo-Townsville and
FoF2 and h’F observed at Darwin.
22
Fig. 5. Fc, hmF2 and sub-peak slab width W measured at Vanimo, Sumedang and Townsville. Fmaxand time delay observed over the oblique path Vanimo-Townsville and foF2 and h0F observed at Darwin.
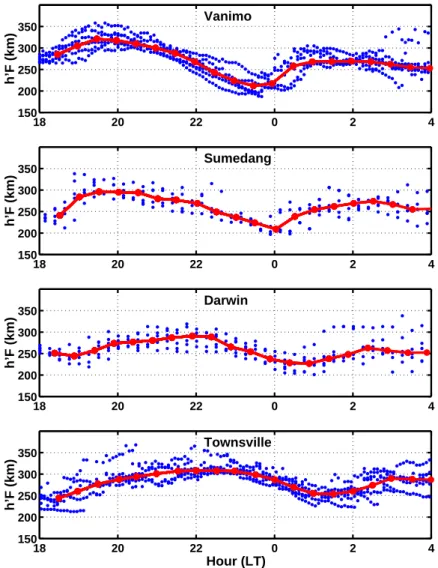
1348 K. J. W. Lynn et al.: Relationships between electron density, height and sub-peak ionospheric thickness 18 20 22 0 2 4 150 200 250 300 350 Vanimo h’F (km) 18 20 22 0 2 4 150 200 250 300 350 Sumedang h’F (km) 18 20 22 0 2 4 150 200 250 300 350 Darwin h’F (km) 18 20 22 0 2 4 150 200 250 300 350 Townsville Hour (LT) h’F (km)
Fig. 6. Superimposed values of h0F (base ionospheric F2 virtual height) as a function of time showing the delay in the post sunset fall in height with increasing distance from the equator as observed over a number of days. Median values are shown in red.
values were converted to equivalent virtual vertical velocity (v) values using the usual formula
v = −c.ν/(2.f )
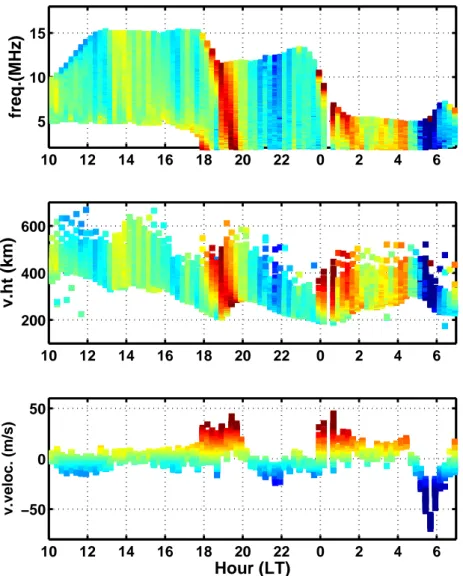
where c is the speed of light, ν the observed Doppler fre-quency shift from the transmitted frefre-quency and f is the op-erating frequency. Plots of foF2 and virtual vertical velocity are given in Fig. 7 as measured on 1 November 1997. Ver-tical motion in this diagram is defined as being positive for upward velocities and downward for negative. The colour code for all vertical velocities may be read from the bottom panel of Fig. 7. Each vertical line in all three panels repre-sents the contents of one ionogram.
The fall in peak layer height at Sumedang on the night of 1 November 1997 commenced at 20:00 LT and, as measured from Fig. 5e, averaged 12 m/s over a period of 3.5 h. The downward drift then reversed to give an upward velocity of 39 m/s averaged over the following 30 min. These values are
consistent with the velocities shown in Fig. 7 as calculated from the concurrent Doppler frequency shift measurements.
If the F2 layer moved uniformly as a whole, a constant ve-locity would be observed independent of frequency through-out the ionosonde sweep. However this rarely happens as is indicated in Fig. 7 by the spread in virtual velocity within each ionogram, seen most clearly in the bottom panel. The observed Doppler shift at each sounding frequency is an in-tegrated function of ionisation change up to the reflection height (see discussion by Prabhakaran Nayar and Sreehari, 2004). In the present case, the variations in Doppler fre-quency and thus velocity appear to be dominated by changes in layer height. In Fig. 7, positive velocity values are as-sociated with the sunset preversal height rise and the re-covery from the pre-midnight fall occurring after midnight. This pattern repeated on successive nights whenever the post-sunset surge occurred.
K. J. W. Lynn et al.: Relationships between electron density, height and sub-peak ionospheric thickness 1349 10 12 14 16 18 20 22 0 2 4 6 5 10 15
freq.(MHz)
10 12 14 16 18 20 22 0 2 4 6 200 400 600v.ht (km)
10 12 14 16 18 20 22 0 2 4 6 −50 0 50Hour (LT)
v.veloc. (m/s)Fig. 7. Doppler derived vertical velocity plotted as a function of time (bottom), as a function of ionogram frequency (top) and virtual height
(middle). The colour code for velocity used throughout can be read from the bottom panel in relation to the time dependence of velocity. Data from Sumedang as observed on the 1 November 1997.
In the upper panel of Fig. 7, the frequency at which the peak velocity occurs is seen to move down from the criti-cal frequency to the lowest observed frequency during the period of post-sunset height rise between 18 to 20 LT. Dur-ing the subsequent fall in height over the period 21–22 LT, the greatest downward (negative) velocity was present at the highest frequency (peak of the layer).
The lower panel of Fig. 7 shows a slight decrease in the downward velocity between 22–24 LT. This corresponds to a temporary reduction in the rate of fall of ionospheric base height at this time as seen in the middle panel of Fig. 7. The Doppler observations of Fig. 7 are consistent with those of the more limited Doppler measurement of Prabhakaran Na-yar and Sreehari (2004) made on the magnetic equator at Trivandrum. The velocities observed during the post-sunset rise and subsequent fall and recovery in height were the
highest values of velocity observed over the 24-h period ex-cept for those associated with sunrise.
7 Post-midnight events
In recent years much theoretical work has gone into explain-ing the post-sunset height rise and the followexplain-ing reversal. Until recently it has been taken for granted that these changes are necessarily and uniquely associated with sunset condi-tions at the magnetic equator. However Fig. 5a provides an example of a Vanimo event commencing and finishing after midnight which is identical except in scale to the changes as-sociated with sunset on this day. For this secondary event, the average velocity of the fall in peak height over a 1.4-h period from 01:30 LT was some 15.5 m/s with a subsequent average rise velocity over 30 min of 64 m/s. These values
1350 K. J. W. Lynn et al.: Relationships between electron density, height and sub-peak ionospheric thickness 20 22 00 02 04 6 8 10 12 14 Vanimo Fc (MHz) 20 22 00 02 04 250 300 350 400 450 500 hmax (km) 20 22 00 02 04 40 60 80 100 Hour (LT) Slab W (km)
Fig. 8. Ionospheric critical frequency F c, peak height hmF2 and
sub-peak slab width W observed at Vanimo on 24 February 1999 showing multiple similar events.
are essentially the same as those seen in the preceding sunset associated rise and fall. Although the increase in foF2 ac-companying the fall in ionospheric height and in ionospheric thickness is small in absolute terms with respect to the sunset event at Vanimo, it is still large in relative terms (about a 20% increase in foF2) because of the lower values of electron den-sity at this time. Apart from its lesser magnitude, this event is identical to the much stronger event associated with sunset which in turn represents the normally expected build-up and decay of the southern peak of the equatorial anomaly.
The post-midnight event on this night at Vanimo is also visible at Townsville (Fig. 5d) and, less clearly, on the path from Vanimo to Townsville (Fig. 5b). The time delay in the commencement of this event increased with latitude with the Townsville event occurring some 45 min after the event at Vanimo. The Vanimo-Townsville event occurred with an in-termediate time delay consistent with its location. Such a strong correlation between all three measured parameters at all three sites over a distance of 2000 km in latitude would seem to require a major rise and fall in vertical ionisation drift at the southern peak of the equatorial anomaly with resultant delayed changes in distributed ionisation from the anomaly peak to its southernmost edge. Clearly such a possible
correlation requires further investigation over a larger num-ber of events.
Examination of a large number of Range-Time plots of h0F taken from low latitude ionosonde sites over a number of years indicate that such secondary phenomena are far from unusual. An example of true height data given by POLAN is shown in Fig. 8 as observed at Vanimo on the night of 24 February 1999. The post-sunset event follows the usual decrease in height, decrease in slabwidth, increase in foF2 and subsequent recovery over the period 20:00–24:00 LT, as described above. But this event is immediately followed by another which is identical in form though diminished in scale over the period 00:00–02:00 LT.
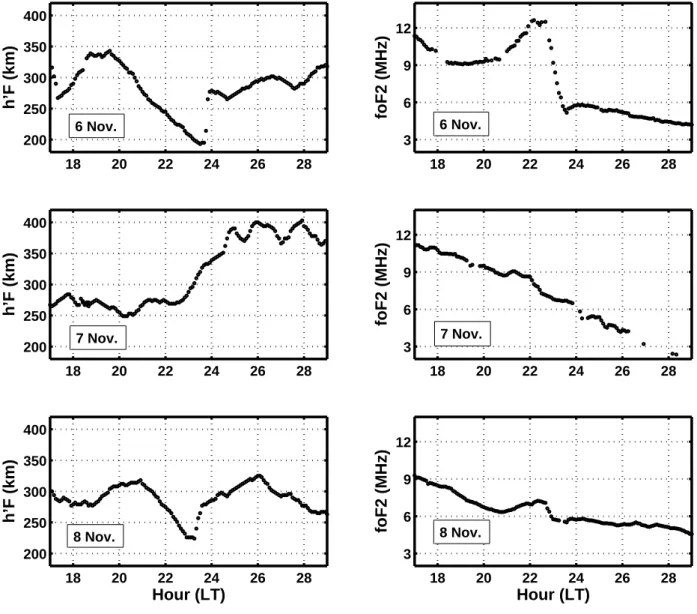
8 Ionospheric storm effects 6–7 November 1997
The patterns of foF2 and virtual height variation shown in Fig. 4 were consistent up to the night of 7 November. This was the night preceding a major low latitude negative iono-spheric storm observed during daylight hours on the follow-ing day of 8 November. This storm was one of several dis-cussed by Lynn et al. (2004). The negative storms there de-scribed are attributed to chemical changes produced by au-roral up-welling reaching the equatorial region as driven by equatorward winds.
Observations of the sunset period over three days centred on the 7 November, 1997 at Vanimo are shown in Fig. 9. The normal post-sunset variations in h0f and foF2 occurred at Vanimo on the 6th and 8th. However no increase and subse-quent decrease in post-sunset virtual height occurred on the evening of 7 November. Instead, following sunset, a slow rise in height occurred over a period of several hours dur-ing which the values of foF2 declined steadily with no sign of post-sunset surging. This may well be the diurnal varia-tion when the night anomaly is absent and the usual zonal drift has stopped or reversed as a precursor to the negative ionospheric storm effect. On the following negative storm day, the day-time anomaly also failed to develop indicating a failure of the normal electrojet and fountain effect. How-ever the ionosphere showed a partial recovery to its normal post-sunset variation on the following night.
9 Discussion
This paper shows the relationship between the four param-eters foF2, hmF2, sub-peak ionospheric slab thickness W and Doppler velocity during the build-up and decay of the night-time equatorial anomaly. Moreover the same relations in Fig. 6 are seen to be exhibited with diminishing intensity and increasing time delay as the latitude of the ionosonde increases from the night equatorial anomaly peak (Vanimo and Sumedang) to higher latitudes (Darwin and Townsville). The post-sunset surges in peak ionospheric critical frequency and the associated fall in ionospheric height continue to play
K. J. W. Lynn et al.: Relationships between electron density, height and sub-peak ionospheric thickness 1351 18 20 22 24 26 28 200 250 300 350 400
h’F (km)
18 20 22 24 26 28 200 250 300 350 400h
’F (km)
18 20 22 24 26 28 200 250 300 350 400Hour (LT)
h
’F (km)
18 20 22 24 26 28 3 6 9 12foF2 (MHz)
18 20 22 24 26 28 3 6 9 12foF2 (MHz)
18 20 22 24 26 28 3 6 9 12Hour (LT)
foF2 (MHz)
6 Nov. 6 Nov. 7 Nov. 7 Nov. 8 Nov. 8 Nov.Fig. 9. Variations in base ionospheric height h0F and foF2 at Vanimo over the period 6–8 November 1997. Normal sunset vortex behaviour on the 6 November was stopped on the night of the 7 November preceding a negative ionospheric storm day. A partial recovery occurred on the following night.
their part in modifying the night ionosphere at and near the equinoxes as far south as Northern Australia. These latitudes are near the southern limits of the area dominated by a strong night-time equatorial anomaly.
The low-latitude vertical drift model of Scherliess and Fe-jer (1999) indicates that the post-sunset time variation in ver-tical drift velocity at the magnetic equator has little or no longitudinal dependence. Comparing their results with the observations of Fig. 3 shows that the fall in height at the low-est latitude site of Vanimo, commencing in the period 19:00– 20:00 LT, corresponds well with a change to downward drift at the magnetic equator at this time as given by Scherliess and Fejer (1999).
Arecibo in Puerto Rico is comparable to Townsville in terms of magnetic latitude and dip. Many papers from Arecibo refer to the “midnight collapse” of the ionosphere at this location. An example is given by Crary and Forbes (1986, their Fig. 2) in which the fall in peak height, the nar-rowing of the electron density profile and subsequent height rise is evident. The late occurrence of the fall in height is consistent with the time variation shown here for Townsville suggesting that there is a consistent delay with increasing lat-itude from the time the post-reversal fall in height occurs at the magnetic equator and that this delay is present at all lon-gitudes.
1352 K. J. W. Lynn et al.: Relationships between electron density, height and sub-peak ionospheric thickness This paper shows post midnight events which mimic the
height, fof2 and ionospheric thickness variations associated with the sunset ionospheric vortex. The existence of this vor-tex now seems well-established. Kudeki and Bhattacharyya (1999) provide direct examples of the vortex drift in ionisa-tion associated with sunset at Jicamarca. They also provide some evidence for the subsequent development of secondary vortices and discuss possible causes. In contrast, Nicolls et al. (2004) provide an example of a night at Arecibo for which large oscillations in F2 layer height were recorded. Each fall in height associated with the first two oscillations is accom-panied by a surge in foF2 similar to that described here. The relationship of these oscillations with the normal “midnight collapse” is not directly commented upon. The second and larger rise and fall seems to have occurred at the expected time of such a collapse. Nicolls et al. (2004) attribute these oscillations to large-scale travelling ionospheric disturbances propagating equatorward from the auroral zone. However as noted in Sect. 7, the post midnight event seen on 4 November 1997 showed an increasing universal time delay with latitude and thus cannot be attributed to an equatorward TID unless it crossed the equator from the northern hemisphere..
C´ecile et al. (1996) show an example of a large scale post-midnight variation in ionospheric height at an equatorial site in Africa. It may be that there are a number of possible sources of such events and that irrespective of the cause of a rise and fall in ionospheric height at these latitudes, the observed results can be the same in terms of the parameters discussed here.
The relationship between falling height and a temporary rise in foF2 is a common feature in day-time as well as at night and is probably a generic feature of large-scale TIDs. As pointed out by Nicolls et al. (2004) in relation to such TIDs, if the F2 layer falls (poleward wind), the peak den-sity increases due to downward flux along dipping field lines and the layer also narrows due to recombination at the lower heights. The same result is produced by the sunset vortex al-though the latter is driven by electric fields. Difficulties of in-terpretation can thus arise when more than one phenomenon can produce a similar effect. In the light of these observa-tions, more attention should be directed to the causation of large scale height variations in the post-midnight period at equatorial and low latitudes.
Some confusion also arises as to whether the pre-reversal height rise occurs after or before sunset depending on the definition of sunset used. If ground sunset is taken as the cri-terion, the pre-reversal height rise occurs mainly after sunset. However sunset at F2 peak heights occurs some hours later and at Vanimo often corresponds to the time of maximum height rise. In this respect, the pre- reversal height rise occurs before sunset at the peak height of the F2 layer at Vanimo.
The strong Equatorial Spread F (EQSF) associated with the rise of post-sunset bubbles produced by the Rayleigh-Taylor instability were not obvious on any of the nights here described. Such bubbles typically develop at or shortly after
the peak height of the post-sunset ionosphere is reached. Ma-jor EQSF usually associated with bubbles was observed to occur at Vanimo closer to the equinoxes than the nights ex-amined here although the magnitude and duration of the pre-and post-reversal height variations were similar. This sug-gests that the occurrence of bubbles is more closely tied to the period in which the sunset terminator parallels the field lines. The occurrence of the pre-and post-reversal of sunset height variations seems to be less sensitive to this require-ment.
This paper raises a number of questions for further exper-imental investigation at low latitudes and Southeast Asian longitudes. These include
1. whether the abrupt recovery of the electron density pro-file in slab thickness and maximum height following the post-sunset reversal is present at the magnetic equator as well as at the southern anomaly peak and beyond 2. the seasonal variation of the post-sunset height rise and
fall and associated anomaly peak electron density 3. the sunspot cycle dependence.
4. the occurrence and ionospheric behaviour associated with major height rises and falls occurring later in the night
5. the relationship between ionosonde and satellite TEC measurements of the night-time equatorial anomaly These matters and others are under current investigation. Theoretical questions remain relating to the latitudinal and time-dependence of the observations discussed here. Acknowledgements. Topical Editor M. Pinnock thanks R. J.
Sten-ing for his help in evaluatSten-ing this paper.
References
Abdu, M. A.: Outstanding problems in the equatorial ionosphere– thermosphere electrodynamics relevant to spread F, J. Atmos. S.-P., 63, 869–884, 2001.
Balan, N. and Bailey, G. J.: Equatorial plasma fountain and its ef-fects: Possibility of an additional layer, J. Geophys. Res. (Space Physics), 100, 21 421–21 432, 1995.
C´ecile, J.-F., Vila, P., and Blanc, E.: HF radar observations of equa-torial spread-F over West Africa , Ann. Geophys., 14, 411–418, 1996.
Crary, D. J. and Forbes, J. M.: The dynamic ionosphere over Arecibo: a theoretical investigation, J. Geophys. Res., 91(A1), 249–258, 1986.
Eccles, J. V.: Modeling investigation of the evening prereversal en-hancement of the zonal electric field in the equatorial ionosphere, J. Geophys. Res., 103(A11), 26 709–26 720, 1998.
Eccles, J. V., Maynard, N., and Wilson, G.: Study of the evening plasma drift vortex in the low-latitude ionosphere using San Marco electric field measurements, J. Geophys. Res.,104(A12), 28 133–28 144, 1999.
K. J. W. Lynn et al.: Relationships between electron density, height and sub-peak ionospheric thickness 1353
Fejer, B. G.: Low latitude electrodynamic plasma drifts: a review, J. Atmos. S.-P., 53, 677–693, 1991.
Fejer, B. G., de Paula, E. R., Heelis, R. A., and Hanson, W. B.: Global equatorial ionospheric vertical drifts measured by the AE-E satellite, J. Geophys. Res., 100(A4), 5769–5776, 1995. Kudeki, E. and Bhattacharyya, S.: Postsunset vortex in equatorial
F-region plasma drifts and implications for bottomside spread-F, J. Geophys. Res., 104(A12), 28 163–28 170, 1999.
Lynn, K. J. W., Harris, T. J., and Sjarifudin, M.: Combined TOPEX/Poseidon TEC and ionosonde observations of negative ionospheric storms seen at low latitudes, Ann. Geophys., 22, 2837–2847, 2004.
Nicolls, M. J., Kelley, M. C., Coster, A. J., Gonz´alez, J. J., and Makela, S. A.: Imaging the structure of a large-scale TID using ISR and TEC data, Geophys. Res. Lett., 31, L09812, doi:10.1029/2004GL019797, 2004.
Prabhakaran Nayar, S. R. and Sreehari, C. V.: Investigation of height gradient in vertical plasma drift at equatorial ionosphere using multifrequency HF Doppler radar, J. Geophys. Res., 109, A12308, doi:10.1029/2004JA010641, 2004.
Scherliess, L. and. Fejer, B.G.: Radar and satellite global equatorial
Fregion vertical drift model, J. Geophys. Res., 104(A4), 6829– 6842, 1999.
Titheridge, J. E.: The real height analysis of ionograms: A general-ized formulation, Radio Sci., 23, 831–849, 1988.
Tsunoda, R. T., Livingston, R. C., and Rino, C. L.: Evidence of a velocity shear in bulk plasma motion associated with the post-sunset rise of the equatorial F-layer, Geophys. Res. Lett., 8, 807– 810, 1981.
Tsunoda, R. T.: Control of the seasonal and longitudinal occur-rence of equatorial scintillations by the longitudinal gradient in integrated E region Pedersen conductivity, J. Geophys. Res., 90, 447–456, 1985.
Whalen, J. A.: Linear dependence of the post sunset equato-rial anomaly electron density on solar flux and its relation to the maximum pre-reversal ExB drift velocity through its dependence on solar flux, J. Geophys. Res., 109, A07309, doi:10.1029/2004JA010528, 2004.

![[PDF] Tutoriel avancé pour applications Web Ruby On Rails | Formation informatique](data:image/gif;base64,R0lGODlhAQABAIAAAP///wAAACH5BAEAAAAALAAAAAABAAEAAAICRAEAOw==)