HAL Id: hal-03126065
https://hal.archives-ouvertes.fr/hal-03126065
Submitted on 1 Feb 2021
HAL is a multi-disciplinary open access
archive for the deposit and dissemination of
sci-entific research documents, whether they are
pub-lished or not. The documents may come from
teaching and research institutions in France or
abroad, or from public or private research centers.
L’archive ouverte pluridisciplinaire HAL, est
destinée au dépôt et à la diffusion de documents
scientifiques de niveau recherche, publiés ou non,
émanant des établissements d’enseignement et de
recherche français ou étrangers, des laboratoires
publics ou privés.
Grape harvest dates for checking NAO
paleoreconstructions
Annie Souriau, Pascal Yiou
To cite this version:
Annie Souriau, Pascal Yiou.
Grape harvest dates for checking NAO paleoreconstructions.
Geophysical Research Letters, American Geophysical Union, 2001, 28 (20), pp.3895-3898.
�10.1029/2001GL012870�. �hal-03126065�
Grape harvest dates for checking NAO paleoreconstructions
Annie SouriauCNRS, ¸bservatoire Midi-Pyrenees, Toulouse, France
Pascal Yiou
Laboratoire des Sciences du Climat et de l'Environnement, Gif-sur-Yvette, France
Abstract. Dates of the grape harvests in northeastern France growth starts in April of the next year, the blossoming period
and Switzerland exhibit significant correlations with the North is in June, and the harvest is in September-October. Thus,
Atlantic Oscillation (NAO), a large-scale mode of climate grape harvest dates certainly contain integrated information
variability ov..er North Atlantic. These correlations, established on local climatic conditions.
for the monthly values of the NAO index over the last 175 Here we analyze the relationships between harvest dates
years, reveal characteristic signatures as a function of and the NAO, and check whether it could be a useful proxy of
frequency. Conversely, these signatures may be used to test the long-term climatic variations. This is important because of the
robustness of existing NAO paleoreconstructions, thanks to the non-stationarity of NAO [Appenzeller et al., 1998], which
availability of harvest dates for northwestern Europe since the makes inefficient any reconstruction based on harmonic
end of the fifteenth century. Climatic signal appears prevailing analyses. The main advantage of the vine, in addition to its
over possible human factors in these series. The results climatic sensitivity, is its broad geographic extension in the
demonstrate the importance of including old instrumental data whole western Europe, and the availability of a great number
and of providing monthly values rather than annual means in of harvest dates records for at least five centuries.
the NAO reconstructions. They suggest that the available long In what follows, we first analyse the correlations between
harvest dates series could constitute an interesting proxy to an experimental NAO series and the grape harvest dates. Then constrain such reconstructions. we use some of these correlations to test three published NAO
paleoreconstructions. Introduction
A major source of variability in atmospheric circulation is
the North Atlantic Oscillation (NAO), which controls some of the decadal variations of climate over the North Atlantic,
Western Europe and the Middle-East [Rogers, 1984; Hurrell,
1995]. The NAO corresponds to a dipolar mode of Atlantic
circulation with high pressure at latitudes 35-40øN and low
pressure at northern latitudes. Its variability is represented by
an index, available for the last 175 years, which is defined as
the difference in normalized sea level pressures at two fixed
locations, one to the South (Azores [Rogers, 1984], Lisbon
[Hurrell, 1995], or Gibraltar [Jones et al., 1997; Osborn et al., 1999]), one in Iceland. Pressure anomalies have their
most important effects during the winter months [Hurrell, 1995]. Positive values of the NAO index correspond to stronger than normal westerlies onto Europe, inducing mild
and humid weather over northern Europe and parts of France,
whereas Mediterranean regions may be subject to drought
[Hurrell, 1995].
Because of its influence on climate, the NAO has a strong
signature on many biological processes, in particular on vine,
which is sensitive to temperature and precipitation at specific
periods of its vegetative cycle. This cycle spreads over two
years [Rosini, 1984]: in April rudimentary shoots appear. A dormant stage from August to November is followed by an active hibernation from December to February. The active
Copyright 2001 by the American Geophysical Union.
Paper number 2001GL012870. 0094-8276/01/2001GL012870505.00
Instrumental NAO data and grape harvest
datesSeveral complete experimental series of normalized monthly NAO values are available [Rogers, 1984; Hurrell,
1995; Jones et al., 1997]. They exhibit a rather good
consistency, mostly for the winter months, which include the
most important part of the coherent NAO variability. The summer indices are often considered as less climatically significant. We used the time series of Jones et al. [1997],
which is the longest one, going back to 1825. Fig. la shows
the mean annual NAO indices defined either over 12 months (from April to March of the next year), or over the winter months (December to February). As noted by previous studies [Rogers, 1984; Mann and Park, 1996], the dominant
frequencies vary with time. For the last, 170 years, the spectra
of the annual and winter means (Fig. lb) confirm the important decadal variability. For the winter mean index, the
main peaks of energy are observed at periods of about 2.4, 4.9
and 8 years, but the variability is large from one month to the
other. For spring (April), a strong energy is present at 3 years
and at a long period (T> 10 years).
We used a synthetic grape harvest date series obtained by
Le Roy Ladurie [1983] for the period 1484-1977. It
corresponds to the merging of five series from northeastern
France and two from French Switzerland. These regions
experience nearly the same climatic variations with respect to
the NAO. The mean values of the different series have been aligned to the mean of a reference series (Volnay, in Burgundy) before merging. Hence we do not have to consider the regional fluctuations of maturation, due to both local climatic influences and variations in vine phenology. A difficulty may come from the human influence on harvest 3895
3896 SOURIAU & YIOU: GRAPE HARVEST DATES FOR CHECKING NAO PALEORECONSTRUCTIONS a) 1825 1850 1875 1900 1925 1950 1975 2000 2 50 S 40 • 30 • 20 [10 q825 1850 1875 b) 20 10 5 4 3.3 2,5
Winter
(BJF)
t 10ø
90%cl 95% cl. Mean (April-March) n ø 10 • Harv d 1900 1925 1950 1975 2000 0.0 0.1 0.2 0.3 0.4 0.5Year Pedod (yr)
Figure 1. a) From top to bottom: NAO index averages from Jones et al. [1997] for winter months (December to February) and for the
whole year from April to March; grape harvests dates in northeastern France, in days from September 1 st [Le Roy Ladurie, 1983]; b)
Power spectra of the same series; thick, dotted and dashed lines represent respectively the red noise background, 90% and 95%
confidence level above this red noise. Note that energy is distributed in the whole spectrum and that only a few peaks rise above the
95% confidence level.
dates, which is superimposed to the climatic influence.
Economic (e.g., improvement of quality), and cultural reasons
influence harvest dates [e.g. Le Roy Ladurie, 1983; Lachiver, 1988; Pfister et al., 1999]. We checked this factor by
comparing the northeastern France series with a similar series
for southern France. They correspond to different plant
species, but also to regions with very different traditions. The
correlation coefficient of the two series is close to 0.80 for the
period
where
they
overlap
(17
th and 18
th centuries),
a large
value which shows that cultural factors must be marginal compared to the influence of climate variability. The most
serious perturbation may come from the phylloxera, a disease
which affected most of the European vines in 1860-70, and imposed drastic changes in the plants. Fig. 2 shows
histograms of grape harvests for three periods of 100 years,
the last two ones being separated by the phylloxera crisis. The
maximum is unchanged during the three centuries. An important difference is the smallest number of late harvests during the last century. Although the effect of new vine
grower practices cannot be dismissed, this trend more likely
reflects the secular climatic trend whose effect is also
observed on many other biological processes. Thus, although
the direct human impact is probably not negligible, the
climatic signal seems prevailing in the composite series we
analyze.
Fig. la shows the harvest series used since 1825, together with the NAO indices. No obvious relationship may be observed between the different series. However, their spectra reveal energy in similar frequency bands (Fig. lb), in
particular for the winter mean at periods 2.4 and 8 years.
30' 1671-1770
i8•1:1•76
20-
10'1
0
0 20 40 600 20 40 600 20 40 60
day day day
Figure 2. Histograms of the grape harvest dates in
northeastern France for three periods: 1671 - 1770, 1771-1870,
1871-1970.
Day from September
1 st.
Note tbe stability
of the
maximum (day 30), even after the phylloxera crisis (.--1870), and the decrease of late harvests for the last century.
Correlations between NAO index and grape
harvest dates
We analyzed the correlations between the harvest date
series and the NAO series in specific spectral domains for
indices corresponding to a specific month. Band-pass filters are applied to each series and the correlation coefficient r is computed for the common part of the two series. Moreover, in
order to check the stability of r with time, correlation
coefficients are computed for 50-year moving windows shifted by 10-year steps. Due to the window overlaps, the
different correlation coefficients obtained for the successive
windows are not independent. Consequently, the standard
deviation of these successive values is not a confidence
interval in a usual statistical approach. The error bar defined with this method gives however a useful estimate of the
stability of the series through time.
Table 1 reports the most significant correlation coefficients
between harvest dates and the NAO indices for the different months. Summer months have not been considered, because
weather conditions are poorly related to the NAO index during these months. As reported in Table 1, a positive correlation is obtained with the December index at short
periods:
a cold beginning
of winter related
to a low NAO
index accelerates the active hibernation of the stocks, leading to an early harvest. At intermediate and long periods, negative correlations are observed with some late winter or spring indices (e.g. May at period 3.1 yr), indicating that high NAO
values, thus mild and humid springs, are followed by early
harvests. At long time scales (T'•_10 yr), the negative
correlation obtained for winter and early spring months
appears
very stable. The highest
(negative)
correlation
is
obtained for April' it is of the order of-0.52 + 0.06 for periods T>__10 yr, and reaches -0.70 + 0.10 for T = 20 yr. A plot of the harvest dates superimposed onto the NAO April index (Fig. 3), filtered with the same low-pass filter, shows
that the two series have very similar features and are in phase.
The annual mean also gives a high negative correlation. These
long period correlations are striking, in regard of the two year
cycle of the vine. They possibly reflect the relative
insensitivity of the vine to short term climatic fluctuations (in
particular precipitation), because of the great depth of its roots
1850 1900 1950 year
Figure 3. Decadal
variations
of Jones
et al's [1977]
NAO
April index
(reversed)
superimposed
to the harvest
dates.
Data low-pass
filtered
(T > 10 yr), normalized
amplitudes.
fluctuations [1,achiver, 1988]. Late winter and early spring conditions are important for harvest dates, because they
determine the blossoming time. A common observation is that
the harvest occurs about 100 days after the blossoming time.
Correlations of harvest dates with temperatures (mean
values interpolated from gridded data with 5øx5 ø mesh) and
precipitation (values at two sites in the northeastern France)
leads to poorly informative results. The NAO index has the
advantage of integrating these two parameters in the complex
biological processes governing vine growing.
Test of NAO paleoreconstructions
The correlations obtained in the previous section have revealed that grape harvest dates contain very rich information at various frequencies about the monthly variability of the NAO. They can thus constitute an interesting, new proxy to test the existing NAO
paleoreconstructions. Three reconstructions will be
considered here (Table 1 and Fig. 4).
The first reconstruction, by Cook et al. [ 1998], is based on
tree-ring chronologies from North America and northwestern
Europe. It extends back to 1701, and is calibrated on Rogers [ 1984] series of winter indices (December to February) for the 1874-1980 period. Considering the previous results, the
period (yr) period (yr)
10 5 3.3 2.5 2 10 5 3.3 2.5 2
I I I I I I I I
LUTERBACHER ET AL. (1999) LUTERBACHER ET AL. (1999)
0.5 i ANNUAL MEAN (APRIL TO MARCH).,/' -- FEBRUARY
•0.0-
:v v
-1.0 v 1tt50-1740
0.5: WINTER MEAN(DJF) . _ APRIL
- --7
-1.0 APPdNZELLE•
El
AL.
[1998)
0.5"
ANNUAL
MEAN
(APRILTO
MARCH)
. ...._•ECEMBER
gO.O- -
. 1648-1867 v
-1.0 ...
0.0 0.1 0.2 0.3 0.4 0.0 0.1 0.2 0.3 0.4
frequency (yr-1) frequency (yr-1)
Figure 4. Correlation coefficient of harvest dates with NAO
indices as a function of frequency. Left: annual means for the
three reconstructions considered in this study (no short
periods in Appenzeller et al.'s series); right: Luterbacher et al.'s [1999] monthly reconstruction for three months with very different signatures in frequency (February, April, and December). Filled circles: calibration period, open circles: precalibration period including instrumental data, with l c• error bars. Triangles: early data (from Luterbacher et al. [2001]). Thick lines: experimental series by Jones et al.
[ 1997], with l c•-confidence domain (thin lines).
highest correlation of the mean winter NAO index with harvest dates was obtained at long period (r = -0.37 + 0.17 for T >_ 10 years). Cook et al.'s series, checked in the same conditions, leads to a similar value during the calibration
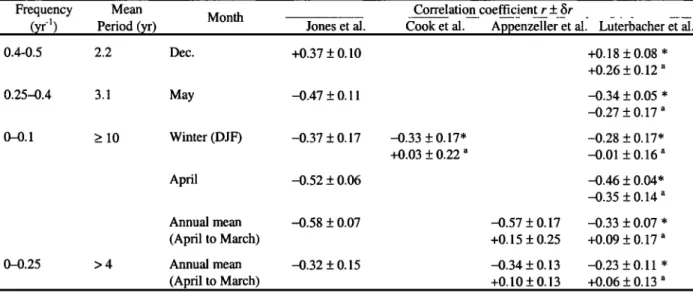
Table 1. Correlation coefficient r_+tr between grape harvest date and NAO (monthly indices or mean values defined
over several months noted with their initial). Grape harvest dates by Le Roy Ladurie [1983] for the period 1484-1977,
NAO instrumental series by Jones et al. [1997] from 1825 to 1997, reconstructed series: Cook et al. [1998] from 1701
to 1980 (with calibration period 1874-1980); Appenzeller et al. [1998] from 1648 to 1991 (with the last 130 years for the calibration period); and NAO1 series by Luterbacher et al. [1999] from 1750 to 1990 (calibration and verification
period 1901-1990). For the reconstructed series, * corresponds to the calibration period, a to the period before
calibration.
Correlation
coefficients
apply
to the time intervals
common
to the harvest
series
and each
of the NAO series.
Frequency Mean
(gr-1)
Period
(yr)
0.4-0.5 2.2
Month Correlation coefficient r + fir
... ...
...
...
....
Annual mean -0.58 + 0.07 -0.57 + 0.17 -0.33 + 0.07 * (April to March) +0.15 + 0.25 +0.09 + 0.17 a 0-0.25 > 4 Annual mean -0.32 + 0.15 -0.34 + 0.13 -0.23 + 0.11 * (April to March) +0.10 + 0.13 +0.06 + 0.13 a 0-0.1 >_ 10 Winter (DJF) -0.37 + 0.17 -0.33 + 0.17' -0.28 + 0.17' +0.03 + 0.22 a -0.01 + 0.16 a 0.25-0.4 3.1 May -0.47 q- 0. l 1 -0.34 q- 0.05 * -0.27 q- 0.17 a April -0.52 q- 0.06 -0.46 q- 0.04* -0.35 q- 0.14 a Dec. +0.37 q- 0.10 +0.18 + 0.08 * +0.26 q- 0.12 a3898 SOURIAU & YIOU: GRAPE HARVEST DATES FOR CHECKING NAO PALEORECONSTRUCTIONS
period (r =-0.33 + 0.!7), but is unsuccessful before this
period (r = +0.03 + 0.22), a result which possibly reflects the
low sensitivity of tree-ting growth to winter conditions.
The second reconstruction, from Appenze!ler et al. [!998],
is based on Greenland ice cores and spans over the past 350
years. It corresponds to an annual mean average from spring
to spring (April to March), a linear trend and the higher frequencies being removed. It has been calibrated with Hurrell's [1995] series for the last 130 years. The correlation coefficient r between Appenzeller et al.'s series and the grape
harvest dates, low-pass filtered at 4 years, is -0.34 + 0.13 for
the calibration period, and reaches -0.57 + 0.17 for T > 10
years, thus of the same order as those obtained with the instrumental series (r = -0.32 + 0.15 and r = -0.58 + 0.07,
respectively) (Table 1). However, r is of opposite sign before
the calibration period, suggesting a poor performance of the
reconstruction before 1865.
The third reconstruction, by Luterbacher et al. [1999],
combines old instrumental data and a large amount of proxy
data, and proposes monthly values back to 1675. It proposes
two series (NAO1 and NAO2) for which we obtain nearly
similar results, only those with NAO1 are presented. The
calibration period is 1901-1960, and the verification period spans 1961 to 1990. Results for annual mean are similar to
those obtained for the previous series (Fig. 4). Owing to the
availability of monthly values, it is possible to test extensively
this reconstruction, during the calibration-verification period,
and during two precalibration periods: one starting at the
beginning of the series in 1675, the other one starting in 1750,
i.e. when more instrumental data become available. This
second period gives better performances, in particular at
intermediate frequencies: For winter months, the correlation
coefficients obtained with the reconstructed series are often of the same order as those obtained with the instrumental series (Table 1 and Fig. 4). The results at very long periods are
generally poor, except for the April index, which is the most
sensitive with respect to harvest date, and which gives good
results at all periods. The lower performance at long period is possibly due to the short length of the calibration period (60
years) compared to the dominant period of the signal (T > 10
yr). A new series with monthly values back to 1659 [Luterbacher et al., 2001] gives similar results, with
particularly good results for April (Fig. 4).
Conclusion
The present study has demonstrated that, due to their
different sensitivities to the NAO indices of the different
months at different wavelengths, grape harvest dates are an
interesting too1 to check NAO paleoreconstmctions. Some
limitations may come however from the poor control of the
human impact (changes in vine grower practices), even if the
climatic impact appears prevailing. Among the series we
considered, Luterbacher et a/.'s [1999, 2001] series appear as
the most informative, owing to the availability of monthly
values. The introduction of instrumental data is probably an
important aspect for the quality of this reconstruction
[Schmutz et al., 2000].
Instrumental data do not go back further than 1650, and are
in limited
number
before
the 19
th century.
Historical
and
experimental proxies [Mann et al., 1998] are thus of majorinterest. Grape harvest dates, which are known since the
fifteenth century and have a large geographic extension,
deserve further exploration as a possible proxy to extend or
constrain the monthly NAO paleoreconstructions further back
in time.
Acknowledgments. A.S. thanks J. Jouzel for his encouragement to start this study, C. Appenzeller and J. Luterbacher for their NAO reconstructions, M6t6o-France for precipitation series, V. Slonosky, V. Masson, C. Le Provost for helpful comments on the manuscript, J.
Luterbacher for a detailed review, M. Testut for information about
vine. NAO series at http://www.cru.uea. ac.uk/cru/data/nao.htm; see also http://www.ldeo.columbia.edu/NAO. The spectral analysis technique [Mann and Lees, 1996] is part of the Spectra 4.1 package available at: http://www.atmos.ucla.edu/tcd/ssa.
References
Appenzeller, C., T.F. Stocker, and M. Anklin, North Atlantic Oscillation dynamics recorded in Greenland ice cores, Science, 282,446-449, 1998.
Cook, E.R., R.D. D'Arrigo, and K.R. Briffa, A reconstruction of the North Atlantic Oscillation using tree-ring chronologies from North America and Europe, Holocene, 8, 9-17, 1998.
Hurtell, J.W., Decadal trends in the North Atlantic Oscillation:
Regional Temperatures and precipitation, Science, 269, 676-679,
1995.
Hurrell, J.W., and H. van Loon, Decadal variation in climate
associated with the North Atlantic Oscillation, Clim. Change, 36,
301-326, 1997.
Jones, P.D., T. Jonsson, and D. Wheeler, Extension to the North
Atlantic Oscillation using early instrumental pressure
observations from Gibraltar and Southwest Iceland, Int. J. Climatol., 17, 1433-1450, 1997.
Lachiver, M., Vin, Vignes et Vignerons: Histoire du Vignoble Franqais, Fayard, Paris, 714 pp., 1988.
Le Roy Ladurie, E., Histoire du Climat Depuis l½tn Mil, 2 Vol., 541 pp., Flammarion, Paris, 1983.
Luterbacher, J., C. Schmutz, D. Gyalistras, E. Xoplaki, and H. Wanner, Reconstruction of monthly NAO and EU indices back to AD 1675, Geophys. Res. Lett., 26, 2745-2748, 1999.
Luterbacher, J., et al., Extending NAO reconstructions back to 1500,
Arm. Sci. Lett., submitted, 2001.
Mann, M.E., R.S. Bradley, and M.K. Hughes, Global-scale temperature patterns and climate forcing over the past six
centuries, Nature, 392, 779-787, 1998.
Mann, M. E., and J.M. Lees, Robust estimation of background noise and signal detection in climate time series, Clim. Change, 33,
409-445, 1996.
Mann, M.E., and J. Park, Joint spafiotemporal modes of surface temperature and sea level pressure variability in the northern hemisphere during the last century, J. Clim., 9, 2137-2162, 1996. Osborn, T.J., K.R. Briffa, S.F.B. Tett, P.D. Jones, and R.M. Trigo,
Evaluation of the North Atlantic Oscillation as simulated by a coupled climate model, Clim. Dyn., 15, 685-702, 1999.
Pfister, C., R. Brazdil, and R. Glaser, Climate Variability in
Sixteenth-Century Europe and its Social Dimension, Kluwer, Dordrecht, 1999.
Rogers, J.C., The association between the North Atlantic Oscillation and the Southern oscillation in the Northern Hemisphere, Mon.
Weather Rev., 112, 1999-2015, 1984.
Rosini, E., Impact of climatic fluctuations on agriculture, In: The Climate of Europe: Past, Present and Future, H. Flohn and R.
Fantechi, Ed., Reidel, Dordrecht, 356 pp., 1984.
Schmutz, C., J. Luterbacher, D. Gyalistras, E. Xoplaki, and H. Wanner, Can we trust proxy-based NAO index reconstructions?, Geophys. Res. Lett., 27, 1135-1138, 2000.
Annie Souriau, CNRS, Observatoire Midi-Pyrenees, 14 Avenue
Edouard Belin, 31400 - Toulouse, France (e-mail:
Annie. S ouriau @cnes. fr)
Pascal Yiou, Laboratoire des Sciences du Climat et de
l'Environnement, CE Saclay, l'Orme des Merisiers, 91191 - Gif-sur- Yvette, France (e-mail: [email protected])
(Received January 16, 2001; revised August 7, 2001 ß
![Figure 1. a) From top to bottom: NAO index averages from Jones et al. [1997] for winter months (December to February) and for the whole year from April to March; grape harvests dates in northeastern France, in days from September 1 st [Le R](https://thumb-eu.123doks.com/thumbv2/123doknet/13039450.382318/3.865.139.678.107.319/figure-averages-december-february-harvests-northeastern-france-september.webp)