HAL Id: hal-03213399
https://hal.archives-ouvertes.fr/hal-03213399
Submitted on 30 Apr 2021
HAL is a multi-disciplinary open access
archive for the deposit and dissemination of
sci-entific research documents, whether they are
pub-lished or not. The documents may come from
teaching and research institutions in France or
abroad, or from public or private research centers.
L’archive ouverte pluridisciplinaire HAL, est
destinée au dépôt et à la diffusion de documents
scientifiques de niveau recherche, publiés ou non,
émanant des établissements d’enseignement et de
recherche français ou étrangers, des laboratoires
publics ou privés.
Synthesis and Terrestrial Model Intercomparison
Project – Part 2: Environmental driver data
Y. Wei, S. Liu, D. Huntzinger, A. Michalak, N. Viovy, W. Post, C. Schwalm,
K. Schaefer, A. Jacobson, C. Lu, et al.
To cite this version:
Y. Wei, S. Liu, D. Huntzinger, A. Michalak, N. Viovy, et al.. The North American Carbon Program
Multi-scale Synthesis and Terrestrial Model Intercomparison Project – Part 2: Environmental driver
data. Geoscientific Model Development, European Geosciences Union, 2014, 7 (6), pp.2875-2893.
�10.5194/gmd-7-2875-2014�. �hal-03213399�
www.geosci-model-dev.net/7/2875/2014/ doi:10.5194/gmd-7-2875-2014
© Author(s) 2014. CC Attribution 3.0 License.
The North American Carbon Program Multi-scale Synthesis and
Terrestrial Model Intercomparison Project – Part 2:
Environmental driver data
Y. Wei1, S. Liu1, D. N. Huntzinger2, A. M. Michalak3, N. Viovy4, W. M. Post1, C. R. Schwalm2, K. Schaefer5, A. R. Jacobson6, C. Lu7, H. Tian7, D. M. Ricciuto1, R. B. Cook1, J. Mao1, and X. Shi1
1Environmental Sciences Division, Oak Ridge National Laboratory, Oak Ridge, TN, USA
2School of Earth Sciences and Environmental Sustainability, Northern Arizona University, Flagstaff, AZ, USA
3Department of Global Ecology, Carnegie Institution for Science, Stanford, CA, USA
4Laboratoire des Sciences du Climat et l’Environnement, Paris, France
5University of Colorado, National Snow and Ice Data Center, Boulder, CO, USA
6NOAA Earth System Research Lab, Global Monitoring Division, Boulder, CO, USA
7International Center for Climate and Global Change Research, School of Forestry and Wildlife Sciences, Auburn University,
Auburn, AL, USA
Correspondence to: Y. Wei ([email protected])
Received: 1 August 2013 – Published in Geosci. Model Dev. Discuss.: 4 November 2013 Revised: 16 July 2014 – Accepted: 23 September 2014 – Published: 5 December 2014
Abstract. Ecosystems are important and dynamic
compo-nents of the global carbon cycle, and terrestrial biospheric models (TBMs) are crucial tools in further understanding of how terrestrial carbon is stored and exchanged with the atmosphere across a variety of spatial and temporal scales. Improving TBM skills, and quantifying and reducing their estimation uncertainties, pose significant challenges. The Multi-scale Synthesis and Terrestrial Model Intercompari-son Project (MsTMIP) is a formal scale and multi-model intercomparison effort set up to tackle these chal-lenges. The MsTMIP protocol prescribes standardized envi-ronmental driver data that are shared among model teams to facilitate model–model and model–observation comparisons. This paper describes the global and North American environ-mental driver data sets prepared for the MsTMIP activity to both support their use in MsTMIP and make these data, along with the processes used in selecting/processing these data, accessible to a broader audience. Based on project needs and lessons learned from past model intercomparison activities,
we compiled climate, atmospheric CO2 concentrations,
ni-trogen deposition, land use and land cover change (LULCC), C3 / C4 grasses fractions, major crops, phenology and soil
data into a standard format for global (0.5◦×0.5◦
resolu-tion) and regional (North American: 0.25◦×0.25◦
resolu-tion) simulations. In order to meet the needs of MsTMIP, im-provements were made to several of the original environmen-tal data sets, by improving the quality, and/or changing their spatial and temporal coverage, and resolution. The resulting standardized model driver data sets are being used by over 20 different models participating in MsTMIP. The data are archived at the Oak Ridge National Laboratory Distributed Active Archive Center (ORNL DAAC, http://daac.ornl.gov) to provide long-term data management and distribution.
1 Introduction
The need to understand and quantify the role of terrestrial ecosystems in the global carbon cycle and its climate change feedbacks has been driving the development of global ter-restrial biogeochemistry and biogeography models since the late 1980s (Foley, 1995). Since that time, the carbon cycle science modeling community has continued to improve un-derstanding of terrestrial ecosystems in global and regional carbon cycling (US CCSP, 2011).
One strategy for doing so has been through several multi-model intercomparison projects (MIPs) conducted starting in the 1990s. The Vegetation–Ecosystem Modeling and
Analy-sis Project1(VEMAP) was a pioneer MIP activity that
eval-uated the sensitivity of terrestrial biospheric models (TBMs)
to altered climate forcings and elevated atmospheric CO2
for the continental United States (Schimel et al., 1997). The Potsdam net primary production (NPP) MIP was an inter-comparison activity focusing on annual and seasonal fluxes of NPP for the land biosphere involving 17 global TBMs
(Cramer et al., 1999). More recently, the GCP-TRENDY2
effort, part of the Global Carbon Project (GCP), organized and performed a factorial set of models to investigate trends in net land–atmosphere carbon exchange of dynamic vege-tation models (DGVMs) over the time period from 1980 to 2009 (Sitch et al., 2008).
Huge challenges still remain, however, especially in de-veloping approaches for evaluating model predictions and assessing the uncertainties associated with model estimates (e.g., Randerson et al., 2009; USCCSP, 2011; Schwalm et al., 2013). The challenges associated with representing ter-restrial ecosystem fluxes of carbon dioxide are illustrated by the huge variability in model predictions observed as part of the recent North American Carbon Program (NACP) regional and site interim synthesis activities (e.g., Huntzinger et al., 2012; Schaefer et al., 2012). The results from these activities confirmed the large uncertainties associated with our ability to represent terrestrial ecosystem carbon fluxes, but the re-liance of the regional synthesis on off-the-shelf simulations without a prescribed protocol or standardized driver data sets limited the degree to which the observed variability could be attributed to specific sources of uncertainty.
Four types of uncertainties drive differences between pre-dictions of terrestrial carbon flux (e.g., Enting et al., 2012): uncertainty associated with (1) the choice of driver data, (2) parameter values, (3) initial conditions as well as (4) the choice of processes to include and how these processes are represented within the model (i.e., structural uncertainty). Estimating and reducing these uncertainties are both critical to improving model performance, and consequently to un-derstanding the role of terrestrial ecosystems in the global carbon cycle.
In response to this need, the Multi-scale Synthesis and Ter-restrial Model Intercomparison Project (MsTMIP) was es-tablished to build on previous and ongoing MIPs to provide a consistent and unified modeling framework to interpret and address structural and parameter uncertainties. Huntzinger et al. (2013) discusses the philosophy of MsTMIP and how past and ongoing MIP activities impacted and inspired its de-sign. Similar to VEMAP, the Potsdam NPP MIP, and
GCP-1The Vegetation–Ecosystem Modeling and Analysis Project
http://www.cgd.ucar.edu/vemap/
2Trends in net land–atmosphere carbon exchange http://dgvm.
ceh.ac.uk/node/21
TRENDY, MsTMIP prescribes standardized environmental driver data and a consistent spin-up protocol for all model simulations. VEMAP, as a pioneer in model intercompari-son activities, provided a valuable backdrop against which the approach for preparing modeling input data sets was de-veloped (Kittel et al., 1995, 2004). Although focused only on the conterminous United States, VEMAP was one of the first MIP activities that applied a consistent set of input data and boundary conditions to multiple models in order to iso-late the impact of model choice on across-model variability. Thus, providing standardized input for MsTMIP greatly re-duces the inter-model variability caused by differences in en-vironmental drivers, initial conditions and the process used for defining steady-state conditions, and helps to focus the analysis on the ways in which the structure of TBMs (i.e., their choice and formulation of ecosystem processes) and as-sociated internal parameters impact a model’s estimates of terrestrial ecosystem carbon dynamics.
This paper describes the driver data needs of MsTMIP and outlines the environmental driver data sets compiled and synthesized for the MsTMIP activity. In doing so, this pa-per aims to address the needs of multiple communities and audiences. First, it provides the detailed background about environmental driver data choices that are necessary for the scientific interpretation of modeling results coming out of the MsTMIP effort. As such, it addresses the needs of re-searchers focusing on the scientific interpretation of the MsT-MIP results. Second, it provides the rationale for the choice of specific environmental driver data and the details associ-ated with their processing. Thus, the paper also aims to ad-dress the needs of researchers who wish to leverage the work reported here by using the driver data for follow-on studies or related applications. Third, this paper reports on the decision-making and implementation process involved in putting to-gether common driver data for large modeling studies and intercomparison efforts, including lessons learned that are in-dependent of the specific applications addressed by MsTMIP. As such, this paper also aims to inform future efforts focused on assembling consistent data sets for use by multiple mod-eling teams.
The remainder of this paper is structured to address the needs of the three intended audiences described above. For each data category, we first provide a brief review of the data source chosen for MsTMIP and the rationale for the choice, along with a description of other similar data sources cur-rently available and data products used in past and/or ongo-ing MIPs. We then describe the processongo-ing and analysis com-pleted to convert the original data source into a form meeting the needs of the MsTMIP activity, and in some cases to im-prove the quality of the original data source. We also provide a brief evaluation of standardized MsTMIP data products, and suggestions on how the data should be used in terres-trial biosphere modeling. Finally, we introduce some lessons learned on data processing and management, to guide future data-intensive projects.
2 Driver data needs of MsTMIP
The overarching goal of the MsTMIP activity is to pro-vide a unified intercomparison framework that allows for the critical synthesis, benchmarking, evaluation and feed-back needed to improve TBMs (Huntzinger et al., 2013). To meet this goal, the MsTMIP activity conducts a suite of sim-ulations that can be used to quantify (1) the impact of the scale and spatial resolution of model simulations on model estimates and (2) the additive influence of a suite of time-varying environmental drivers or forcing factors on model estimates of carbon stocks and fluxes. As such, MsTMIP in-cludes simulations over two spatial domains and resolutions:
globally at 0.5◦×0.5◦resolution and regionally over North
America at 0.25◦×0.25◦resolution. To evaluate the additive
impacts of different types of forcing, e.g., climate, land use
and land cover change (LULCC), atmospheric CO2
concen-trations and nitrogen deposition, on model estimates of car-bon fluxes and stocks, a series of sensitivity simulations are prescribed at both spatial scales for a simulation period from 1801 to 2010 (Huntzinger et al., 2013). Inherent to MsT-MIP’s experimental design is the focus on controlling for as many sources of variability in TBM predictions as possible, to isolate and quantify the impact of the model itself (i.e., structural and parameter uncertainties) on estimates.
One source of variability in model estimates is the choice of (and uncertainty associated with) environmental driver and input data sets. Most uncoupled TBMs require, at a min-imum, a land–water mask, climate forcing data, soil
char-acteristics and atmospheric CO2concentrations to simulate
how carbon is exchanged between the land and atmosphere. Many models also require additional information such as LULCC, phenology, nitrogen deposition rates and distur-bance history. Ideally, the temporal resolution of drivers should be fine enough to enable prediction at sub-daily tem-poral resolution; thus, making it possible to investigate the diurnal cycle of carbon and energy fluxes. To meet the objec-tives of MsTMIP’s experimental design, the goal was to pro-vide modeling teams, to the extent possible, with a complete and consistent set of environmental driver data. In addition to being of high quality, the environmental driving and input data chosen for MsTMIP also needed to meet the following requirements:
– data sets must be compatible with over 20 different
TBMs;
– data sets must provide consistent spatial coverage for
the land surface within the two simulation domains:
(1) North American: 10–84◦northern latitude; 50–170◦
western longitude, and (2) global: all land surface areas excluding Antarctica;
– Spatial resolutions must be compatible with the two sets
of simulations: (1) North American (0.25◦×0.25◦) and
(2) global (0.5◦×0.5◦);
– Temporal resolution and extent must be compatible with
the two sets of simulations: (1) North American (3-hourly, 1801–2010) and (2) global (6-(3-hourly, 1801– 2010);
– data sets must provide smooth transitions in time,
with-out any unrealistic spikes or discontinuities;
– data sets must be physically consistent with one another.
For example, climate, soil and land cover change history needed to represent the same land domain as indicated in the land–water mask, and the prescribed phenology data needed to be consistent with the time-varying land cover data for each time step.
The environmental driver and input data sets chosen for the MsTMIP activity are a reflection of these overall project needs and requirements.
3 Environmental driver data sets
MsTMIP environmental driver and associated data products include data sets describing climatology, time-varying
atmo-spheric CO2 concentrations, time-varying nitrogen
deposi-tion, LULCC, C3 / C4 grasses fractions, major crop distribu-tion, phenology, soil characteristics and a land–water mask, all at 0.5◦×0.5◦for the global domain and 0.25◦×0.25◦for the North American domain (Table 1). All MsTMIP model
driver data files are stored in Climate and Forecast (CF)3
1.4 convention compliant netCDF version 3 format, which is supported by a wide range of programming APIs (e.g., C, C++, Fortran, Java, Perl) and multiple operating systems (e.g., Linux, Unix, Mac OS X, Windows). All drivers are saved in Greenwich mean time (GMT) with all sub-monthly drivers (e.g., climate) including leap years.
For most data categories, the North American data sets are based on the same data sources as the global prod-ucts. We did, however, choose different climatology and soil data products for the two domains. This decision was driven primarily by the availability of these drivers at the spatial and temporal resolution needed for the regional simulations. However, by holding the source of other drivers constant be-tween the global and North American simulations, we are also creating an opportunity to test the impact of the choice of climate and soil characteristics on model estimates.
3.1 Climate
3.1.1 Global climate: CRU–NCEP
Several reanalysis and observation-based gridded global climatology data sets exist, including products produced
3NetCDF Climate and Forecast (CF) Metadata
Con-ventions, version 1.4. http://cfconventions.org/Data/ cf-conventions/cf-conventions-1.4/build/cf-conventions.html (http://cfconventions.org/).
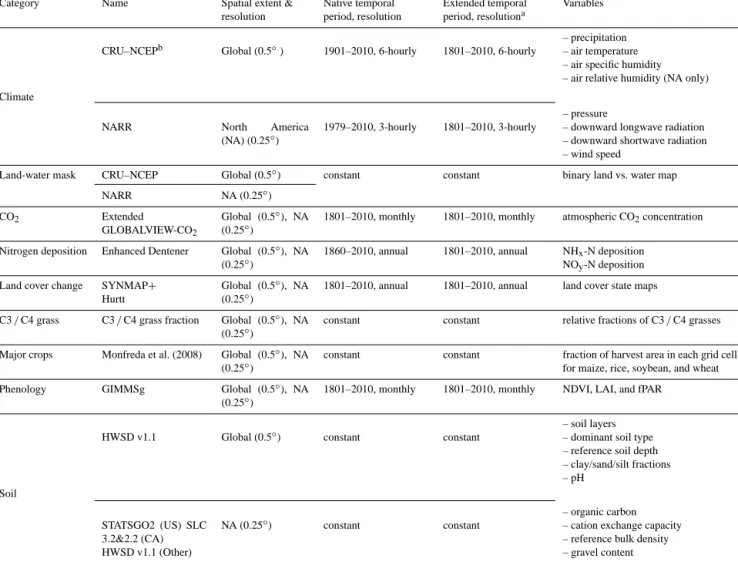
Table 1. The MsTMIP environmental driver data summary.
Category Name Spatial extent & resolution Native temporal period, resolution Extended temporal period, resolutiona Variables Climate
CRU–NCEPb Global (0.5◦) 1901–2010, 6-hourly 1801–2010, 6-hourly
– precipitation – air temperature – air specific humidity – air relative humidity (NA only)
NARR North America
(NA) (0.25◦)
1979–2010, 3-hourly 1801–2010, 3-hourly
– pressure
– downward longwave radiation – downward shortwave radiation – wind speed
Land-water mask CRU–NCEP Global (0.5◦) constant constant binary land vs. water map NARR NA (0.25◦)
CO2 Extended
GLOBALVIEW-CO2
Global (0.5◦), NA (0.25◦)
1801–2010, monthly 1801–2010, monthly atmospheric CO2concentration
Nitrogen deposition Enhanced Dentener Global (0.5◦), NA (0.25◦)
1860–2010, annual 1801–2010, annual NHx-N deposition NOy-N deposition
Land cover change SYNMAP+ Hurtt
Global (0.5◦), NA (0.25◦)
1801–2010, annual 1801–2010, annual land cover state maps
C3 / C4 grass C3 / C4 grass fraction Global (0.5◦), NA (0.25◦)
constant constant relative fractions of C3 / C4 grasses
Major crops Monfreda et al. (2008) Global (0.5◦), NA (0.25◦)
constant constant fraction of harvest area in each grid cell for maize, rice, soybean, and wheat Phenology GIMMSg Global (0.5◦), NA
(0.25◦)
1801–2010, monthly 1801–2010, monthly NDVI, LAI, and fPAR
Soil
HWSD v1.1 Global (0.5◦) constant constant
– soil layers – dominant soil type – reference soil depth – clay/sand/silt fractions – pH STATSGO2 (US) SLC 3.2&2.2 (CA) HWSD v1.1 (Other) NA (0.25◦) constant constant – organic carbon – cation exchange capacity – reference bulk density – gravel content
aNative temporal periods of environmental driver data sets compiled for MsTMIP are extended to be compatible with the simulation time period (1801–2010) defined by MsTMIP. Please refer to Sect. 4. spin-up data package to see how data with shorter native temporal period are extended back to 1801 to address the needs of MsTMIP simulations.bCRU–NCEP: Climate Research Unit and National Centers for Environmental Prediction; NARR: North American Regional Reanalysis; SYNMAP: SYNergetic land cover MAP; GIMMSg: Global Inventory Monitoring and Modeling System version g; NDVI: normalized difference vegetation index; LAI: leaf area index; fPAR: fraction of photosynthetically active radiation; HWSD: Harmonized World Soil Database; STATSGO2: State Soil Geographic data version 2; SLC: Soil Landscapes of Canada.
by the Climate Research Unit (CRU) (Harris et al., 2014), the National Centers for Environmental Prediction (NCEP)/National Center for Atmospheric Research (NCAR) Reanalysis 1 (Kalnay et al., 1996), and the European Centre for Medium-Range Weather Forecasts (ECMWF) (Uppala et al., 2005; Dee et al., 2011). The NCEP/NCAR Reanaly-sis 1 data was adopted by the Inter-Sectoral Impact Model Intercomparison Project (ISI–MIP) as one of its climate in-puts (Warszawski et al., 2013) to assess the influence of the choice of forcing data on the overall results. However, none of these available climatology data sets fully met the spa-tial and temporal requirements of MsTMIP. The CRU Time Series (TS) 3.2 product covers the time period from 1901
to present at a 0.5◦spatial resolution, but only at a monthly
temporal resolution. The NCEP/NCAR product, on the other hand, has a finer temporal resolution (6-hourly), but has a
coarse spatial resolution (2.5◦) and only provides
climatol-ogy back to 1948. The ECMWF product similarly lacks the temporal coverage required for MsTMIP.
Thus, we combined the strengths of the CRU and NCEP/NCAR Reanalysis products, fusing them to produce the CRU–NCEP global climate data set. This new data set
provides a globally gridded (0.5◦×0.5◦) and sub-daily
(6-hourly) time-varying climatology product that spans the pe-riod between 1901 and 2010. Earlier versions of CRU– NCEP data had been used as driver data in past MIP activi-ties, including GCP-TRENDY. The MsTMIP project updated the CRU–NCEP data by adopting the latest (version 3.2 at preparation time) CRU TS data. Details of the CRU–NCEP fusion method can be found in Supplement 1. MsTMIP CRU–NCEP contains seven climatology variables, includ-ing downward longwave and shortwave radiations, pressure,
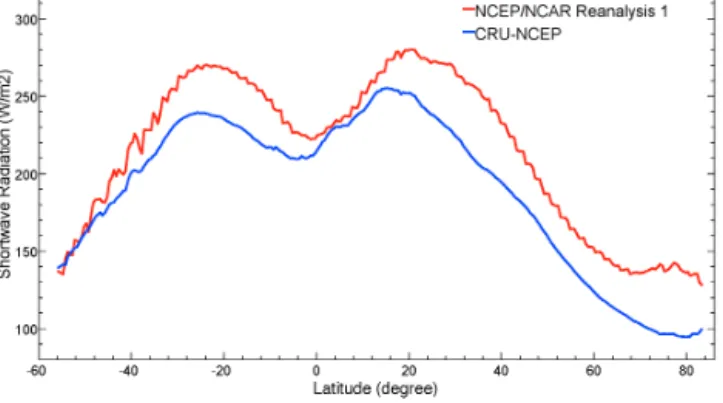
Figure 1. Comparison of the mean of long-term mean downward
shortwave radiation (1948–2010) on land surface for each 0.5 de-gree latitudinal band from NCEP/NCAR Reanalysis 1 and CRU– NCEP data sets.
air specific humidity, precipitation, temperature and wind (Table 1). In the process of creating this new climatology product, we also corrected known biases in temperature and shortwave radiation in the NCEP/NCAR Reanalysis product. Zhao et al. (2006) showed that NCEP/NCAR Reanalysis cli-matology overestimates downward shortwave radiation, es-pecially in non-tropical regions, and underestimates surface temperature for almost all latitudes. Biases in climatological variables can introduce substantial errors into gross primary productivity (GPP) and net primary productivity (NPP) esti-mates (Zhao et al., 2006). By fusing NCEP/NCAR with the CRU climatology, we forced the monthly amplitude of the CRU–NCEP product to be consistent with the observation-based CRU climatology, while preserving the diurnal vari-ability in the NCEP/NCAR Reanalysis product. A compar-ison between the zonal mean of long-term mean downward
shortwave radiation for each 0.5◦grid cell over land (Fig. 1)
shows that CRU–NCEP has lower downward shortwave ra-diation than the original NCEP/NCAR data, except at 0–
10◦north and 50–55◦south, where CRU–NCEP downward
shortwave radiation is similar to NCEP/NCAR Reanalysis 1.
3.1.2 North American climate: NARR
Several climatology products are available for North Amer-ica at finer spatial and temporal resolutions than the new CRU–NCEP product. In addition to better address-ing the resolution needs of MsTMIP regional simulations
(0.25◦×0.25◦spatial and 3-hourly temporal resolution),
us-ing a different climate driver data product for the North American simulations (1) makes it possible to test the in-fluence of the choice of climate drivers on model estimates, and (2) provides a closer linkage between model estimates and fine-scale ground-based observations. Both the Daymet (Thornton et al., 2012) and Parameter elevation Regression
on Independent Slopes Model (PRISM)4 products provide
temperature and precipitation data at high spatial resolution (e.g., 1 km) for North America. However, the temporal reso-lutions of these products (PRISM: monthly; Daymet: daily) do not meet the needs of MsTMIP, and these data products also do not cover the full spatial extent of the North
Ameri-can simulations (10–84◦north; 50–170◦west).
The NCEP North America Regional Reanalysis (NARR), on the other hand, provides long-term resolution high-frequency atmospheric and land surface meteorological data for the North American domain (Mesinger et al., 2006). The NARR climatology begins in 1979 and extends to present at 3-hourly temporal and 32 km spatial resolutions. Although the temporal coverage is shorter than desired, the NARR product was selected for the MsTMIP activity because it best matched the needs of the North American simulations, and the time covered by the data set was extended as described in Sect. 4. The original NARR data were provided by the
NOAA/OAR/ESRL PSD5, available at http://www.esrl.noaa.
gov/psd/ (last access: 14 January 2011).
The NARR variables were regridded to a spatial
resolu-tion of 0.25◦×0.25◦, from their original Lambert
Confor-mal Conic Projection at 32 km resolution using both area-weighted and distance-area-weighted averages. An area-area-weighted averaging method was used for precipitation and radiation flux variables in order to conserve their total magnitude for North America. For highly spatially auto-correlated state variables (e.g., air temperature, humidity), distance-weighted averaging was used because values for these variables tend to cluster together in space. The U direction (along longitude) and V direction (along latitude) wind speeds were combined into an overall surface wind velocity variable prior to the re-gridding process.
In a study of rain gauge and NARR data, Sun and Bar-ros (2010) found that, although NARR reproduces the spa-tial patterns of precipitation, it underestimates the frequency and magnitude of large rainfall events. In addition, Xie et al. (2003) found that the Global Precipitation Climatology
Project (GPCP) monthly gridded (2.5◦×2.5◦) precipitation
product, derived from satellite and gauge measurements, re-produced spatial patterns of total precipitation with relatively high quality especially over land. Thus, to remove biases in the precipitation, we rescaled the NARR 3-hourly precipita-tion using the GPCP v2.1 (Adler et al., 2003). Although the GPCP product has a relatively coarse spatial resolution of
2.5◦, it has the advantage of including a correction to
com-pensate for systematic biases in gauge measurements due to wind, gauge wetting and gauge evaporation. Applying this
4PRISM Climate Group, Oregon State University, http://prism.
oregonstate.edu, created 4 February 2004.
5NOAA/OAR/ESRL PSD: National Oceanic & Atmospheric
Administration/Oceanic and Atmospheric Research/Earth System Research Laboratory Physical Sciences Division, Boulder, Col-orado, USA.
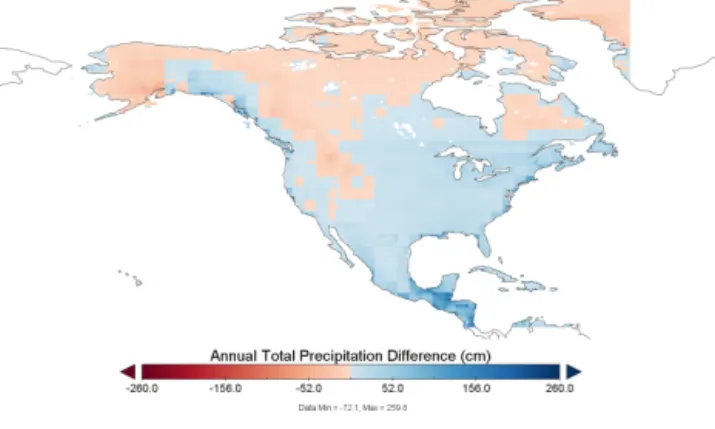
Figure 2. Difference map between the long-term mean (1979–
2010) annual total precipitation from rescaled NARR and original NARR (rescaled NARR precipitation – original NARR precipita-tion).
rescaling allowed us to retain the advantages provided by the NARR data product, while also leveraging the information provided by GPCP. To rescale the NARR precipitation, for
each month, precipitation of all 3-hourly 0.25◦NARR grids
within each 2.5◦GPCP grid was summed up along time,
av-eraged over space and linearly rescaled to match the magni-tude of the total monthly GPCP precipitation. Figure 2 uses a special color scheme to present the difference map between the long-term mean (1979–2010) annual total precipitation from rescaled NARR and original NARR products. An in-teresting pattern can be observed in Fig. 2, where rescaling decreases precipitation in the northern part of North Amer-ica while it increases in the southern part. SpecifAmer-ically, the rescaled product better represents the magnitude of extreme rainfall events at the coastline of Gulf of Alaska and Central America, while generally preserving both the magnitude and spatial pattern in most other areas of North America. This rescaling, however, does not alter the frequency of rainfall events.
As mentioned previously, biases in shortwave radiation can have a strong impact on model estimates of GPP. Kennedy et al. (2010) showed that between 1999 and 2001 the NARR product overestimates downward shortwave ra-diation flux relative to the Atmospheric Rara-diation Measure-ment (ARM) southern Great Plains (SGP) site observations by about 10 % under clear sky and by about 30 % under all-sky conditions. We also compared NARR downward
short-wave radiation flux with observations from 23 FLUXNET6
sites across North America. For the FLUXNET sites exam-ined, NARR overestimates downward shortwave radiation by about 30 %, with higher positive bias under cloudy
con-6FLUXNET, a “network of regional networks”, coordinates
re-gional and global analysis of observations from micrometeorologi-cal tower sites. http://fluxnet.ornl.gov.
Figure 3. Comparison of shortwave radiation from original and
re-analyzed NARR against observations averaged over 23 FLUXNET sites across North America.
ditions (Fig. 3). The weather simulation model MTCLIM7
version 4.3 was used to reduce the shortwave radiation bias in the NARR product. Given input data from one location, MTCLIM generates weather information for another loca-tion based on different elevaloca-tion, slope and aspect relative to the input location (Running et al., 1987; Thornton and Run-ning, 1999). Bohn et al. (2013) found that, with the excep-tion of coastal areas (which had a negative bias of about
−26 %), MTCLIM performed reasonably well at
estimat-ing downward shortwave radiation under most climate con-ditions for the global land surface. They also showed that MTCLIM v4.3’s snow correction significantly reduced the bias in snow-covered areas. We calculated the total daily shortwave radiation for each grid cell using the MTCLIM model driven by gridded daily maximum and minimum tem-perature and total daily precipitation derived from the 3-hourly NARR original temperature and rescaled precipita-tion. The original 3-hourly NARR downward shortwave ra-diation values were then linearly rescaled to match the to-tal daily downward shortwave radiation generated from the MTCLIM model. This process was effective at reducing the overall positive bias in shortwave radiation (Fig. 4), such that the rescaled NARR product better matches observed radia-tion at FLUXNET sites (Fig. 3).
3.1.3 Comparison of global and North American climate data
One of the goals of MsTMIP is to test the influence of both spatial resolution and changing driver data on model esti-mates (Huntzinger et al., 2013). A comparison between the MsTMIP global (CRU–NCEP) and North American (NARR) climate data over the years 1979–2010 reveals that MsT-MIP’s MTCLIM-calibrated NARR downward shortwave ra-diation has much higher seasonal variability than CRU– NCEP in North America. MsTMIP’s MTCLIM-calibrated NARR downward shortwave radiation also has a decreas-ing trend in the 1980s and an increasdecreas-ing trend after 1990,
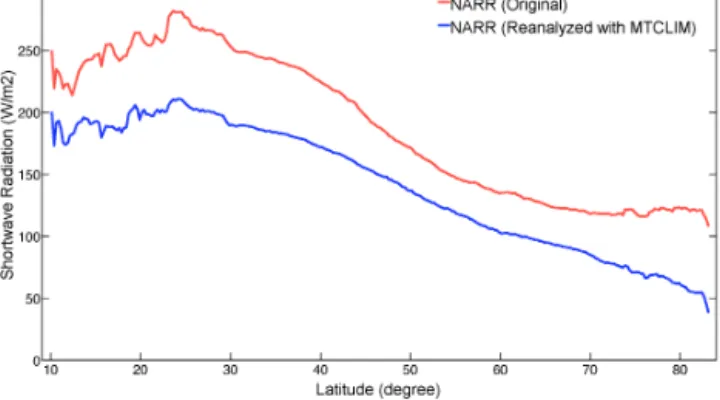
7MTCLIM, a mountain microclimate simulation model, http://
Figure 4. Comparison of the latitudinal zonal (0.25◦) mean of long-term mean downward shortwave radiation (1979–2010) on land sur-face from original NARR and reanalyzed NARR data sets.
which is consistent with the findings reported in Wild et al. (2005) and Pinker et al. (2005). However, this decreasing– increasing trend was not observed in the CRU–NCEP data. MsTMIP’s NARR and CRU–NCEP downward longwave ra-diation products share similar seasonal variability and tial distribution patterns, while NARR has much finer spa-tial details due to higher spaspa-tial resolution. Though sharing similar seasonal variability and spatial distribution patterns, MsTMIP’s GPCP-rescaled NARR precipitation was higher than that of CRU–NCEP, especially before 2003, and had a decreasing trend between 1979 and 2010. This decrease in the rescaled NARR precipitation had a significant im-pact on MsTMIP regional-scale sensitivity simulations. MsT-MIP’s NARR and CRU–NCEP generally share similar sea-sonal variability, trend and spatial distribution patterns for other climate variables. Details of this comparison can be found in Supplement 2.
3.2 Land–water mask
The land–water mask specifies the land grid cells on which MsTMIP global and regional simulations are run, and needs to be consistent with the climate driver data. We therefore based the global land–water mask on the CRU–NCEP land– water mask, and the North American land–water mask on the original NARR mask regridded to a spatial resolution of
0.25◦×0.25◦using an area-weighted method to preserve the
total amount of land area. Since a regridding process was involved for the preparation of North American land–water
mask, to preserve only those 0.25◦grid cells covered
primar-ily by land, a threshold of 50 % was then applied to define land grid cells.
3.3 Atmospheric CO2concentration
Atmospheric CO2concentrations have risen more than 40 %
over pre-industrial levels. Increased atmospheric CO2
con-tent influences global climate not only through its
green-house radiative effect, but also through its physiological ef-fect (Sellers et al., 1996a; Ainsworth and Long, 2005). Under
elevated CO2concentration, plant stomata open less widely,
leading to reduced plant transpiration (Cao et al., 2010; Shi
et al., 2011). In natural ecosystems, this CO2fertilization
ef-fect is modulated by many other factors, including access to light, water and other nutrients. Furthermore, the net
terres-trial sink inferred from analysis of atmospheric CO2
distribu-tions (e.g., Gurney et al., 2002) is due not only to increased productivity of natural ecosystems but also to historical land use (e.g., Pacala et al., 2001). Models are useful for sim-ulating the complex interplay of these factors, and studies have suggested that of the major factors affecting simulated net carbon exchange between the atmosphere and the
ter-restrial biosphere, CO2fertilization may have the strongest
decadal trend (e.g., Norby et al., 2005; Kicklighter et al.,
1999; McGuire et al., 2001). A realistic CO2 concentration
history was therefore needed for the entire MsTMIP simula-tion period.
The atmospheric CO2 concentration data prepared for
the MsTMIP are consistent with the GLOBALVIEW-CO2
(2011) data product (henceforth GV), the time series of
his-toric atmospheric CO2 from Antarctic ice cores
(MacFar-ling Meure et al., 2006), fossil fuel emissions (Marland et
al., 2008) and atmospheric CO2observations at Mauna Loa
(MLO) and the South Pole (SPO). During the period 1979– 2010, when the temporally and meridionally resolved GV
product is available, atmospheric CO2 concentrations are
set directly to the GV marine boundary layer reference sur-face interpolated to the MsTMIP global and North Ameri-can grids. Prior to 1979, we preserve the 1979–2010 mean
annual cycle from GV, and impose onto it a modeled CO2
surface that represents annual mean concentrations and a time-evolving meridional gradient. Following Conway and Tans (1999), the annual mean difference between MLO and SPO in the GV product is modeled as a linear function of fossil fuel (FF) emissions (Marland et al., 2008). Extrap-olated to zero FF emissions, the pre-industrial MLO–SPO difference estimated in this manner is 0.3 ppm. Performing
this same exercise using Scripps CO2program observations,
at MLO and SPO instead of GV, yields a stronger depen-dence of the meridional gradient on FF emissions and a pre-industrial MLO–SPO difference of −1.2 ppm. While it is
possible that pre-industrial Southern Hemisphere CO2
val-ues exceeded those in the Northern Hemisphere (Conway and Tans, 1999), we judge that it is more parsimonious to
as-sume a small pre-industrial inter-hemispheric CO2gradient,
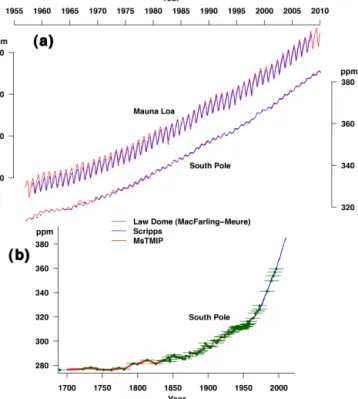
which the GV-based scheme achieves natively. The MsTMIP
atmospheric CO2product agrees well with Scripps CO2data
before 1979 at SPO and MLO (Fig. 5a), and with Law Dome ice core data in Antarctica (MacFarling Meure et al., 2006;
Fig. 5b) data. The MsTMIP atmospheric CO2 product
be-fore 1979, however, does not represent inter-annual variabil-ity other than that derived from variabilvariabil-ity in FF emissions,
Figure 5. Comparison of MsTMIP driver data atmospheric CO2
with independent data. (a) Comparison of MsTMIP and Scripps CO2program data at Mauna Loa and South Pole from 1958 to 2010,
and (b) comparison with Law Dome ice core records of atmospheric CO2(MacFarling Meure et al., 2006).
and it does not include speculative changes in the magnitude
or phase of annual cycles of CO2in the atmosphere.
3.4 Nitrogen deposition
Nitrogen enrichment, increasing atmospheric nitrogen de-position in particular, has been recognized as one of the most significant global changes since it could stimulate plant growth, enhance terrestrial carbon sequestration capacity and thus mitigate global climate warming (e.g., Holland et al., 1997; Pregitzer et al., 2008; Reay et al., 2008; De Vries et al., 2009). Models failing to capture nitrogen input and ni-trogen cycling may overestimate ecosystem carbon uptake (Hungate et al., 2003). Up to now, more and more TBMs include nitrogen deposition as an important driving force. However, few global and North American nitrogen deposi-tion products are available over the full period required by MsTIMP. Monitoring networks of nitrogen deposition in the United States and Europe were launched in the late 1970s, while other countries began such nationwide observations later (Holland et al., 2005; Lu and Tian, 2007). The Dentener global nitrogen deposition data product was generated using a three-dimensional chemistry transport model that estimated
atmospheric deposition of total inorganic nitrogen (N), NHx
(NH3 and NH+4), and NOy (all oxidized forms of nitrogen
other than N2O) for the years 1860, 1993 and 2050 at a
spa-tial resolution of 5◦ longitude by 3.75◦ latitude (Dentener,
2006; Galloway et al., 2004). Most TBMs that include ni-trogen deposition as an input driver do so by linearly inter-polating Dentener’s three-year maps into annual time series data, ignoring the different changing trends among different regions and different periods (Jain et al., 2009; Zaehle et al., 2010).
To address the above issue, we used a different approach as described in Tian et al. (2010) and Lu et al. (2012) to create a time-varying annual nitrogen deposition data set
for both global (0.5◦×0.5◦resolution) and North American
(0.25◦×0.25◦ resolution) simulations based on Dentener’s
maps and introduce spatial and temporal variations from ni-trogen emissions. This approach took the following assump-tions (details can be found in Supplement 3). For the time period between 1890 and 1990, annual variations in
nitro-gen deposition rate (NHx–N and NOy–N) were defined by
assuming that temporal trends of N-deposition are consistent with EDGAR-HYDE 1.3 nitrogen emission data (Van Aar-denne et al., 2001). The EDGAR-HYDE product provides
gridded (1◦×1◦ resolution) annual total emissions of NH3
and NOx from 10 anthropogenic sources. Nitrogen
deposi-tion was assumed to change linearly over the remaining time periods (1860–1890 and 1990–2010).
3.5 Land use and land cover change
LULCC has considerable influence on the biogeochemical cycling of carbon (e.g., Friedlingstein et al., 2010; Pielke Sr. et al., 2011; Sohl et al., 2012). Activities such as afforesta-tion (Potter et al., 2007) or deforestaafforesta-tion (Ramankutty et al., 2007) can alter carbon stocks. Similarly, biomass burn-ing used in land clearburn-ing results in direct carbon emissions (Giglio et al., 2010). Despite its importance in carbon cycle
dynamics, LULCC-caused CO2 emissions are poorly
con-strained and highly uncertain with a global mean (2000–
2009) value of 1.0 ± 0.5 Pg C year−1(Le Quéré, 2013).
Many global data products describing historical LULCC are available (e.g., Hurtt et al., 2011; Klein Goldewijk et al., 2011). In an effort to hold as many of the environmen-tal drivers constant as possible in the MsTMIP activity, we chose to prescribe LULCC by merging a static satellite-based land cover product, SYNergetic land cover MAP (SYNMAP) (Jung et al., 2006), with the time-varying land use harmo-nization (LUH) data for the fifth Assessment Report (AR5) of the Intergovernmental Panel on Climate Change (IPCC) (Hurtt et al., 2011). We chose the LUH product based on its global coverage, inclusion of land use change fractions (re-quired for a subset of participating models), overlap with the time horizon of MsTMIP simulations, and use in the IPCC process. The LUH product was derived using a bookkeeping approach based on historical time series of crop and pasture data, national wood harvest, shifting cultivation, and popu-lation (Hurtt et al., 2011). LUH product provides mapped
fractional coverages and underlying annual land use transi-tions for six land use classes (primary land, secondary land,
cropland, pasture, urban, and barren) at 0.5◦×0.5◦ spatial
resolution. The historical LUH data (1801–2005) were com-bined with a future projection (2006–2010) to match the time horizon of MsTMIP model simulations (1801–2010). This future projection was based on the Representative Concen-tration Pathway (RCP) (van Vuuren et al., 2011) 4.5 scenario,
which hypothesizes a net radiative forcing of 4.5 W m−2
(∼ 650 ppm CO2eq) by the end of the century based on a
set of greenhouse gas emissions and concentrations as well as land use trajectories.
As TBMs require a different land use/cover scheme than the six classes associated with the LUH, we merged the 1801–2010 LUH with the static 2000/2001 SYNMAP land cover product (Jung et al., 2006). Although numerous land cover products exist, we chose SYNMAP due to its (1) recon-ciliation of multiple global land cover products, i.e., Global Land Cover Characterization Database (GLCC) (Hansen et al., 2000; Loveland et al., 2000), GLC2000 (2003) and the 2001 MODIS land cover product (Friedl et al., 2002); (2) global coverage at 1 km resolution; and (3) general def-inition of classes based on life form, leaf type and leaf longevity which allowed for simple crosswalks to plant func-tional types (PFTs) used in different TBMs. Generality was a key concern as PFT schemes used in TBMs vary widely. The SYNMAP product contains 47 land cover classes such that a PFT scheme for a given TBM is a subset of SYNMAP classes based on a crosswalk between the two different schemes.
To provide annual maps of LULCC, LUH and SYNMAP were merged using a set of one-to-one and one-to-many map-ping rules based on map intersection during their period of overlap, i.e., both products exist for 2000–2001. These in-variant grid cell-specific mappings were then used to trans-late the six LUH classes to the 47 SYNMAP classes (Jung et al., 2006) for each annual LUH map. For example, assume a grid cell with LUH pasture at a fractional coverage of 0.5 for 2000–2001, in that same grid cell the SYNMAP product has only two eligible target classes: the shrubs and the grasses classes with fractional coverages of 0.2 and 0.4, respectively. This map intersection forms the basis of a one-to-many map-ping, i.e., 0.5 LUH pasture is equivalent to 0.17 SYNMAP shrubs plus 0.33 SYNMAP grasslands, which preserve the original shrubs / grasslands ratio in SYNMAP for that grid cell. This scalable mapping rule is used for all other time steps for this grid cell and reflects the legacy of grid cell-specific changes in land use/cover through time.
Few models use these 47 SYNMAP classes directly in their simulations. For example, the Simple Biosphere (SiB) model uses 12 biome classes (Sellers et al., 1996b). In such instances, model teams developed crosswalks from the 47 SYNMAP classification scheme to their internal schemes. Given that many SYNMAP classes are mixed classes, e.g., “shrubs and crops” and “trees and crops”, which cannot be accommodated by some models, we created maps of pure
biome classes by assuming each component in a mixed class was half the total area. Finally, as several models require in-formation on the photosynthetic pathway in grasslands as well as crop types, we also provided invariant maps for C3 / C4 grass types (Sect. 3.6) and major crops (Sect. 3.7).
3.6 C3 and C4 grass fractions
Because photosynthesis can vary significantly between species using the C3 and C4 photosynthetic pathways (Ehleringer and Cerling, 2002), most TBMs use separate al-gorithms for estimating the GPP of C3 and C4 plant types. In order to provide the required spatial distribution of ecosys-tems dominating each of these pathways, we used an ap-proach described in Still et al. (2003) based on growing season temperature. Since the C4 pathway is largely found in warm season grass species, we created a global
grid-ded (0.5◦×0.5◦) map of the relative fraction of C3 and C4
grasses using the present climate state based on the CRU– NCEP mean monthly precipitation and temperature data for 2000–2010. For grid cells characterized as grasslands (or containing grasslands) the relative fraction map defines the fraction of those grasses that are C3 or C4, so that in each of those grid cells the C3 and C4 grass fractions sum to 1 re-gardless of the total percentage of grassland contained in the grid cell.
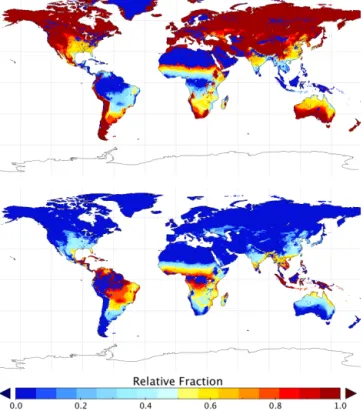
SYNMAP contains 13 land cover classes that include grasses, with 12 of these mixtures of grasses with trees, shrubs, crops or barren land. For the mixed classes, we as-sumed that grasses account for 50 % of the area of these mixed classes contained in each cell. The SYNMAP grass fraction in each cell was calculated as the sum of the grass fraction of all different classes, including both pure and mixed classes, in the cell. Figure 6 shows the relative fraction
of C3 (top) and C4 (bottom) grassland globally (0.5◦) under
present (2000–2010) climate conditions. The actual C3 and C4 grassland fractions depend on the overall grass coverage and can be zero if no grass is present in a particular grid cell.
The North American (0.25◦×0.25◦) C3 and C4 relative
grassland fraction maps were created using the same ap-proach, except that the NARR climate was used instead of CRU–NCEP. MsTMIP only provides a constant C3 / C4 data product under present climate conditions. For models that need time-varying C3 / C4 grass fractions, the same approach can be applied to historical land cover data and historical precipitation/temperature climate data to generate C3 / C4 grassland maps for previous years.
3.7 Major crops
The SYNMAP land cover map indicates which areas are pre-dominantly crop but does not provide additional information about the crop types contained within each grid cell. This can be important when, for example, a C4 crop like maize dominates a grid that would normally be covered by C3
veg-Figure 6. Relative fractions of C3 (top) and C4 (bottom) grassland
on global 0.5◦scale under the present climate (2000–2010).
etation, and vice-versa. Some models make use of such addi-tional information to implement crop specific algorithms that capture some aspects of crop physiology and management including planting and harvesting phenology, fertilizer appli-cations, irrigation or tillage practices. We therefore identified and extracted the four globally significant crop types (maize, rice, soybean and wheat) from the Monfreda et al. (2008) global crop database. The original Monfreda global crop product is a detailed database of global agricultural prac-tices and describes the areas and yields of 175 different in-dividual crops in 2000 at a 5 min × 5 min (approximately 10 km × 10 km) spatial resolution. We resampled the original
Monfreda crop data to 0.5◦×0.5◦(global) and 0.25◦×0.25◦
(North American) spatial resolutions. These major crop des-ignations do not provide detailed model simulation prescrip-tion, but rather guidance for models that need to specify crop types or cropping systems.
3.8 Phenology
Some models do not have prognostic canopies and use remote-sensing products to prescribe plant phenology to cal-culate GPP or NPP. Consequently, we constructed monthly maps of normalized difference vegetation index (NDVI), leaf area index (LAI) and absorbed fraction of photosyntheti-cally active Radiation (fPAR) consistent with the MsTMIP LULCC data on both global and North American grids for
1801–2010. For NDVI data, we chose the Global Inventory Monitoring and Modeling System version g (GIMMSg) data set (Tucker et al., 2005), because it provides the longest global observation-based product. The Postdam NPP MIP also used the GIMMS product to define NDVI; however, their protocol did not mandate consistent driver data across all its participating models (Cramer et al., 1999). GIMMSg consists of 15-day maximum value composites at about 8 km spatial resolution from 1982 to 2010 adjusted for missing data, satellite orbit drift, sensor degradation and volcanic aerosols (Tucker et al., 2005). We used the average sea-sonal cycle in NDVI for the entire time period from 1801 to 2010, since switching to observed values in 1982 would create abrupt changes in model output that would be difficult to interpret. The 15-day GIMMSg NDVI was first regridded
to 0.5◦×0.5◦(global) and 0.25◦×0.25◦ (North American)
resolutions using area-weighted averaging. The NDVI data were fitted to the MsTMIP land masks using the nearest-neighbor technique to gap fill missing points. To minimize noise due to cloud and aerosol contamination, we converted the regridded 15-day GIMMSg NDVI to monthly maximum value composites and then calculated the average of all Jan-uary maps, the average of all FebrJan-uary maps, etc., to create the average NDVI seasonal cycle. We calculated fPAR and LAI from the average seasonal cycle of GIMMSg NDVI us-ing methods described in Sellers et al. (1996b) and Schaefer et al. (2002).
To harmonize phenology data with the LULCC used in MsTMIP, we assumed that a pixel would consist of tiles, each corresponding to a different land use/cover class with fractional areas set by the MsTMIP LULCC coverage maps as a function of year from 1801 to 2010. We first calculated maps of LAI and fPAR assuming the entire land surface was one of the 12 SiB biome classes (Sellers et al., 1986) result-ing in 12 sets of LAI and fPAR maps correspondresult-ing to the 12 SiB biome classes, all calculated from the same NDVI values but using different parameter values unique to each biome (Sellers et al., 1996b). We then mapped the 12 SiB biomes to the 47 SYNMAP land use/cover classes using one-to-one or one-to-many mapping, resulting in 47 sets of LAI and fPAR maps corresponding to the 47 SYNMAP classes. This two-step process was required because the parameters used to calculate LAI and fPAR are not available for each of the 47 SYNMAP types. By combining these 47 sets of LAI and fPAR maps and the yearly MsTMIP LULCC data, the time-evolving and land use/cover class explicit LAI and fPAR data products were created. If a grid cell did not con-tain a particular SYNMAP class in a specific year, a standard missing value was inserted into the corresponding LAI and fPAR maps. A model would then extract the LAI and fPAR values for a particular SYNMAP class in each year and use it for the corresponding tile.
3.9 Soil
The Food and Agriculture Organization – United Na-tions Educational, Science and Cultural Organization (FAO-UNESCO) digitized soil map of the world (FAO, 1971–1981, 1995, 2003), originally published in 1974, is commonly used in terrestrial biosphere modeling. Recently, however, signif-icant improvements in soil mapping and databases of soil properties have led to a new generation of regional and global scale soil maps, such as the International Soil Reference and Information Centre (ISRIC) World Inventory of Soil Emis-sion Potentials (ISRIC-WISE) (Batjes, 2008) and the harmo-nized world soil database (HWSD) (FAO/IIASA/ISRIC/ISS-CAS/JRC, 2011). This new generation of soil products have increased details in the spatial distribution of soil types and more accurate characterizations of soil physical and chemical properties.
For MsTMIP, we selected and synthesized the HWSD v1.1 for global simulations because it was the most recent global soil database that incorporates updated soil data from Europe, Africa, and China. However, in both the ISRIC-WISE and HWSD databases, soil information for North America is based on an outdated FAO-UNESCO soil map from the 1970s. Thus, even in the most updated global soil databases, North America is less reliable than the other re-gions due to the use of an obsolete database (Batjes, 2005; FAO/IIASA/ISRIC/ISS-CAS/JRC, 2011). We therefore de-veloped the Unified North American Soil Map (UNASM) by fusing the United States Department of Agriculture Natural Resources Conservation Services (USDA-NRCS) State Soil Geographic (STATSGO2) data set with both the soil land-scapes of Canada (SLC) version 3.2 and 2.2 products, and the HWSD v1.1 (Liu et al., 2013).
Both data prepared for MsTMIP, the gridded 0.5◦HWSD
for global simulations and 0.25◦ UNASM for North
Amer-ican simulations, contain two standardized soil layers. The topsoil layer ranges from 0 to 30 cm and the subsoil layer ranges from 30 to 100 cm. For each soil layer, eight physical and chemical soil properties, including clay/sand/silt frac-tions, pH, organic carbon, cation exchange capacity, refer-ence bulk density and gravel content, were compiled (Ta-ble 1). These varia(Ta-bles are used by TBMs to calculate soil column hydrological characteristics that determine the dy-namics of available soil water for plant transpiration and soil evaporation. Organic carbon content is provided for models that make use of an estimate for initialization.
3.9.1 Global soil: gridded HWSD
The HWSD had been widely used as input for global-scale carbon cycle modeling and MIP activities (e.g., ISI-MIP; Warszawski et al., 2013), and therefore was used to define MsTMIP global soil data. The original HWSD is a 30 arcsec raster database with over 16 000 different soil mapping units that combines existing regional and national updates of the
soil information worldwide, including the Soil and Terrain database (SOTER), European Soil Database (ESD), Soil Map of China, and WISE, with the information contained within the 1 : 5 000 000 scale FAO-UNESCO soil map of the world (FAO/IIASA/ISRIC/ISSCAS/JRC, 2011).
Each soil mapping unit in the HWSD is composed of several different soil units (or soil types) defined by ma-jor soil group code following a combined FAO-74/FAO-85/FAO-90 soil classification system. For the global simu-lations, the original HWSD was regridded to a spatial
resolu-tion of 0.5◦×0.5◦by selecting the dominant soil type within
each grid cell. Eight physical and chemical soil properties as-sociated with the dominant soil type in each soil layer were then selected. In addition to physical and chemical soil prop-erties for each dominant soil type, we also provided modelers with the HWSD reference soil depth, as a proxy for mineral soil depth, even though this reference soil depth is not pre-cise.
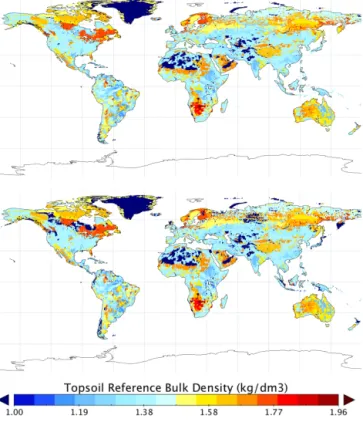
The reference bulk density values provided in HWSD v1.1 were calculated following the method developed by Sax-ton et al. (1986) that relates bulk density to soil texture. This method, although generally reliable, tends to overes-timate the bulk density in soils that have a high porosity (e.g., Andosols) or that are high in organic matter content (e.g., Histosols). Therefore, the bulk density values of these two soil types were corrected using the corresponding depth-weighted average values from ISRIC-WISE, version 1.0. Figure 7 shows the globally gridded HWSD topsoil refer-ence bulk density before and after correction. The correction mainly impacts the North American boreal region and a few places of southeastern Asia where Andosols and Histosols dominate.
3.9.2 North American soil: Unified North American Soil Map (UNASM)
A new gridded database of harmonized soil physical and chemical properties for North America was created for MsT-MIP by fusing the most recent regional soil information from US STATSGO2, SLC version 3.2 and 2.2, and the HWSD v1.1. The fused database was then harmonized into two stan-dardized soil layers as for the HWSD. The top soil layer ranges from 0 to 30 cm and the sub-soil layer ranges from 30 to 100 cm. The comparison with the subset of HWSD demon-strates the pronounced difference in the spatial distributions of soil properties and soil organic carbon mass between the UNASM and HWSD, but overall the UNASM provides more accurate and detailed information particularly in Alaska and central Canada. The methods used to develop the UNASM and the comparisons with HWSD are described in detail in Liu et al. (2013).
Figure 7. HWSD topsoil reference bulk density before (top) and
after (bottom) correction at 0.5◦resolution.
4 Spin-up data package
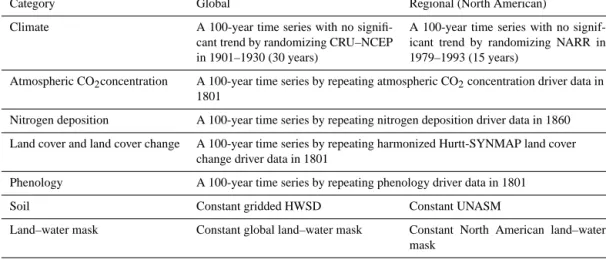
A consistent spin-up data package shared among models eliminates any differences in prediction due to spin-up data choices. We created the spin-up data package using the stan-dardized environmental driver data sets described above. MsTMIP requires that all simulations assume steady-state initial conditions in 1801. The spin-up driver data package contains a 100-year time series for each required environ-mental driver data product (Table 2) that can be recycled until steady state is reached. For climatology, the 100-year spin-up time series was created by randomly selecting from the first 30 (1901–1930, global) or 15 (1979–1993, North America) years of climate driver data on the yearly time step. Using the first 30 or 15 years of climate driver data ensures a smooth transition from the spin-up to transient simulations, while preserving the seasonal cycle of the meteorological variables. A 100-year period for the spin-up package was chosen to minimize any long-term trend in spin-up climate data; thus, minimizing drift in reference simulations, which use con-stant driver data (Huntzinger et al., 2013). Nitrogen
deposi-tions were held constant at 1860 values and atmospheric CO2
concentrations were held constant at 1801 values to repre-sent near-pre-industrial conditions and ensure a smooth tran-sition between spin-up and transient simulations. Similarly, LULCC and phenology data were held constant at 1801 val-ues so that near-pre-industrial land cover characteristics and
corresponding phenology could be captured in model spin-up. Soil data was assumed to be constant across the whole spin-up period.
All transient simulations defined by MsTMIP re-quire driver data sets covering the period of 1801–2010 (Huntzinger et al., 2013). However, several of the environ-mental driver data sets, including climate, nitrogen deposi-tion, and soil, do not cover the full period. The spin-up data package was thus recycled to fill these temporal gaps. For global climate data, the spin-up data were used directly to fill the gap between 1801 and 1900. For the NARR climate (North American) data, the full 100-year time series plus the first 78 years of the North American spin-up climate data were used to fill the gap between 1801 and 1978. The ni-trogen deposition data in 1860 were repeated to fill the gap between 1801 and 1859 for nitrogen deposition driver data. Finally, constant soil data were used throughout the simula-tion period of 1801–2010.
5 Lessons learned
Some of the lessons learned in the process of data prepara-tion and distribuprepara-tion for MsTMIP have implicaprepara-tions beyond the MsTMIP project. These are described here in order to provide some guidance for future data-intensive activities, especially those that involve assembling consistent data sets for use by multiple modeling teams. Some of these lessons have previously been described in the context of other MIPs (e.g., Kittel, et al., 1995 and 2004), but continue to present challenges and should therefore be taken into account in the design of future efforts.
1. Study the past
Scientific discoveries rely heavily on findings from past activities. This is especially true for data-intensive, multi-partner MIP activities like MsTMIP. Beginning with VEMAP in the 1990s, there have been several MIPs conducted that have advanced our understanding of ecosystem dynamics and supported model develop-ment. The preparation of environmental driver data sets for MsTMIP has been inspired by past/current MIPs, such as VEMAP, GCP-TRENDY and NACP interim synthesis activities. The design of the MsTMIP envi-ronmental driver data sets benefited from studying the lessons learned from these past activities and helped us to avoid pitfalls (e.g., biases in some reanalysis climate variables) or duplicate work unnecessarily (e.g., lever-aging climate data prepared for GCP-TRENDY), and thus helped to reduce data preparation time.
2. Resources for data planning, preparation and management
Dedicated funding and expertise are needed to develop a plan with the modeling teams and to conduct the
Table 2. The MsTMIP spin-up environmental driver data summary.
Category Global Regional (North American)
Climate A 100-year time series with no signifi-cant trend by randomizing CRU–NCEP in 1901–1930 (30 years)
A 100-year time series with no signif-icant trend by randomizing NARR in 1979–1993 (15 years)
Atmospheric CO2concentration A 100-year time series by repeating atmospheric CO2concentration driver data in
1801
Nitrogen deposition A 100-year time series by repeating nitrogen deposition driver data in 1860 Land cover and land cover change A 100-year time series by repeating harmonized Hurtt-SYNMAP land cover
change driver data in 1801
Phenology A 100-year time series by repeating phenology driver data in 1801
Soil Constant gridded HWSD Constant UNASM
Land–water mask Constant global land–water mask Constant North American land–water mask
driver data compilation. The preparation of standard-ized model input driver data sets, especially for a project with many different collaborators, takes a significant amount of time and effort. Besides data processing, de-tailed documentation has to be compiled to capture all the processing steps and trace the origin of each data file. A long-term data management plan is needed to preserve and share the data after a project ends and max-imize the value of the data products whenever they are used. Data centers should be identified for long-term data preservation, and the data center’s requirements for metadata and documentation should be established at the beginning of the project.
3. Collaboration between informatics and science researchers
For a project like MsTMIP, informatics personnel and modeling teams need to work closely together to de-velop a shared set of requirements for the data prod-ucts and to ensure that useful data prodprod-ucts suitable for long-term preservation are produced. Close collabora-tion is required for acquisicollabora-tion, harmonizacollabora-tion and or-ganization of the scientific data products both for the project and for future use.
4. Proper data formats and standards
Non-proprietary and standard data and metadata for-mats (e.g., netCDF, comma-separated values (CSV), geotiff, CF metadata convention, or FGDC metadata
standard8) should be used to maximize the
interoper-ability of the data. Standards make data easier to un-derstand and minimize the ambiguity and potential er-rors when using a given data product, especially beyond its original intended use.Standards also help with the
8Federal Geographic Data Committee geospatial metadata, http:
//www.fgdc.gov/metadata.
long-term preservation and usability of data (Hook et al., 2010). In addition, a data management effort should consider both current and future needs when choosing appropriate data and metadata formats.
5. Version control of data files
A controlled repository and versioning system should be used to control data files, not only for final data prod-ucts to be released to modeling teams and the commu-nity but also for intermediate data to be shared between different processing steps and among project collabora-tors. When working with a large volume of data files with complicated data processing steps, version control is critical for ensuring that intermediate data files are self-consistent, that the provenance of data is correctly captured, and that final data products are properly dis-tributed to data users.
6. Workflow systems to improve reproducibility and collaboration among team members
Data processing is an error-prone activity. Even if every processing step is performed correctly, the processing algorithms themselves usually need adjustments to cre-ate better quality data products. Requirements on final data products sometimes change unexpectedly. In prac-tice, therefore, similar data processing activities will usually be done multiple times before data products are finalized. In MsTMIP, a workflow system (e.g.,
Vis-Trails9and Kepler10) was not used, and as a result
sig-nificant dedicated time was required to properly capture and adjust the settings and executing environment as-sociated with each processing step. If a workflow sys-tem had been used, different data processing steps could have been packaged as individual modules and chained
9VisTrails, http://www.vistrails.org. 10Kepler, https://kepler-project.org.
together as workflows, minimizing the time required to trace and reproduce processing steps (Santos et al., 2013). In addition, data reprocessing could have been automated.
7. QA/QC
Quality assurance and quality control (QA/QC) is nec-essary not only for the final data products, but also for any intermediate data product produced. Depending on the characteristics of data products, different man-ual and automatic QA/QC approaches (e.g., visman-ualiza- visualiza-tion, statistics and long-term trend analysis) can be used to identify potential errors. The best way to QA/QC data products is always to collaborate with domain re-searchers and test data with real science applications. 8. On-demand approach to distribute data
For a project such as MsTMIP that involves over 20 modeling teams, it is not possible to prepare a single set of data that meets the requirements of all models. TBMs have different native temporal resolutions, for example, and modelers may therefore need to regrid data. Sim-ilarly, if the products are used for future applications (outside the projects for which they were created), they may need to be subset to a smaller geographic region, rescaled to a different spatial resolution, or translated to a different geographic projection. On-demand data dis-tribution systems, like the Thematic Realtime
Environ-mental Distributed Data Services11 (THREDDS) data
server and Open Geospatial Consortium (OGC) Web Coverage Services (WCS), can perform spatial and tem-poral subsetting, as well as resampling, and can there-fore help address the diverse needs of different research activities (Wei et al., 2009).
9. “Better is the enemy of good enough”
There is constant pressure to create the best data sets possible, but this must be balanced against the overall priority of completing the simulations. If too much time is spent improving the driver data, the time available for model simulations and the evaluation of modeling re-sults is compromised. Therefore, in order to maintain momentum, there comes a time when a decision has to be made to freeze data improvement activities and release a specific version of data products to modeling teams.
6 Conclusions
This paper presents the reasoning for, and a description of, driver data and spin-up procedures used in the setup of
11Thematic Realtime Environmental Distributed Data
Ser-vices (THREDDS), http://www.unidata.ucar.edu/software/thredds/ current/tds/
the global and North American simulations that are part of the MsTMIP activity. These data sets include climate,
at-mospheric CO2concentration, nitrogen deposition, LULCC,
C3 / C4 grasses fraction, major crop, phenology, soil data and land–water mask information. In many cases, we found it necessary to develop new or enhanced data sets to serve the needs of long-term, high-resolution TBM simulations. In addition, the need for the data sets to be compatible with over 20 participating TBMs resulted in strict requirements for all data sets considered. These standardized drivers are designed to provide consistent inputs for models participating MsT-MIP to minimize the inter-model variability caused by differ-ences in environmental drivers and initial conditions. Thus, these consistent driver inputs, together with the sensitivity simulations defined by MsTMIP, enable better interpretation and quantification of structural and parameter uncertainties of model estimates.
In addition to serving the needs of the MsTMIP activity, this work is intended to serve the needs of researchers wish-ing to leverage the data products produced by MsTMIP for follow-on studies or related applications. Finally, we offer our experience with MsTMIP as a case study in the develop-ment of data sets for collaborative scientific use. The lessons learned from the work reported here, including the need for dedicated support for data development and sharing, for it-erative product development, and for the generation of eas-ily accessible and traceable products, among others, are thus broadly applicable. As such, we aim for this work to inform future efforts focused on assembling consistent data sets for use by multiple modeling teams.
All standardized model input driver data sets are archived in the ORNL DAAC to provide long-term data management, preservation, and distribution to the community (Wei et al., 2014).
The Supplement related to this article is available online at doi:10.5194/gmd-7-2875-2014-supplement.
Acknowledgements. Funding for the Multi-scale Synthesis and Terrestrial Model Intercomparison Project (MsTMIP) was provided through NASA ROSES grant no. NNX11AO08A. Data management support for preparing, documenting, and distributing model driver was performed by the Modeling and Synthesis Thematic Data Center (MAST-DC) at Oak Ridge National Laboratory, with funding through NASA ROSES grant no. NNH10AN68I. MsTMIP environmental driver data can be obtained from the ORNL DAAC (http://daac.ornl.gov) and the simulation outputs can be obtained from the MsTMIP product archive (http://nacp.ornl.gov/MsTMIP.shtml). This is MsTMIP contribution no. 2. We would like to thank the MsTMIP Modeling teams that participated in discussions of the requirements and characteristics of driver data needed for the simulations, as well as the protocol for running the simulations.