DYNAMIC COMPLEX SMART COLLOIDS FOR THE DETECTION OF BIOMOLECULES
by Qifan Zhang
B.S., Chemistry
University of Illinois at Urbana-Champaign, 2013
Submitted to the Department of Chemistry in Partial Fulfillment of the
Requirements for the Degree of
Doctor of Philosophy in Inorganic Chemistry
at the
MASSACHUSETTS INSTITUTE OF TECHNOLOGY June 2018
C 2018 Massachusetts Institute of Technology. All rights reserved.
Signature redacted
Signature of Author: ....Signature redacted
Certified by: ...j1
Department of Chemistry May 10, 2018 ... Timothy M. Swager John D. MacArthur Professor of ChemistrySignature redacted
A ccepted by: ... MASSACHUSETS INSTWUTE OF TECHNOLOGYJUN 2 02018
LIBRARIES
ARCHIVES
Thesis Supervisor Robert W. Field Haslam and Dewey Professor of Chemistry Chairman, Departmental Committee on Graduate Students-2-This doctoral thesis has been examined by a Committee of the Department of Chemistry as follows:
Signature redacted
Professor Christopher C. Cummins...Signatu
Professor Timothy M. Swager...Professor Yogesh Surendranath...
... Department of Chemistry Thesis Committee Chairman
re redacted
...
k-,j Department of Chemistry Thesis AdvisorSignature redacted
Department of Chemistry Committee Member -3--NDYNAMIC COMPLEX SMART COLLOIDS FOR THE DETECTION OF BIOMOLECULES by
Qifan Zhang
Submitted to the Department of Chemistry in Partial Fulfillment of the Requirements for the Degree of Doctor of Philosophy in Chemistry
ABSTRACT
Complex smart colloid is a new class of dynamically reconfigurable emulsion droplets that switch morphologies between encapsulated and Janus configuration upon binding to chemical and biological analytes. The changes of morphologies or orientations of the Janus droplets are readily detected with an optical transduction mechanism. The dynamic complex smart colloids are ideal sensing particles for aqueous sensing of biomolecules such as bacteria, oligonucleotide, antibodies and viruses.
This thesis expands the applications of complex smart colloids as bioassays that can be potentially adopted in food and beverage industry, environmental monitoring and medical diagnostics. In Chapter 2, we demonstrate an example of using emulsion agglutination assay for E.coli sensing with a continuous phase carbohydrate surfactant. In Chapter 3, we expand the emulsion assay by using interfacial bioconjugation methods and eliminating the needs of a synthetic surfactant in the continuous phase. In Chapter 4, we develop the protein-protein agglutination assay with a thermal stable protein conjugate to the droplet-water interface for sensing of Zika protein NS 1.
Thesis Supervisor: Timothy M. Swager
Title: John D. MacArthur Professor of Chemistry
-6-Table of Contents
T itle P ag e ... 1
S ignature P age ... 3
Abstract...5
Table of Contents...7
L ist of F igu res...9
L ist of Schem es...15
C hapter 1: Introduction ... 17
1.1 S en sors... 17
1.2 Colloid and Liquid Emulsion Sensors...17
1.3 Dynamic Smart Colloids as Sensors...19
1.4 Challenges and O bjectives...24
1.5 R eferences...26
Chapter 2: Janus Emulsions for the Detection of Bacteria...29
2.1 Introduction ... 30
2.2 Results and Discussion... 31
2.3 C onclusions... 39
2.4 Experimental Details...39
2 .5 R eferences...49
Chapter 3: Interfacial Bioconjugation on Emulsion Droplet for Biosensors...53
3.1 Introduction ... 54
3.2 Emulsion Assays and Surfactants Design...55
3.3 Emulsion Assays for Bioconjugation...57
3.4 Biomolecule Functionalized Emulsion Assays...62
3.5 C onclusions...67
3.6 Experim ental Section...66
3.7 R eferences...76
Chapter 4: Emulsion Agglutination Assay for Sensing of Zika Virus...79
4 .1 Introduction ... 80
4.2 Results and Discussion...81
4 .3 C onclusions...86
-7-4.4 Experimental Details...87
4.5 R eferences...90
Appendix 1: NMR Spectra for Chapter 2...93
Appendix 2: NMR Spectra for Chapter 3...95
Appendix 3: IR Spectra for Chapter 3...99
A cknow ledgem ents...101
-8-List of Figures Figure 1.1. Figure 1.2. Figure 1.3. Figure 1.4.
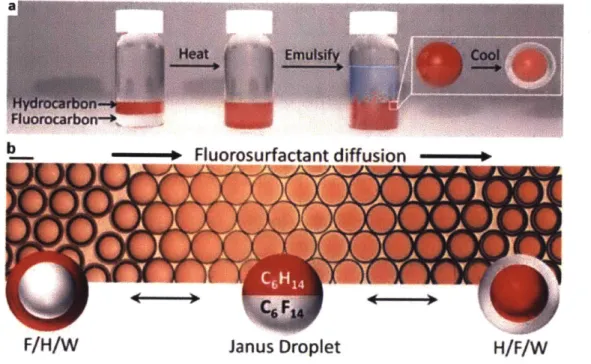
-9-a) Complex emulsion fabrication. b) Complex emulsion morphology change with FC surfactant diffusing from left to right ... 20
Complex emulsion morphology controlled by three interfacial tensions kH, XF and
FH. (1) F/H/W. (2) Janus. (3) H/F/W...21
Droplet morphology change by using stimuli-responsive surfactants. a) Morphology change from F/H/W to H/F/W with light and pH. b) Morphology change with enzyme activity... 22
Reconfigurable droplets act as tunable lenses and the optical transmission of an emulsion film depends on the droplet morphology. a) Schematic ray diagrams of the complex droplets composed of hydrocarbon and fluorocarbon within a continuous phase of aqueous solution. b) Aligned beneath the droplet schematics are corresponding photographs of polydisperse emulsions in a Petri dish placed over an image of a smiley face to demonstrate changes in the optical transmission.
... 2 4
a) Side view of a Janus droplet stabilized by ManCl4 and Zonyl FS 300. Optical micrographs of b) trans-parent pristine monodispersed Janus emulsions and c) agglutinated Janus emulsions scatter light after exposure to ConA. Scale bar 100 pm. Schematic representation of Janus emulsion agglutination. d) Multivalent binding of ConA to ManC 14. e) Agglutinated Janus emulsions with ConA and M anC l4 ... . . 32 Figure 2.1.
Figure 2.2. Figure 2.3. Figure 2.4. Figure 2.5. Figure 2.6. - 10
-Scheme and optical images showing directional morphology change with addition of excess Zonyl surfactant. The hexane phase has been dyed in pink for display purposes. a), c) Janus emulsion change into H/F/W double emulsion. b), d) Agglutinated Janus emulsion with addition of ConA. Scale bar equals 50 tm....33
a) Schematic view of qualitative detection of the agglutinated Janus emulsions. The Janus emulsions are placed on a transparent analysis chamber. The QR code enables the binary qualitative detection of agglutination. b) Optical signal detected using a QR code before and after exposure to ConA. c) The focusing distance D, with droplet monolayer as a lens and QR code as the object. d) Correlation of the threshold ConA concentration for the binary signal with D...35
Correlation of ConA concentration and agglutination level. a) Janus emulsion without ConA. b) With 0.03 mg mL-1 ConA. c) With 0.12 mg mL-1 ConA. d) Correlation between concentration of ConA and agglutination level. Scale bar equals 250 tm ... 36
Micrographs showing emulsion agglutination with E.coli bacteria. a) Janus emulsions change into H/F/W double emulsion after 48 h incubation with live ORN 178 E.coli. Agglutination is also observed. b) Janus emulsions agglutination, 2 h after 4% paraformaldehyde treated ORN 178 E.coli bacteria (104 cfu mL-1) were added. c) No agglutination was observed with ORN 208 strains under the same testing conditions. Scale bar equals 100 tm... 38
Figure 2.7.
Figure 2.8.
Figure 2.9.
Figure 3.1.
Figure 3.2.
Dynamic complex emulsion droplets. a) H/F/W double emulsion in 0.01% Zonyl FS300 solution. b) Janus emulsion in solution of 0.0005% ManC14:0.01% Zonyl = 6:5 (v:v). c) F/H/W double emulsion in 0.0005% ManC14 solution. Scale bars: 50 pm ... . . 43
Algorithm for image analysis. The image processing program evaluated the raw image (a) by applying adaptive thresholding algorithm to distinguish area with higher transparency from opaque regions (b). The final locations of the agglutination were highlighted (c). Scale bars: 500 pm ... . . 46
Agglutination behavior of ManC 14 emulsion assay with two proteins ConA and
BSA. Agglutination valued with QR code detection
m ethod ... . . 47
Confocal microscopy images of cysteine-BODIPY functionalized droplets using interfacial maleimide-thiol chemistry. Scale bar in 50 ptm. a) Confocal z-stack images of emulsion droplets containing GA16-MA after covalent dye functionalization, 10 X magnification. b) Confocal cross-section of the droplet containing GA16-MA after covalent dye functionalization, 20 X m agnification ... 60
The ratio of emission intensity at the interface (EBODIPY) and inside (Eanthracene)
relative to the continuous tween 20 surfactant concentration. The higher concentration of Tween, the more surface area for the hydrocarbon-water interface... . ... 62
-Figure 3.3.
Figure 3.4.
Figure 3.5.
Figure 3.6.
Figure 3.7
Protein A functionalized emulsion droplet for the detection of anti-mouse IgG. Scale bar in 50 pm. a) Microscope image of Protein A functionalized droplets in Janus morphology. b) Microscope image of droplet in F/H/W after IgG bind to protein A. c) Confocal cross section image of droplets with IgG at the hydrocarbon-water interface, in F/H/W morphology. d) Protein A functionalized transparent Janus droplets enables scanning of the QR code. e) After IgG binding to protein A, F/H/W emulsions droplets become less transparent and blocks the QR code inform ation. ... 64
Images of Zonyl forced droplets after IgG binding to protein A. Scale bar in 50 pim. a) Zonyl forced deformation of emulsion droplet on the side under microscope. b) Confocal z-stack images of deformed droplets showing covalent bond formation at the droplet interface. ... 65
Confocal image of droplet functionalized with fluoresceineamine using Scheme 3.3 a/b ... 7 4
a) Confocal image of BODIPY-FL-Cysteine treating droplets with GA16-MA loaded in the droplets. Color bar showing the fluorescent intensity. b) Pristine droplet treated with the same concentration of BODIPY-FL-Cysteine and no bright ring was observed. Light fluorescence inside the droplet indicates minor solubility of the fluorophore in the droplet phase. ... 74
a) Confocal image of oligonucleotide P1 functionalized droplet with complementary strand P2 bearing a 6-FAM fluorophore (Scheme 3.5a). b)
-12-Confocal image of mannose functionalized droplet binds to ConA-FITC (Scheme
3.5b). Scale bar in 50 pm ... 75
a) Scheme showing the inner filter effect with perylene in hydrocarbon phase and
F-PDI in the fluorocarbon phase. b) The absorption and emission spectra of perylene and F-PDI. c) Experimental setup of the detection scheme. d) Expected
emission ratio before and after droplets were agglutinated. ... 84
Optical readout with inner filter effect in correlation with Streptavidin concentration. The ratio EH/EF refers to the emitted light intensity coming from the
respective hydrocarbon and fluorocarbon phases. ... 85
Optical readout with inner filter effect in correlation with Zika NS 1 concentration.
... 8 6
- 13
-Figure 4.1.
Figure 4.2.
-List of Schemes
Scheme 3.1.
Scheme 3.2.
Scheme 3.3.
Scheme 3.4.
Dynamic complex emulsions morphology change. The red phase is the hydrocarbon oil and the grey phase is the fluorocarbon oil. The color is used hereafter only for display purpose. From left to right, showing the increased strength of hydrocarbon surfactant or the decreased strength of fluorocarbon surfactants. H/F/W as in hydrocarbon-in-fluorocarbon-in-water and F/H/W as in fluorocarbon-in-hydrocarbon-in-water...56
Structures of GAl2OH surfactant with three segments...57
Interfacial functionalization on the Janus droplet. The red phase is the organic oil and the gray phase is the fluorinated oil. a) In situ formation of GA12-NHS at droplet interface and subsequent amine conjugation. b) Pre-synthesized GA12-NHS was dissolved in the droplet hydrocarbon phase and preferably located at the
hydrocarbon-water interface after trifluoroethanol diffuses out to the continuous phase, followed by interfacial amine conjugation. c) Pre-synthesized GA 16-MA for
interfacial thiol conjugation. FL in the schemes indicates generic fluorophores.
... . . .. 59
Dynamic emulsion droplets with controlled reactivity. Droplets start in different morphology and functionalized at the hydrocarbon-water interface. Droplets were then tuned to the Janus morphology for imaging. Higher intensity in green channel indicates higher level of functionalization at the interface. Higher intensity in green channel indicates higher functionalization at interface...61
-Scheme 3.5. Scheme 3.6. Scheme 3.7 Scheme 3.8 Scheme 3.9 Scheme 4.1. Scheme 4.2.
Droplet functionalization with protein A and detection scheme with
im m unoglobulin (IgG )...63
a) Bioconjugation with oligonucleotide followed by hybridization. b) Bioconjugation with mannose derivative for the binding of concanavalin A...66
Synthesis of G A I2O H ... 72
Synthesis of G A 12-N H S...72
Synthesis of GA 16-M A ... 73
a.) Synthesis of maleimide functionalized surfactant P1-MA from a polystyrene-polyacrylic acid polymer. b.) Bioconjugation of Sso7d to the droplet H/W interface via maleimide-thiol chemistry. The addition of streptavidin to the Sso7d functionalized droplets assay cause agglutination. The hydrocarbon phase is shown in red for display purpose. Scheme not to scale...82
Droplets starting at different morphologies, namely H/F/W, Janus and F/H/W functionalized with cysteine engineered Sso7d. The continuous phase was exchanged to tune the morphology into Janus followed by addition of 10 RL of 1 mg mL1 streptavidin. The micrographs were taken with optical microscope at 10 x magnification. Scale bar equals 100 pm...83
-Chapter 1 Introduction
-1.1 Sensors
Low cost, low power, and portable chemical/biological sensors can be practical alternatives
to conventional analytical instrumentation for various applications,I such as food testing, environmental monitoring, and homeland security. Sensors respond to local environmental change with an analytically useful signal. The design of innovative sensing materials, including carbon nanotubes, graphenes, polymers and even functionalized papers, provides new opportunities to transform the core chemical/biological recognition into a digitalized signal. These types of sensors have huge cost and accessibility advantage over conventional analytical instrumentation, which requires large capital upfront investment and proficient technicians.
The sensing materials have to be carefully selected for the suitable applications. Carbon based nano-materials for example are ideal for gas sensing because of their high surface areas for gas molecule recognition and changes in electronic resistance for signals.2 Aqueous sensing on the other hand can be challenging when there is high electrolyte conductance background in the continuous phase, which is common for most of the bioassays.
1.2 Colloid and Liquid Emulsion Sensors
Colloidal nano-and micro-particle based materials have attracted a great deal of attention in the past decades, particularly in biological sciences and diagnostics.3 The colloidal system is a multiphasic platform that combines different functionalities into a single carrier system. Additionally, the simple fabrication process, long stability, design flexibility provides promises to mimic live cells in biological systems. Colloidal sensors range from single and micro nanoparticles (NPs)4 to complex hybrid microstructures5 and have been widely used for sensing of biomolecules including nucleotides,6antibodies,7 bacteria' and viruses.9
-18-Liquid emulsions, are a class of colloidal materials, wherein a mixture of two or more immiscible liquids are stabilized by surfactants to give particles. Liquid components are dispersed in a continuous liquid phase forming simple or complex emulsions. Complex emulsions with different geometries and compositions, including Janus emulsions (droplets with faces that exhibit differing physical properties) and multiple emulsions have recently become a focus of research interest because of their promising applications in pharmaceuticals10, medical diagnostics",
cosmetics12, dynamic optics'3 and chemical separations". Emulsions are mostly fabricated using
microfluidics, 5 ultrasonic or membrane extrusion.16 Emulsion droplets can also function as cargos
carrying active drug molecules and have been studied extensively in the field of drug delivery.17
Most of the liquid emulsion reported as sensors in the literature are around liquid crystal (LCs) emulsion droplets.' 8 The high sensitivity of the LC emulsion droplets attributes to their intrinsic optical properties and the change of orientational order associated with the molecular-level recognition at the LC interface.19 A more ideal emulsion based sensor system would be able to maintain these optical properties but also provides more capabilities of functionalization at the interface for specific binding of the chemical and biological analytes.
1.3 Dynamic Smart Colloids as Sensors
Our group recently reported a new class of dynamically reconfigurable complex emulsion droplets that can switch their morphology between encapsulated and Janus configurations upon exposure to external stimuli.20 The change of morphologies between hydrocarbon-in-fluorocarbon-in-water (H/F/W), Janus and fluorocarbon-in-hydrocarbon-in-water (F/H/W) induced by varying of the interfacial tensions could serve as a transduction mechanism for sensing of the chemical and biological analytes.
-This type of complex emulsion is composed of a hydrocarbon phase and a fluorocarbon phase surrounded by a continuous water phase with surfactants. Based on the fact that the selected fluorocarbons (FCs) and hydrocarbons (HCs) are immiscible at room temperature but miscible with gentle heating (low upper critical temperature, Tc), we first disperse a single phase of a FC and HC mixture at elevated temperature and then cool them down to generate double emulsions (Fig. 1.1a). The polydisperse droplets can be easily manufactured in bulk via simple emulsification process with the exact same composition. The complex emulsion droplets thus provide the bases of a type of low cost sensor material.
Heatt Emulsify
Fluorocarbon-t
b Fluorosurfactant diffusion
F/H/W Janus Droplet H/F/W
Figure 1.1 a) Complex emulsion fabrication. b) Complex emulsion morphology change with FC surfactant diffusing from left to right. Reprinted from Ref. 20 with permission. Copyright 2015, Nature Publishing Group.
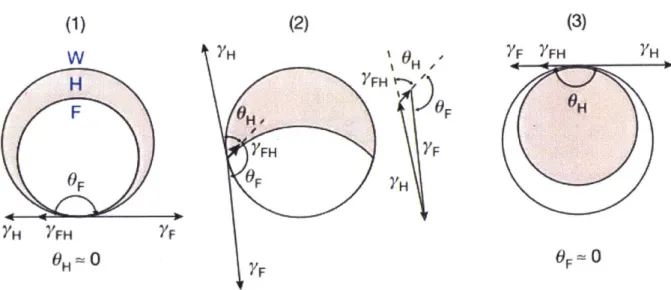
In this double emulsion system, the morphology is controlled by three interfacial tensions, H-W interface, XH, the F-W interface, XF, and the F-H interface, 2
%FH. The solvent combinations are
carefully chosen such that %H and XF are significantly larger than XFH, so that the droplet
morphology is determined by the relative strength of XH and XF. (Figure 1.2) In order to create
-20-stable emulsions, surfactants are needed to lower the surface tension between two liquids. We use both HC surfactants (e.g., sodium dodecyl sulfate, SDS, hydrophilic head group and alkyl tail group) and FC surfactants (e.g. Zonyl-FS 300, hydrophilic head group and fluorous tail group) to tune the two interfacial tensions, HC/water and FC/water. With SDS dominant, for example, the double emulsion starts in FC-in-HC-in-water (F/H/W). Then by adding Zonyl, the morphology goes through a Janus state and ends with a HC-in-FC-in-water (H/F/W) double emulsion (Fig
1.1b). (2) 'YFH yFH YF OF YH FF (1)
W
H F OF YH FH F OH-0 (3) 7F YFH HFigure 1.2. Complex emulsion morphology controlled by three interfacial tensionskH, XF and
XFH. (1) F/H/W. (2) Janus. (3) H/F/W. Copyright 2015, Nature Publishing Group.
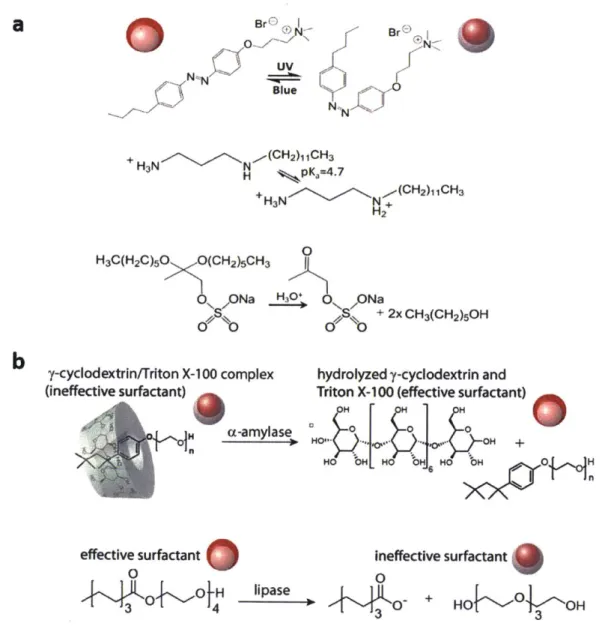
-21-The morphology changes are reversible, and we have shown that by using stimuli-responsive surfactants, the morphology change could be triggered by pH, light (Figure 1.3a),20 or
enzyme activity (Figure 1.3b).2
1 By designing novel surfactants that respond to external stimuli, we herein propose that this dynamic complex emulsion system could be a powerful liquid-phase sensing platform for complex chemical and biological analytes such as proteins, oligonucleotides, and bacteria. BrBr
a
Br® BrE) Blue + H-1N".- N ,,(CH2)11CH3 H 'r pK,=4.7 +H3N (CH2)1,CH3 0 H3C(H2C)50 O(CHZ)SCH3 N H 0 ONa N H+ 2x CH3(CH2)SOH bd
oy-cyclodextrin/Triton X-100 complex hydrolyzed y-cyclodextrin and (ineffective surfactant) Triton X-100 (effective surfactant)
H .c-amylase 0 0 o
HO' --, ,.- ..
HO bL HO bHJ HO
effective surfactant Ineffective surfactant
0 0
O 1-H lipase LiiO
Figure 1.3. Droplet morphology change by using stimuli-responsive surfactants. a) Morphology
change from F/H/W to H/F/W with light and pH. b) Morphology change with enzyme activity. Reprinted from Ref. 21. Copyright 2017, National Academy of Sciences.
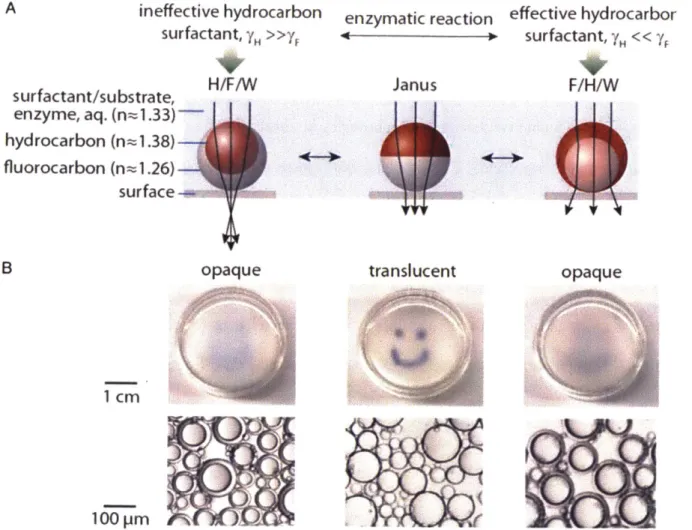
-22-Another advantage of the complex smart colloids are their intrinsic optical properties. The droplets themselves are micro-lenses. 21,22 The dynamically tunable droplets acting as micro-lenses
can focus, scatter, or redirect light. Figure 1.4a shows a ray diagram of a droplet under different morphologies. Double emulsions at morphologies of either H/F/W or F/H/W would converge or diverge the light, respectively. The droplets are transparent at the Janus state. If a graphic picture is placed under a well of droplets, the picture will be blocked if the droplets are not at the Janus state (Figure 1.4b). The bi-phasic emulsion droplets can be fabricated with liquid of varying refractive indexes to display variable and controllable focal lengths. Both experimental demonstrations and wave-optical modelling have been shown to provide the fundamentals of these materials being used as display technologies and micro-scale imaging devices.22
-A
surfactant/subs enzyme, aq.
(n-ineffective hydrocarbon enzymatic reaction effective hydrocarbor
surfactant, yH >f, - surfactant, y F H/F/W Janus F/H/W
trate,
1.33)-I
hydrocarbon (n=1.38) fluorocarbon (n= 1.26)-surface -e4
opaque translucent m m 100 m opaqueC!
/00
I(IFigure 1.4. Reconfigurable droplets act as tunable lenses and the optical transmission of an emulsion film depends on the droplet morphology. a) Schematic ray diagrams of the complex droplets composed of hydrocarbon and fluorocarbon within a continuous phase of aqueous solution. b) Aligned beneath the droplet schematics are corresponding photographs of polydisperse emulsions in a Petri dish placed over an image of a smiley face to demonstrate changes in the optical transmission. Reprinted from Ref. 21. Copyright 2017, National Academy of Sciences.
1.4 Challenges and Objectives
Previous work on the complex emulsion droplets only demonstrate a proof-of-concept system for aqueous sensing using model compounds. In order for the emulsion droplets to be used as sensors in a commercial device, several problems have to be addressed. The responsive
surfactants are used in the continuous phase and will be expensive to apply in large scale real applications. A more generic surfactant platform has to be designed to bind wider types of analytes without complicated synthetic effort. A more elaborate optical mechanism need to be coupled with the molecular recognition for sensing readout. Solving these problems will transform the dynamic complex emulsions into smart colloidal assays for real applications.
This thesis focuses on exploring and expanding the emulsion droplets as assays for applications in biosensing. Both chemical/biological functionalization and transduction mechanism into digitalized signals were studied. In Chapter 2, we demonstrate an example of using emulsion agglutination assays for E.coli sensing with a continuous phase carbohydrate surfactant. In Chapter 3, we expand the emulsion assay using interfacial bioconjugation methods and eliminate the needs of a synthetic surfactant in the continuous phase. In Chapter 4, we develop the protein-protein agglutination assay with a thermal stable protein conjugate to the droplet-water interface for sensing of Zika protein NS 1.
-1.5 References
(1) Swager, T. M. Sensor Technologies Empowered by Materials and Molecular Innovations.
Angew. Chem. Int. Ed. 2018, 4248-4257.
(2) Kauffman, D. R.; Star, A. Carbon Nanotube Gas and Vapor Sensors. Angew. Chem. Int. Ed. 2008, 47 (35), 6550-6570.
(3) Carregal-Romero, S.; Caballero-Diaz, E.; Beqa, L.; Abdelmonem, A. M.; Ochs, M.; Huhn, D.; Suau, B. S.; Valcarcel, M.; Parak, W. J. Multiplexed Sensing and Imaging with Colloidal
Nano- and Microparticles. Annu. Rev. Anal. Chem. 2013, 6 (1), 53-8 1.
(4) Jans, H.; Huo,
Q.
Gold Nanoparticle-Enabled Biological and Chemical Detection and Analysis. Chem. Soc. Rev. 2012, 41 (7), 2849-2866.(5) Horgan, A. M.; Moore, J. D.; Noble, J. E.; Worsley, G. J. Polymer- and Colloid-Mediated Bioassays, Sensors and Diagnostics. Trends Biotechnol. 2010, 28 (9), 485-494.
(6) Elghanian, R.; Storhoff, J. J.; Mucic, R. C.; Letsinger, R. L.; Mirkin, C. A. Selective Colorimetric Detection of Polynucleotides Based on the Distance-Dependent Optical Properties of Gold Nanoparticles. Science 1997, 277 (5329), 1078-108 1.
(7) Chan, W. C.; Nie, S. Quantum Dot Bioconjugates for Ultrasensitive Nonisotopic Detection.
Science 1998, 281 (5385), 2016-2018.
(8) Phillips, R. L.; Miranda, 0. R.; You, C.-C.; Rotello, V. M.; Bunz, U. H. F. Rapid and Efficient Identification of Bacteria Using Gold-Nanoparticle-Poly(para-Phenyleneethynylene) Constructs. Angew. Chem. Int. Ed. 2008, 47 (14), 2590-2594.
(9) Driskell, J. D.; Jones, C. A.; Tompkins, S. M.; Tripp, R. A. One-Step Assay for Detecting
-Influenza Virus Using Dynamic Light Scattering and Gold Nanoparticles. Analyst 2011,
136 (15), 3083.
(10) Tokumitsu, H.; Ichikawa, H.; Fukumori, Y. Chitosan-Gadopentetic Acid Complex Nanoparticles for Gadolinium Neutron-Capture Therapy of Cancer: Preparation by Novel Emulsion-Droplet Coalescence Technique and Characterization. Pharmaceutical research.
1999, pp 1830-1835.
(11) Williams, R.; Peisajovich, S. G.; Miller, 0. J.; Magdassi, S.; Tawfik, D. S.; Griffiths, A. D. Amplification of Complex Gene Libraries by Emulsion PCR. Nat. Methods 2006, 3 (7),
545-550.
(12) Patravale, V. B.; Mandawgade, S. D. Novel Cosmetic Delivery Systems: An Application Update. Int. J. Cosmet. Sci. 2008,30 (1), 19-33.
(13) Chen, L.; Li, Y.; Fan, J.; Bisoyi, H. K.; Weitz, D. A.; Li,
Q.
Photoresponsive Monodisperse Cholesteric Liquid Crystalline Microshells for Tunable Omnidirectional Lasing Enabled by a Visible Light-Driven Chiral Molecular Switch. Adv. Opt. Mater. 2014, 2 (9), 845-848.(14) Chakravarti, A. K.; Chowdhury, S. B.; Chakrabarty, S.; Chakrabarty, T.; Mukherjee, D. C. Liquid Membrane Multiple Emulsion Process of chromium (VI) Separation from Waste Waters. Colloids Surfaces A Physicochem. Eng. Asp. 1995, 103 (1-2), 59-7 1.
(15) Utada, a S.; Lorenceau, E.; Link, D. R.; Kaplan, P. D.; Stone, H. a; Weitz, D. a. Monodisperse Double Emulsions Generated from a Microcapillary Device. Science 2005,
308 (5721), 537-541.
(16) Vladisavljevid, G. T.; Williams, R. A. Recent Developments in Manufacturing Emulsions
-and Particulate Products Using Membranes. Adv. Colloid Interface Sci. 2005, 113 (1), 1-20.
(17) Buyukozturk, F.; Benneyan, J. C.; Carrier, R. L. Impact of Emulsion-Based Drug Delivery Systems on Intestinal Permeability and Drug Release Kinetics. J. Control. Release 2010,
142 (1), 22-30.
(18) Brake, J. M.; Daschner, M. K.; Luk, Y.-Y.; Abbott, N. L. Biomolecular Interactions at Phospholipid-Decorated Surfaces of Liquid Crystals. Science. 2003, 302 (5653), 2094-2097.
(19) Sivakumar, S.; Wark, K. L.; Gupta, J. K.; Abbott, N. L.; Caruso, F. Liquid Crystal Emulsions as the Basis of Biological Sensors for the Optical Detection of Bacteria and Viruses. Adv. Funct. Mater. 2009, 19 (14), 2260-2265.
(20) Zarzar, L. D.; Sresht, V.; Sletten, E. M.; Kalow, J. a.; Blankschtein, D.; Swager, T. M. Dynamically Reconfigurable Complex Emulsions via Tunable Interfacial Tensions. Nature 2015, 518 (7540), 520-524.
(21) Zarzar, L. D.; Kalow, J. A.; He, X.; Walish, J. J.; Swager, T. M. Optical Visualization and Quantification of Enzyme Activity Using Dynamic Droplet Lenses. Proc. Natl. Acad. Sci. U. S. A. 2017, 114 (15), 3821-3825.
(22) Nagelberg, S.; Zarzar, L. D.; Nicolas, N.; Subramanian, K.; Kalow, J. A.; Sresht, V.; Blankschtein, D.; Barbastathis, G.; Kreysing, M.; Swager, T. M.; Kolle, M. Reconfigurable and Responsive Droplet-Based Compound Micro-Lenses. Nat. Commun. 2017, 8, 14673.
-28-CHAPTER 2 Janus Emulsions for the Detection of Bacteria
Abstract:
Janus emulsion assays that rely on carbohydrate-lectin binding for the detection of
Escherichia Coli bacteria are de-scribed. Surfactants containing mannose are self-assembled
at the surface of Janus droplets to produce particles with lectin binding sites. Janus droplets orient in a vertical direction as a result of the difference in densities between the hydrocarbon and fluorocarbon solvents. Binding of lectin to mannose(s) causes agglutination and a tilted geometry. The distinct optical difference between naturally aligned and agglutinated Janus droplets produces signals that can be detected quantitatively. The Janus emulsion assay sensitively and selectively binds to E.coli at 104 cfu/mL and can be easily prepared with long-time stability. It provides the basis for the development of inexpensive portable devices for fast, on-site pathogen detection.
Adapted and reprinted in part with permission from: Zhang, Q.; Savagatrup, S.; Kaplonek, P.; Seeberger, P. H.; Swager, T. M. ACS Cent. Sci., 2017, 3(4), pp 309-313. DOI: 10.102 l/acscentsci.7b00021
Photograph Credit to Dr. Suchol Savagatrup. Three movies can be found in the supporting information from the original online publication.
-2.1 Introduction
Foodbome pathogens are a growing global public health concern. An estimated 73,000 illnesses and 60 deaths occur annually in the United States alone as a result of consuming pathogen contaminated food and water.1 Escherichia Coli, for example, can be easily spread in contaminated
food and water to cause serious illness and even death. In a serious 1996 E.coli outbreak in Japan, more than 6,000 primary schoolchildren became sick and at least 12 died;2 while in Canada, seven of the thousands of people that fell ill died in 2000.3 Such tragedies could have been avoided if inexpensive and fast devices to test large amounts of food and water for pathogenic bacteria prior to consumption were available. The conventional method for bacterial detection requires cell culturing and a multiday enrichment step.4 Modern methods based on surface plasmon resonance (SPR),5 the polymerase chain reaction (PCR),67 , and immunoassays8 are much more rapid but require expensive equipment that has to be operated by trained technicians. These drawbacks of the current methods surrender the possibility of food testing before consumption. As a result, an on-site detection method that is rapid, inexpensive, and user-friendly is urgently needed.
We report an emulsion based agglutination assay for the selective and sensitive detection of bacteria. Fluid Janus droplets are powerful liquid phase sensing particles when the different hemispheres are functionalized to have orthogonal physical and biochemical properties. Janus particles with covalently modified surfaces have been used for sensing applications.9'10 We produce liquid Janus emulsions with intrinsic functionalization by using surfactant-based recognition groups. Liquid Janus emulsions provide dynamic and compliant surfaces that mimic properties of live cells. We have targeted carbohydrate-lectin interactions that are critical to cellular recognition,1' and utilize many weak interactions in a multivalent binding process.'2 Although a commercial agglutination assay (latex fixation assay) has been used for identifying
-bacteria, it involves the functionalization of latex beads with expensive antigen or antibody and counting agglutination sites under a microscope.'3 Our emulsion assay uses the carbohydrate
surfactant molecule, which self-assembles at the droplets surfaces during the emulsification process so that no further functionalization is required for bacteria recognition. Additionally, the intrinsic optical lensing behavior of the Janus droplets also enables both qualitative and quantitative detection of protein and E. coli bacteria. Surfactants lower the interfacial tension
between two immiscible liquids and stabilize emulsion droplets. Recently, we demonstrated that stimuli-responsive surfactants can produce dynamic complex emulsions that undergo morphological switching.14 This mechanism depends on changes in concentration or effectiveness
of the surfactants and hence requires many chemical reactions to change a single droplet. In this study, we report a more sensitive transduction mechanism that does not require changes in the interfacial tensions, but rather uses the changes in the alignment of the Janus droplets for the detection of analytes. Janus morphology was maintained during the binding process and the analyte is directly visualized by the tilted Janus droplets.
2.2 Results and Discussion
Initially, we investigated the interactions between the Janus droplets and a mannose-binding lectin, Concanavalin A (ConA), which serves as a functional substitute for E. coli
bacteria.'5 A simple mannose carrying an anomeric C-14 alkyl chain (ManC14) was designed as
the surfactant and was synthesized via a modified literature method.16 Janus emulsions, composed of equal volumes of hexane and FC-770 (a commercially available perfluoronated solvent from 3M) in aqueous continuous phase were fabricated. Both monodispersed and polydispersed droplets were used in this study. The detailed fabrication procedure and the dynamic nature of these droplets are explained in section 2.4. ManC14 and Zonyl FS300, a commercially available fluorocarbon
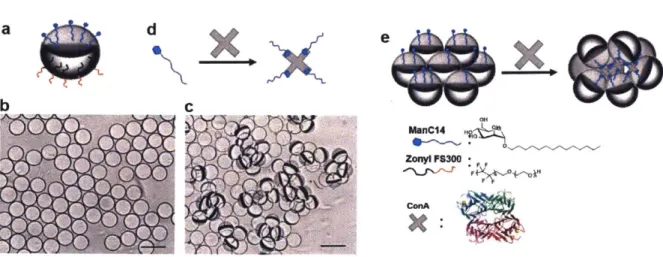
-surfactant, were then used to stabilize the emulsion assay in the Janus morphology. The Janus emulsion assay can be prepared in large scale while maintaining the stability and sensing behavior over several month. The force of gravity aligned the denser FC-770 phase downward, leading to the spontaneous alignment of the Janus emulsions in an upright direction with the hydrocarbon phase and ManC14 on top (Figure 2.1a). Aligned Janus emulsions appeared as transparent simple droplets under the microscope and the internal structure was not apparent (Figure 2.1b). However, upon the addition of a buffered solution of ConA and gentle agitation, bound Janus droplets realigned in a unique tilted configuration with the hexane faces joined together in an agglutinated configuration (Figure 2.1c) within seconds. The hydrocarbon surfactant ManC14 self-assembled at the hexane/water interface to lower the interfacial tension and created an affinity for ConA on the hydrocarbon hemisphere. ConA has four mannose binding subunits (Figure 2.1d) and crosslinks the droplets via the hydrocarbon phase to generate the tilted (agglutinated) clusters (Figure 2.le). d e*, CH4 MmnC14 ZOWy P8300 ConkA .9
Figure 2.1. a) Side view of a Janus droplet stabilized by ManC14 and Zonyl FS 300. Optical micrographs of b) transparent pristine monodispersed Janus emulsions and c) agglutinated Janus emulsions scatter light after exposure to ConA. Scale bar 100pm. Schematic representation of Janus emulsion agglutination. d) Multivalent binding of ConA to ManC14. e) Agglutinated Janus emulsions with ConA and ManC14.
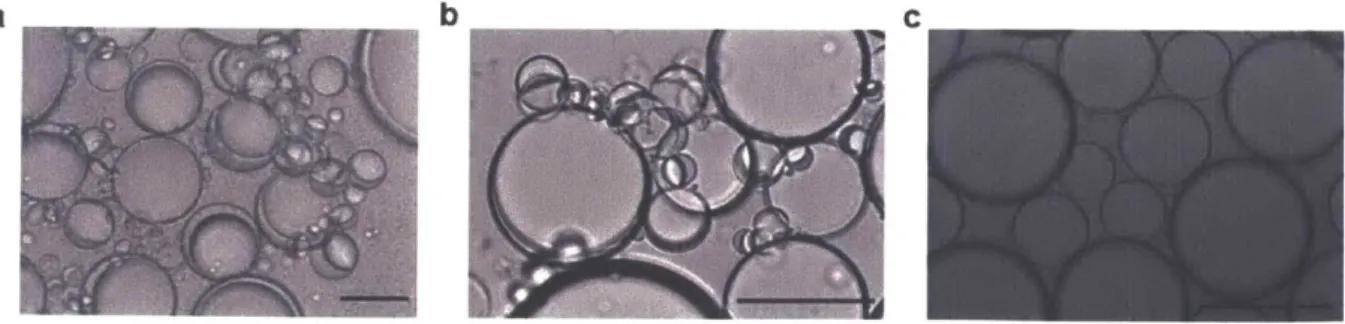
-32-Janus emulsions can become H/F/W double emulsion when additional fluorocarbon surfactant is added. To confirm that the hexane phases of Janus droplets were connected via ConA, excess fluorocarbon surfactant Zonyl was added to the agglutinated emulsion assay to induce a morphology change from Janus to double emulsions. Under these conditions, non-agglutinated Janus emulsions transform symmetrically into double emulsions H/F/W (Figure 2.2a, c). However, with ConA-agglutinated Janus emulsions, the droplets maintained an asymmetric structure wherein the pre-organized ConA: ManC14 groups behaved as a persistent connective anchor to the hydrocarbon phase (Figure 2.2 b, d and see also a video in the Supporting Information from the original publication). Bovine serum albumin (BSA) was used as a non-mannose binding protein for the control experiments. No agglutination or significant perturbation of the optical properties was observed with even high concentration of BSA (up to 1 mg/mL, see the
experimental details in section 2.4).
a
b
Zonyl ConA Agglutinate Zonyl C dLFigure 2.2. Scheme and optical images showing directional morphology change with addition of excess Zonyl surfactant. The hexane phase has been dyed in pink for display purposes. a), c) Janus emulsion change into H/F/W double emulsion. b), d) Agglutinated Janus emulsion with addition of ConA. Scale bar equals 50 pm.
-Janus emulsions with the chosen fluids have compensating refractive indices which enable detection by optical transmission. Vertically aligned droplets on a horizontal surface are transparent, whereas the agglutinated droplets are highly scattering. This significant change can be easily observed by visual detection with-out any instrumentation or energy. Beyond a qualitative scattering/non-scattering assay, quantitative detection schemes are possible when image processing algorithms are employed to analyze the optical micrographs.
In an effort to create a qualitative binary assay for analytes, Janus emulsions were placed in a transparent analysis chamber that was positioned over a quick response (QR) code printed on paper (Figure 2.3a). Upon the addition of ConA, the Janus droplets agglutinated and the chamber became opaque, rendering the QR code unreadable by a smartphone (Figure 2.3b). This change occurred within less than five seconds after the addition of ConA and gentle agitation, which enables the Janus emulsion assay for a detection with instant readout. The Janus droplets behave as lens and the optical scattering is strongest at distances > 5 mm. At shorter distances, the QR code can still be scanned and the distance (D) at which the code was readable varies with ConA concentration (Figure 2.3c). The greater the D, the lower the concentration of ConA required to disable the QR code. As a result, binary distance dependent measurements can provide some level of quantitation.
-a
C
- Sample chamber
Smartphone with OR Monolayer of droplet (lens)
code scanning D: Focusing distance
software R code (object)
Janus emulsions In transparent chamber OR Code .- 4- 3.5-b3 b Focal 2 ConA D/m1.5. 0.5-0
-Readable Unreadable 0 0.os 0.1 0.15 0.2 0.25 0.3 0.35
Concentration of ConA mg mL-1
Figure 2.3. a) Schematic view of qualitative detection of the agglutinated Janus emulsions. The Janus emulsions are placed on a transparent analysis chamber. The QR code enables the binary qualitative detection of agglutination. b) Optical signal detected using a QR code before and after exposure to ConA. c) The focusing distance D, with droplet monolayer as a lens and QR code as the object. d) Correlation of the threshold ConA concentration for the binary signal with D.
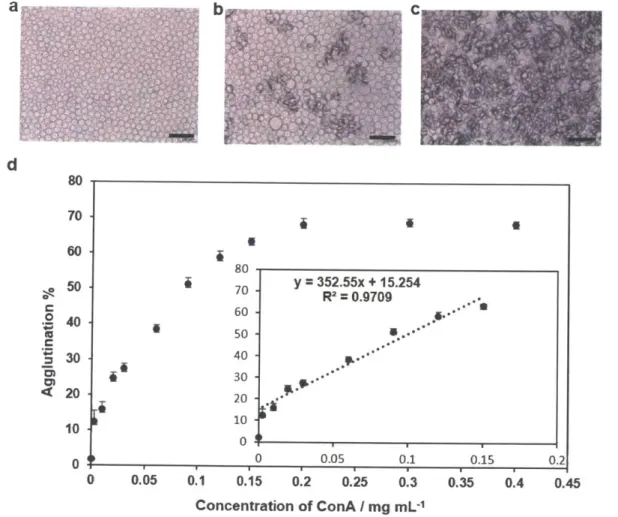
To precisely quantify the degree of agglutination, we implemented an image processing program to calculate the percentage of area covered by agglutinated Janus emulsions by evaluating the differences in optical intensity of the images before and after exposure to ConA. The program uses the adaptive thresholding algorithm to distinguish areas with higher transparency (pristine Janus emulsions) from the opaque regions (agglutinated Janus emulsions) (see experimental details in section 2.4). Optical micrographs of Janus emulsions, Figure 2.4a-c, show that the opaque regions increase with higher concentration of ConA. The agglutination level was defined by the percentage of areas covered by agglutinated (scattering) Janus droplets (Figure 2.4d). Each point represents an average of multiple pictures (N 3 5) obtained at the given concentration of ConA.
-The background without addition of ConA (Figure 2.4a) was analyzed with the software and showed nearly zero agglutination level output. We observed a linear correlation between agglutination level and the concentration of ConA up to 150 pg mL-1 (Figure 2.4d). At higher concentrations of ConA, agglutinated droplets saturated the imaging area, and thus a plateau in the agglutination percentage was observed.
b C
4I
d C 0) 4 80 70 60 50 40 30 20 10 0 i a 80 70 60 50 40 30 20 10 0 II 0 0 A 2 a 0.05 0.1 0.05 0.1 0.15 0.2 0.25 0.3 Concentration of ConA / mg mL-1 0.15 0.35 0.2 0.4 0.45Figure 2.4. Correlation of ConA concentration and agglutination level. a) Janus emulsion without ConA. b) With 0.03 mg mL-1 ConA. c) With 0.12 mg mL-1 ConA. d) Correlation between
concentration of ConA and agglutination level. Scale bar equals 250 pm.
-36-y = 352.55x + 15.254 R2 = 0.9709 OI...L - .... - ...
Having established a detection scheme with the help of ConA, bacterial detection of E.coli ORN 178 strains was explored. These bacteria express the mannose-specific lectin, FimH, for the recognition and binding to host cells. Agglutination of droplets was observed 48 hours after incubation with live E.coli. Unexpectedly, a change in morphology from Janus to H/F/W double emulsions was observed in addition to agglutination (Figure 2.5a). Symmetric Janus droplets are produced when the ManC14 and Zonyl concentrations are adjusted such that hexane/water and FC-770/water interfacial tensions are equal. When live E. coli binds to ManC 14, the cell appears to either reduce the effectiveness of ManC 14 as surfactant at the interface or, perhaps more likely, removes some ManC 14 from the droplets. The active ManC 14 that was present on the surface of drop-lets may have been significantly decreased due to the high concentration of bacteria (> 109 cfu/mL) after 48 h of proliferation. In this case, the Zonyl stabilized FC-770/water interface had a lower interfacial tension resulting in the equilibrium morphology of the double emulsion (H/F/W). This morphological change was not observed upon the addition of ConA since the lectin itself is small and inanimate, and neither decreases the effectiveness of ManC 14 nor removes it from the droplet. We speculate that the slower rate of agglutination for the emulsions with live bacteria as compared to ConA resulted from the dynamic nature of the pili that contain the FimH recognition elements. 17
To accelerate agglutination, bacteria were fixed via 4% paraformaldehyde.'" While maintaining the FimH binding activity, the fixed pili are static,19 similar to ConA, and are more efficient in agglutinating droplets. Janus emulsion agglutination was observed after two hours with paraformaldehyde treated ORN178 strains. To determine the limit of detection, treated bacteria were diluted to various concentrations and agglutination was detected using a smartphone and QR code recognition for ORN 178 strains at 104 cfu/mL (see the Supporting Information from the
-original publication for a movie on smartphone-based E.coli detection). It is important to note that this method is comparable in sensitivity to the existing methods for pathogen detection. The conventional plating technique can detect single bacteria but the culturing process takes several days. Other immunological and bioluminescence method as well as the nucleic acid based assays have a detection limit of 103-104 cfu/mL, but re-quire special laboratory equipment and trained
technicians.20
As a control, ORN 208 strains, carrying a mutation in the FimH gene, that compromises the pili's ability to bind mannose, were subjected to the same tests and no agglutination was observed at the concentrations that suffice to detect ORN 178 (Figure 2.5b, Figure 2.5c ). Similar to the agglutination assay with ConA, agglutination was observed and the Janus morphology was maintained. A transformation to a double emulsion at these lower concentrations of fixed bacteria was not observed. We expect that this system can be further improved by employing more elaborate carbohydrate surfactants. In a real-world application, customized protocols will be necessary for sample preparation and there may be interfering effects. To address the latter we have conducted investigations with non-mannose binding protein and find that the binding is not affected by the generic protein (Figure 2.9).
ab C
Figure 2.5. Micrographs showing emulsion agglutination with E.coli bacteria. a) Janus emulsions change into H/F/W double emulsion after 48 incubation with live ORN 178 E.coli. Agglutination is also observed. b) Janus emulsions agglutination, 2 h after 4% paraformaldehyde treated ORN
-38-178 E.coli bacteria (104 cfu/mL) were added. c) No agglutination was observed with ORN 208 strains under the same testing conditions. Scale bar equals 100 prm.
2.3 Conclusions
In summary, we have developed a Janus emulsion agglutination assay based on carbohydrate-lectin binding. The mannose surfactant functionalized emulsion assay described in this work was designed specifically for E. coli as a model system. The assays can be expanded to
arrays with multiple carbohydrate surfactants to differentiate various types of bacterial strains. The self-assembly of glycosylated surfactant molecules on surface of droplets provided multivalent binding sites to target analytes. We demonstrated that this agglutination detection method can be analyzed qualitatively with a QR code for a binary readout and quantitatively with designed image processing software. Both methods give results within a minute. The Janus emulsion assay allows for the detection of E.coli bacteria at concentration of 10' cfu/mL. Therefore, this method is comparable in sensitivity to the existing methods for pathogen detection. The Janus emulsion agglutination assay is a fast, inexpensive, and sensitive method that can be implemented with commercial smartphones for on-site detection of biomolecules and pathogens.
2.4 Experimental Details
General Methods and Instrumentation
Hexane, FC-770, D-(+)-Mannose, 1 -tetradecanol, Concanavalin A, Bovine serum albumin and Zonyl FS-300 were purchased from Sigma-Aldrich. HEPES buffer (1 M) was purchased from ThermoFisher. Solvents were purchased from Sigma-Aldrich and used as received. NMR spectra were recorded using a Bruker Avance 400 MHz NMR spectrometer and were referenced to the proton resonances resulting from incomplete deuteration of NMR solvent ('H). High resolution mass spectrum was determined with a Waters Q-TOF Micro Mass Spectrometer using electrospray
-ionization (ESI) ion source. Bright-field images were taken with a Zeiss Axiovert 200 inverted microscope equipped with a Zeiss AxioCam Hrc camera.
Synthetic Procedures
ManC14 was synthesized according to a modification of a published method.21 D-(+)-Mannose (0.75 g, 4.16 mmol) was reacted with 1-tetradecanol (10.71 g, 0.05 mol) in 1,4-dioxane (15 ml) containing 96% H2SO4 (40 pl) for 12 h followed by neutralization and evaporation of
volatile compounds. The crude product was purified by column chromatography on SiO2 (20% EtOH/EtOAc) to obtain the product as a while power. 'H NMR (400 MHz, CDCl3): 6 4.83 (s, IH). 13C NMR (400MHz, CDCl3): 6 99.96, 72.12, 71.55, 71.03, 68.01, 66.13, 31.94, 29.71, 29.62, 29.43,
26.14, 22.70, 14.13. ESI-MS: calculated for C20H4406N ([M+NH4]*): 394.3163, found: 394.3170.
Both 'H NMR and 13C NMR are attached as appendix.
Janus Emulsion Assay Preparation
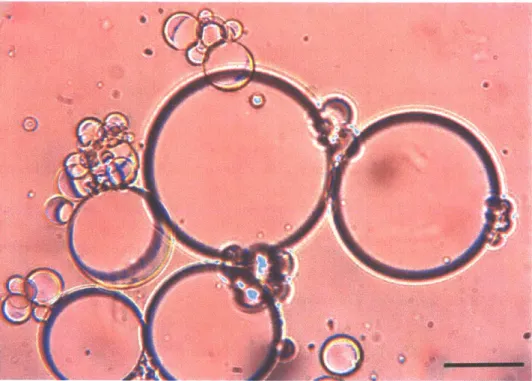
Janus emulsions, composed of equal volumes of hexane and FC-770 in aqueous continuous phase were fabricated using either bulk emulsification or a microfluidics device, which generates polydisperse or monodisperse droplets respectively. Both methods could generate emulsion assays applicable for qualitative and quantitative detections. Monodispersed emulsion assays were fabricated for Figure 1 for proof-of-concept experiments. However, polydisperse emulsion assays were preferentially used for later experiments because the fabrication process is easier and doesn't require specialized equipment, which is essential for our proposed on-site sensor application. In a polydisperse emulsion assay, smaller droplets tends to be tilted and stick on to the surface of bigger droplets (Figure 2.6). Large Janus droplets (more than 200 pm in diameter) will not tilt because the binding strength between carbohydrate surfactant and lectin does not provide enough force to
-tilt the particles against gravity. Thus, we deliberately designed the Janus droplets to be in the range of 50-150 pm in diameter to facilitate the tilting motion upon agglutination. However, droplets in different sizes are all connected together with ConA and can be confirmed with the movie provided as supporting information from the original publication. Thus we observed no differences in agglutination and limits for detection for the droplets within the ranges of diameters reported.
Figure 2.6. Agglutinated Janus droplets in different sizes.
In both fabrication processes, the hydrocarbon phase (hexane) and fluorocarbon phase (FC-770) were mixed and heated above the upper critical temperature to generate a single droplet phase.
This droplet phase was then dispersed into the continuous aqueous phase containing the two surfactants to generate single phase emulsions and upon cooling, the hexane and FC-770 phases
-41-separated to generate Janus emulsions. The composition of all droplets was identical because every droplet originated from the same single phase.
For the continuous water phase, two surfactants, ManC14 and Zonyl FS 300, were used to stabilize and generate the Janus emulsions. The two surfactants were dissolved in HEPES buffer solution (10 mM, containing 1 mM CaCl2 and 1 mM MnCl2, pH = 7.5) separately with
concentration of 0.0005% and 0.01% by weight, respectively. In both bulk emulsification and microfluidics method, the final volume ratio between ManCl4 solution and Zonyl FS 300 solution was kept at 1.2:1 to generate perfectly two-hemisphere Janus emulsions. Janus emulsions were loaded into a stainless steel sample holder with a 1 cm deep well and a 1.5 cm diameter viewing window. We loaded 0.5 mL of mixed surfactant solution containing 30 pL of hexane/FC-770 droplet phase into sample holder to effectively create a monolayer of Janus emulsion that covered the whole viewing window. The sample holder and solution of the Janus emulsions were kept below 20 'C, the Tc of hexane/FC-770 mixture, during the sensing and image acquisition.
Dynamic Nature of the Complex Emulsion Droplets
The Janus droplets described in this work are dynamic. The dynamic morphology change process was detailed in a previous study by our laboratory. 14 Complex emulsion droplets change their morphology from double emulsion H/F/W to Janus to F/H/W with the addition of hydrocarbon surfactant. The morphology reflects the strength and concentrations of the relative hydrocarbon and fluorocarbon surfactants. The surfactant molecule prefers to reside at the interfaces to lower interfacial tensions thus changing the morphology of droplets. In the context of this work, ManC14 is the hydrocarbon surfactant and Zonyl FS 300 is the fluorous surfactant. If the system lacks the mannose surfactant, the droplets are double emulsions with fluorous phase on the outside encapsulating the hydrocarbon phase (H/F/W, as shown in Figure 2.7a). Addition of
-the proper amount of -the mannose surfactant will transform -these droplets from H/F/W to Janus droplets (Figure 2.7b), and excess mannose surfactant can produce F/H/W double emulsions (Figure 2.7c). Janus droplets were intentionally designed as a result of distinct optical behavior. The morphology (double emulsion or Janus) is the direct evidence that the mannose surfactant is active in stabilizing the water/hydrocarbon interface in the Janus particles and is also the anchor for agglutination of droplets binding to the lectin ConA.
Side View
a
H/FIW
Top View ManC14, Zonylb
Janus
ManC14 Zonyl cFIHIW
Figure 2.7. Dynamic complex emulsion droplets. a) H/F/W double emulsion in 0.01% Zonyl FS300 solution. b) Janus emulsion in solution of 0.0005% ManC14:0.01% Zonyl = 6:5 (v:v). c) F/H/W double emulsion in 0.0005% ManC14 solution. Scale bars: 50pm.
Bulk Emulsification for Polydispersed Janus Emulsions
To generate Janus emulsions via bulk emulsions, we began by preparing an equal-mixture of hexane and FC-770 with a total volume of 1 mL in a 5 mL glass vial. The mixture initially formed an immiscible solution at room temperature. The vial containing the mixture was then heated to above the Tc (20 C) using a standard heat gun until the mixture is miscible. In another 5 mL glass vial, 1 mL of the continuous phase containing surfactants was also heated to the same
-temperature as the vial containing hexane/FC-770 mixture. This precaution will mitigate the phase segregation of hexane and FC-770 upon addition before emulsification. 50 pL of heated and miscible hexane/FC-770 mixture was then injected into the heated continuous phase via a pipette. The Janus emulsions were then generated by shaking the vial using a vortex mixer at 3000 RPM for 5 seconds. The solution of emulsions was then cooled down below Tc using an ice bath. This method of bulk emulsification generated polydispersed droplets with diameters ranging from 30 to 200 pm as observed by an optical microscope.
Generation of Monodispersed Janus Emulsions via Microfluidics
Focused Flow Droplet Generator chip (channel width = 100 ptm, channel depth = 20 pm, tip width = 10 ptm, glass) from Micronit was used to generate monodispersed droplets. Harvard Apparatus PHD Ultra syringe pumps were used to inject the outer phase (continuous phase) and inner phase (droplet phase). The flow rates were 50 pL min' for the continuous phase and 30 pL min-l for the droplet phase. The microfluidic setup was heated above the Tc of the inner phase solution using a heat lamp. Janus emulsions were then cooled below Tc to induce phase separation. The average diameter of the monodispersed droplets generated from this setup were 60 10 gm.
ConA Sensing
Monodispersed or polydispersed Janus emulsions used for sensing experiments were fabricated using methods described above. ConA was dissolved in HEPES buffer solution (10 mM, containing 1 mM CaCl2 and 1 mM MnCl2, pH = 7.5) with various concentrations and used as the analyte. 10 piL of ConA solution was added using a micropipette to the sample holder containing Janus emulsions. Solution was then swirled gently and agglutination of Janus emulsions were observed within seconds.
-A control experiments for specificity was performed in the presence of free mannose. ConA was pre-incubated with 1 mM D-(+)-Mannose in HEPES buffer (10 mM, containing 1 mM CaCl2 and 1 mM MnCl2, pH = 7.5) for 30 min before injected into the Janus emulsion assay. The
pre-incubation of ConA with mannose inhibits the binding of ConA to the Mannose functionalized Janus Droplets and agglutination was not observed (Concentration of ConA tested in the range of 0.01-0.2 mg mL-1).
For the morphology conversion experiment in the presence of agglutination, 100 pL of 5
wt% Zonyl FS 300 solution was added to the sample holder after Janus droplets were agglutinated with addition of 10 pL of I mg/mL ConA solution. The movie is recorded in real time to show the forced morphology change by adding excess amount of fluorous surfactant. A control experiment with Triton 100 as the hydrocarbon surfactant was performed for comparison. 0.0 1% Triton X-100 and 0.01% Zonyl in volume ratio of 5:1 was used to make a control sample of Janus emulsion assay. The same amount of ConA was added and no agglutination was observed. 100 pL of 5 wt% Zonyl FS 300 solution was added to the control assay and the morphology change was symmetrical
as shown in the movie.
We performed the qualitative analysis using the QR code from unmagnified images taken from the smartphone. The distance from the phone to the analysis chamber containing the Janus emulsions was approximately 10 cm. The exact distance was calibrated by the image processing software by using the known dimension of the QR code (1 cm x 1 cm). The binary response we measured was whether the QR code could be read via the software. If the QR code is readable, the Janus emulsions are not agglutinated, and vice versa.
For quantitative analysis, images were recorded before and after adding ConA solution using an inverted microscope with 4x magnification. The image processing software then
-processed the captured images by transforming them into greyscale images and adjusting the brightness and contrast to the reference image of blank analysis chamber. Using the pre-processed images of 4x magnification, the program first applied the adaptive thresholding algorithm to
distinguish the darker edges of the Janus emulsions from the droplet complexes with tilted particles. More specifically, the program ignores the edges of the droplets that have inherent low-light intensity and only seeks the area of droplet complexes. We then set a threshold that areas with light intensity of less than 45% of the brightest regions will be considered part of the droplets complex. From this information, the area occupied by the droplet complexes was then calculated (Figure 2.8).
al
C
Figure 2.8. Algorithm for image analysis. The image processing program evaluated the raw image (a) by applying adaptive thresholding algorithm to distinguish area with higher transparency from opaque regions (b). The final locations of the agglutination were highlighted (c). Scale bars: 500
tm.
Generic Protein Perturbation Experiment
ManC14 functionalized Janus emulsion assay with the addition of non-mannose binding protein bovine serum albumin (BSA). 10 pL of BSA solution (in comparable concentration with ConA) was added using a micropipette to the sample holder containing Janus emulsions. The final concentration of BSA is 0.02, 0.12 and 1 mg/mL. No emulsion agglutination was observed even after extended time period. Additionally, the existence of BSA will not affect the binding between
-46-ConA and the Janus emulsions. The agglutination behavior using ManC 14 emulsion assay with
ConA, BSA and ConA with the existence of BSA is shown in Figure 2.9.
so 70 A 60 A s0 A - a ConA 40 A U BSA Non-scannable M BC Scannable 20 10 A
E0..0
0.00 0.01 0.02 0.03 0.06 0.09 0.12 0.15 0.20 0.30 0.40 1.00 Concentration of Protein /mg mL'Figure 2.9. Agglutination behavior of ManCl4 emulsion assay with two proteins ConA and BSA. Agglutination valued with QR code detection method.
E.coli Sensing
Bacterial strain bearing a mannose-binding protein (ORN 178) and a mutant strain lacking the mannose binding domain (ORN 208) were grown in LB media overnight at 37 *C until they reached an approximate OD 600 of 1.0 (108 cells). The culture was then centrifuged and cells washed twice with HEPES buffer. Live E.coli test was conducted by adding a 10 ptL aliquot of these cells to the Janus emulsion assay. The mixture was incubated for 48 h at 37 "C before agglutination was observed under microscope.
-To speed up the agglutination, both ORN 178 and ORN 208 strains were centrifuged and suspended with 4% paraformaldehyde for 1 h. The suspension is then centrifuged to pellet the cells. The supernatant solution containing paraformaldehyde was discarded, and the cells were washed three times with HEPES buffer. The bacteria was then diluted to various concentration for testing. A 10 ptL aliquot of these treated cell suspension was each added to Janus emulsion assay followed by 2 h with robotic shaking under room temperature (25 'C).
Discrimination between the targeted strain, ORN 178, and the control strain, ORN 208, using a smartphone and QR code detection method is shown in a video provided in the Supporting Information from the original publication. Agglutination was also observed under a microscope (Figure 2.5) to confirm that agglutination is responsible rendering QR code unscannable. Janus emulsion assays without ManC14 (Triton X100 was used as hydrocarbon surfactant) will not agglutinate.
In the video of E.coli sensing test, a control experiment was carried out using ManC14 emulsion assay with buffer. Tests with ORN 178 and ORN 208 strains used the exact same ManC 14 emulsion assay.