HAL Id: hal-03244894
https://hal.archives-ouvertes.fr/hal-03244894
Submitted on 1 Jun 2021
HAL is a multi-disciplinary open access
archive for the deposit and dissemination of
sci-entific research documents, whether they are
pub-lished or not. The documents may come from
teaching and research institutions in France or
abroad, or from public or private research centers.
L’archive ouverte pluridisciplinaire HAL, est
destinée au dépôt et à la diffusion de documents
scientifiques de niveau recherche, publiés ou non,
émanant des établissements d’enseignement et de
recherche français ou étrangers, des laboratoires
publics ou privés.
Uranium distribution of a lake sediments in a former
mining area
A. Royer, J.L. Reyss, J. Decossas
To cite this version:
A. Royer, J.L. Reyss, J. Decossas. Uranium distribution of a lake sediments in a former mining
area. Radioprotection, EDP Sciences, 2002, 37 (C1), pp.C1-69-C1-74. �10.1051/radiopro/2002110�.
�hal-03244894�
Radioprotection - Colloques, volume 37, C l (2002)
Cl-69
Uranium distribution of a lake sediments in a former mining area
A. Royer, J.L. Reyss1 and J.L. Decossas
CEMRAD-IRCOM/C2M, 83 rue d'isle, 87000 Limoges, France 1 LSCE, Domaine du CNRS, avenue de la Terrasse, 91198 Gif-sur-Yvette, France
Abstract. During uranium mining activities in Limousin, waters from the mines have been processed and sent back to environment, leading to the deposition of important quantities of radio-elements of uranium series in the sediments of a lake. While the lake was drained, surface and core samples have been collected for analysis using gamma spectrometry. 2 3 8U activities as important as 20 000 Bq/Kg have been measured in surface sediments. The
mapping of 238U in surface sediments and the analysis of 2 3 1U , 2 2 6R a and 2 1 0P b activities in the cores show that the
transfer of radio-elements from waters to sediments is mainly due to solid particles carried by the river into the lake.
1. I N T R O D U C T I O N 1.1 History
Pitchblende veins were discovered in Limousin (Fr) for the first time in 1948. In January 1949, the "division minière de La Crouzille" (mining district) was born and during the same year, uranium ore deposits exploitation started. Mining and processing of the ore have been carried on (figure 1) until 1995. At that time, the last mine of the district was closed. During the 46 years of activity, 12 870 000 tons of ore have been extracted, corresponding to 23 324 tons of uranium. After closing, mines have been secured by partly filling with concrete, and swamped. An underground waters draining had been realised in order to facilitate water circulation and collection as during the mining period. These outcoming waters are processed to conform them to the French water regulations and sent back to the environment.
Tons 800000 "j 700000 600000 • • -500000 § I m 400000 - _. 300000 —m 1
-llllllllllllllll I llllllllll
1949 63 66 69 72 75 78 81 84 87 90 93 to 1960C I - 7 0 RADIOPROTECTION - COLLOQUES
1.2 and Geography
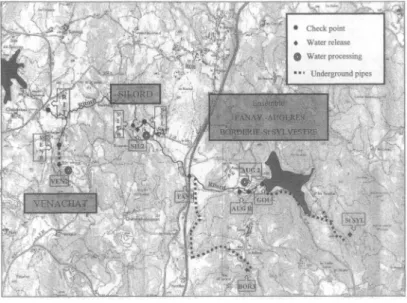
The "division miniere de La Crouzille" is divided into "sieges miniers'' (mining centres). The mining centre which this paper is dealing with is the "siege minier de Fanay-Les Sagnes", the mines of which have been running from 1953 to 1992. It has produced about 4550 tons of uranium, mainly through underground mines. A large part of the mines of this centre fits the basin of river Ritord (figure 2) in which the waters from the mines are sent. Waters are processed in several places along the river between two lakes. The lower one, which receive also waters from river Couze which is quite not concerned by mining activities, has been drained by the end of 1998, as it is every ten years. On that occasion, important concentrations of radio-elements from natural series have been detected in sediments, showing an impact of mining activities. We are now studying the process of the deposition of radioactive material in sediment, process which is still now going on at a reduced rate. The present paper is an assessment of uranium distribution in the sediments, leading to some assumptions on the deposition process. More complete studies are in progress, which will be shortly presented as a conclusion.
Figure 2 : Mine waters processing on Ritord river.
2. EXPERIMENTAL CONDITIONS 2.1 Sampling
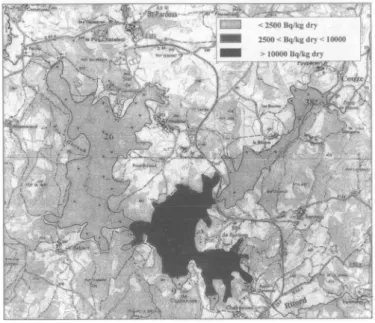
Two types of samples have been collected within the three months following the draining : (i) surface samples (figure 3), collected on the whole surface of the drained lake. Each sample was taken within the first five centimetres of the sediments. The sampling has been tighten up in the area near the mouth of the
Cl-71
river, an elongated cove. 206 surface samples have been collected on the surface of the bottom of the lake (3.3 square kilometres), (ii) Core samples have also been taken. In some places, the sediment layer is thicker than 60 centimetres. It means that the sedimentation rate is rather high since the lake, which is an artificial one, was no more than 20 years old (second draining). The diameter of the cores is 7.5 centimetres. They have been sliced into 3 centimetres samples for analysis. A particular attention has been brought on the Ritord cove were several cores have been collected.Figure 3 : Sediments map
2.2 Gamma spectrometry
Samples have been dried and reduced to a 250 u,m powder for gamma spectrometry measurements. The spectrometer is a low background well type HPGe (300 cc) crystal.
3. R E S U L T S
3.1 Surface activity mapping
As an example, table 1 give the results for several points which are representative of the main various places in the lake : the Ritord cove (1), a place under direct influence of the river (42), a cove far from the influence of the river (9), the lower part of the lake (26), the mouth of the second river (38). The "8U mapping is roughly indicated on figure 3. Depending on the situation of the points described above, the uranium concentration varies from values that can be met in natural sediments of lakes in this region, to rather high values close to some ore deposit concentrations. It can be seen (figure 3) that the concentration of the elements of uranium 238 series decreases when crossing the lake downstream from
C I - 7 2 RADIOPROTECTION - COLLOQUES
the mouth of the Ritord river. On most results, a disequilibrium of the uranium series can be noted, (table 1), and the closer to the Ritord mouth, the higher the disequilibrium. At the mouth of river Couze (38), uranium activity is lower than 1000 Bq/Kg. Series are at equilibrium, calling to mind a detrital contribution. This is in accordance with the lack of mine waters processing units along this river. The sediments in the lower part of the lake have a rather week activity due to their distance from the Ritord river mouth and because they result from both Ritord and Couze rivers influence.
Table 1 : Activities in some places (see figure 3)
21,U !" * P b = ,T h « K I J ,C s P o i n t 1 1 8 * 6 0 0 + / - 3 2 * 1 5 1 0 + - 9 0 3 1 4 4 + / • 2 7 9 2 0 5 + / - 6 1 2 0 4 + / - 1 8 980+/- 1 5 0 8 2 1 + / - 1 3 8 P o i n t 9 4 3 0 9 2 1 0 3 + ' 9 2 7 8 + / - 4 3 8 7 + / - 1 8 8 8 • - 6 4 0 + / - 1 7 7 4 9 + / - 6 1 8 . 1 • - 2 . 6 P o i n t 2 6 1 9 6 5 + / - 1 7 0 5 3 5 + / - 2 4 8 0 6 + / - 5 0 1 1 7 + / - 1 6 1 2 6 + / - 6 9 2 + / - 1 8 7 3 0 + / - 3 8 58 +/- 7 P o i n t 38 6 8 3 + / - 1 2 1 5311 2 7 6 5 8 - • 3 8 2 0 7 + / - 2 3 2 1 1 + / - 8 4 0 f/- 1 2 1 1 3 0 + / - 5 9 1 4 . 2 •!- 1.3 P o i n t 4 2 1 0 4 0 0 + / - 1 8 5 0 8 0 9 + / - 5 5 2 8 9 0 + - 2 5 5 2 3 6 + / - 5 8 2 5 5 + / - 2 0 4 5 3 + / - 1 0 6 6 0 5 + / - 1 1 0 48 +/- 1 1 3.2 C o r e analysis
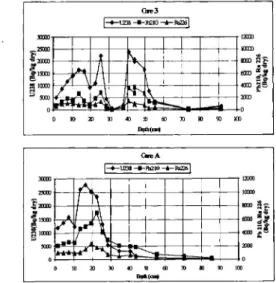
As already mentioned, several cores have been collected. The thickness and activity of the sediments being the highest in the Ritord cove, the information about chronology and isotopic composition is stored there with the best resolution. This is the reason why several cores from this part of the lake have been studied in detail. Two examples of profile are given in figure 4.
Cbre3 0 10 20 30 « 50 60 70 80 90 100 Gire A 1-»-11238 -*-Ri2IO -è-ES226| 30000 25000
f V
12000 10000 .£20000 % 15000 g 10000 sow 0 «Où | £ «00 2000 0»
.£20000 % 15000 g 10000 sow 0tù
«Où | £ «00 2000 0»
.£20000 % 15000 g 10000 sow 0 0 20 » 40 SO 60 7 0 » 9 0 1 «Où | £ «00 2000 0»
ECORAD 2001
The profile of core A is very representative. For all radioactive elements the activity vs depth starts from a rather high value at the surface and has a maximum at about 15 centimetres. The position of the maximum is roughly the same for 2 WU , ™Ra and 2 l 0P b . On the various cores which have been measured, the absolute position of this maximum varies from core to core, depending on the total thickness of the sediment layer. The limit of the sediment and the original soil has been determined using the discontinuity of the sediment density and 4 0K and l 3 7C s activity curves. The profile of core 3 is interrupted in the range 28-40 centimetres. This corresponds to a sand layer, probably due to a fortuitous supply of sand by the river, the core having been collected close to its bed in the lake.
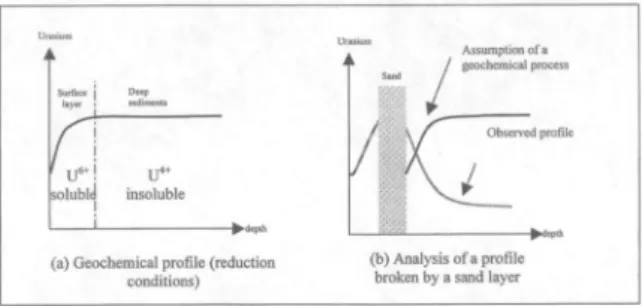
The interpretation of the profiles gives information on the process by which the radioactive elements have been stored in the sediments : (i) as described above, in a given core, the profile is quite the same for the three elements of the curve, whereas the chemical behaviour of these elements is different. The uranium concentration is likely to change with oxidation-reduction conditions, and on the opposite, lead is known to be much less sensitive to chemical conditions [2]. In a chemical transfer from water to sediments, U, Ra and Pb have no reason to follow the same rules in the same chemical conditions. Moreover, the organic carbon profile which has been measured as a function of depth is flat. It can be thought that the decomposition of organic matter does not ensure the reduction conditions favouring uranium deposition. Besides, the position of the maximum of uranium concentration varies from core to core with the thickness of sediments, but is always located at about one third of the surface. The conditions being the same for all the cores, the migration of uranium under reduction conditions would have produced a maximum at a rather constant depth whatever the core. Finally, the analysis of the results of the core 3 (figure 5) reinforces this interpretation. The usual shape of a geochemical profile (a) broken by the sand layer in which the 238U migration would probably had been stopped, would have gone on similarly leading to a profile given on curve (b) opposite to the profile which is observed.
Figure S ; Schema of uranium profiles (see text)
4. C O N C L U S I O N
The analyses of the uranium distribution at the bottom of the lake, as well as in the cores which we have presented are in favour of the interpretation of the deposition of radioactive elements linked to solid particles in waters. It seems that the transfer of uranium to organic or inorganic particles occurs before their sedimentation and that the lake has stored in its sediments the history of the mining activities. For the moment, the phenomenon is still going on in a softened way, due to the waters outgoing from former mines. The conditions are always filled for an analysis of the process. It is in progress. Studies are based on water analyses from their exit from mines to the lake, as well as on suspended matter and sediments.
( a ) G e o c h e m i c a l p r o f i l e ( r e d u c t i o n c o n d i t i o n s )
( b ) A n a l y s i s o f a p r o f i l e b r o k e n b y a s a n d layer
C l - 7 4 RADIOPROTECTION - COLLOQUES
The determination of the part carrying the radio-elements is made using tangential filtration aiming at various size thresholds. The methods and experiments in progress are described elsewhere. Many experiments have already been realised, the results of which will be soon available.
Ac knowledgements
The authors are grateful to the Conseil Général de la Haute Vienne for supporting this work. References
[1] B. Bavoux and P.C. Guiollard, in L'Uranium de la Crouzille* edited P.C. Guiollard (Guiollard P C , Fichous, 1998).
[2] M. Ivanovich and R.S. Harmon, in Uranuim-series Desequilibrium> edited by M. Ivanovich and R.S. Harmon, 2"d edn. (Clarendon Press., OXFORD, 1992).
![Figure 1 : Past mining activities in the mining district of La Crouzille [1].](https://thumb-eu.123doks.com/thumbv2/123doknet/13585783.422571/2.495.69.407.411.638/figure-past-mining-activities-mining-district-la-crouzille.webp)