HAL Id: hal-03008830
https://hal.archives-ouvertes.fr/hal-03008830
Submitted on 17 Nov 2020
HAL is a multi-disciplinary open access
archive for the deposit and dissemination of sci-entific research documents, whether they are pub-lished or not. The documents may come from teaching and research institutions in France or abroad, or from public or private research centers.
L’archive ouverte pluridisciplinaire HAL, est destinée au dépôt et à la diffusion de documents scientifiques de niveau recherche, publiés ou non, émanant des établissements d’enseignement et de recherche français ou étrangers, des laboratoires publics ou privés.
Mantle
Geeth Manthilake, Federica Schiavi, Chengcheng Zhao, Mainak Mookherjee,
Mohamed Ali Bouhifd, Laurent Jouffret
To cite this version:
Geeth Manthilake, Federica Schiavi, Chengcheng Zhao, Mainak Mookherjee, Mohamed Ali Bouhifd, et al.. The Electrical Conductivity of Liebermannite: Implications for Water Transport Into the Earth’s Lower Mantle. Journal of Geophysical Research : Solid Earth, American Geophysical Union, 2020, 125 (8), �10.1029/2020JB020094�. �hal-03008830�
The electrical conductivity of liebermannite: Implications for water transport into the
1Earth’s lower mantle
23 4
Geeth Manthilake1*, Federica Schiavi1, Chengcheng Zhao1, Mainak Mookherjee2, Mohamed Ali
5
Bouhifd1, Laurent Jouffret3
6
7
1 Laboratoire Magmas et Volcans, CNRS, IRD, OPGC, Université Clermont Auvergne,
8
63000 Clermont-Ferrand, France
9
2 Earth Materials Laboratory, Department of Earth, Ocean and Atmospheric Sciences, Florida State
10
University, Tallahassee, FL, 32306, USA
11
3 Laboratoire des Matériaux et du Génie Physique, UMR 5628, 3 parvis Louis Néel - CS50257 -
12
38016 Grenoble, France
13 14
*Corresponding author: Geeth Manthilake (geeth.manthilake@uca.fr)
15 16 17
Key Points: 18
The hopping of K+ ions in liebermannite results in high electrical conductivity of more
19
than 1 S/m.
20
Water can be present as both molecular H2O and hydroxyl (OH-) groups in liebermannite
21
High H2O contents of ocean island basalts can be related to deeply subducted hydrous
22
liebermannite
23 24
Abstract 25
Liebermannite (KAlSi3O8) is a principal mineral phase expected to be thermodynamically
26
stable in deeply subducted continental and oceanic crusts. The crystal structure of liebermannite
27
exhibits tunnels that are formed between the assemblies of double chains of edge-sharing (Si, Al)
28
O6 octahedral units, which act as a repository for large incompatible alkali ions. In this study, we
29
investigate the electrical conductivity of liebermannite at 12, 15, and 24 GPa and temperature of
30
1500 K to track subduction pathways of continental sediments into the Earth’s lower mantle.
31
Further, we looked at whether liebermannite could sequester incompatible H2O at deep mantle
32
conditions. We observe that the superionic conductivity of liebermannite due to the thermally
33
activated hopping of K+ ions results in high electrical conductivity of more than 1 S/m. Infrared
34
spectral features of hydrous liebermannite indicate the presence of both molecular H2O and
35
hydroxyl (OH-) groups in its crystal structure. The observed high electrical conductivity in the
36
mantle transition zone beneath Northeastern China and the lower mantle beneath the Philippine
37
Sea can be attributed to the subduction pathways of continental sediments deep into the Earth’s
38
mantle. While major mineral phases in pyrolitic compositions are almost devoid of H2O under
39
lower mantle conditions, our study demonstrates that liebermannite could be an important host of
40
H2O in these conditions. We propose that the relatively high H2O contents of ocean island basalts
41
derived from deep mantle plumes are primarily related to deeply subducted continental sediments,
42
in which liebermannite is the principal H2O carrier.
43 44 45 46 47 48
Plain Language Summary 50
51
Liebermannite (KAlSi3O8, formally K-hollandite) is an important mineral phase in deeply
52
subducted continental and oceanic crusts. Liebermannite exhibits high ionic conductivity and
53
could explain low resistivity in the Earth’s mantle transition zone and the upper part of the lower
54
mantle, hinting towards the subduction of hydrated crusts into the lower mantle. The libermannite
55
samples synthesized at these conditions indicate the presence of both molecular H2O and hydroxyl
56
(OH-) groups in its crystal structure, suggesting that liebermannite could be an important host of
57
H2O in the Earth’s deep mantle. Compared to the basalts from mid-ocean ridges that exhibit trace
58
quantities of water, ocean island basalts show higher water contents. It has been speculated that
59
ocean basalts are derived from crustal components that were deeply subducted. It is also known
60
that the lower mantle is relatively dry. Therefore, it is difficult to reconcile the higher water
61
contents in OIBs that are derived from the deep mantle. Here, we demonstrate that the source
62
crustal components for OIBs were likely to be hydrated. Libermannite is a key mineral in deeply
63
subducted crusts and can efficiently host water.
64 65 66 67 68 69 70 71 72 73 74 75 76
1. Introduction 77
Trace quantities of H2O stored in the Earth’s mantle significantly influence the physical
78
properties of mantle rocks (Smyth & Jacobsen, 2006). Although H2O plays an important role by
79
affecting both mineral properties and mantle dynamics of the upper mantle, it is well known that
80
the Earth’s lower mantle is relatively dry, as indicated by the low (< 1000 ppm wt.) H2O solubility
81
in major lower mantle mineral phases (Bolfan-Casanova et al., 2003; Fu et al., 2019; Hirschmann,
82
2006). Yet some oceanic island basalts (OIB), which are characterized by relatively high H2O
83
contents up to ~ 2.0 wt. %, are fed by plumes rising from the lower mantle (Deschamps et al.,
84
2011). These plumes are thought to originate from enriched reservoirs composed of recycled
85
crustal materials that subducted into the deep mantle (Willbold & Stracke, 2006). Hydrous phases
86
associated with subducting slabs descending into the lower mantle (van der Hilst et al., 1997) may
87
provide a plausible mechanism for transporting H2O into the deep mantle. Dense hydrous
88
magnesium silicates (DHMS), such as phase H and phase D, which are known to be stable in the
89
depleted portion of the subducting slab at lower mantle conditions, are likely to transport H2O into
90
the lower mantle and subsequently hydrate the subducted crustal components (Nishi et al., 2014;
91
Pamato et al., 2014).
92
While the dominant component of all OIB is likely to be recycled basaltic oceanic crust,
93
both chemical and isotopic signatures of OIB indicate the mixing of different source materials
94
(Hart, 1988). Particularly the Enriched Mantle II (EMII)-type OIB, which have been found in the
95
Society Islands, the Marquesas and Samoa, suggest a 5-10 % of continental and sedimentary
96
components (Hart, 1988). Water contents up to 1.5 wt. % and low H2O/Ce (<150) have been
97
reported in such EMII-type OIB (Cabral et al., 2014). The estimates based on geochemical
98
analyses indicate that H2O concentrations in EMII sources are about 400 ppm wt. (Dixon et al.,
2002). The low H2O/Ce measured in EM-type magmas indicates up to 92 % H2O loss from the
100
recycled continental components with progressive dehydration (Dixon et al., 2002). Despite
101
intense dehydration, the deeply subducted slab appears to retain or rehydrate by the dehydration
102
of dense hydrous phases such that a sufficient amount of H2O is available in the deep OIB sources
103
(Dixon et al., 2002).
104
Liebermannite, formerly known as Liebermannite, is the high-pressure polymorph of
105
KAlSi3O8-feldspar and is likely to be stable in deeply subducted (> 300 km) continental crust and
106
mid-oceanic ridge basalt compositions enriched in potassium (Schmidt, 1996). The crystal
107
structure of liebermannite exhibits tunnels that are formed between the assemblies of double chains
108
of edge-sharing (Si, Al)O6 octahedral units. At pressures ≤ 20-23 GPa, liebermannite (lowP)
109
crystallizes in a tetragonal (I4/m) space group symmetry, whereas above these pressures, the
110
tunnels are slightly squeezed, and the high-pressure polymorph of liebermannite (hiP) crystallizes
111
in a monoclinic (I2/m) space group symmetry (Ferroir et al., 2006; Nishiyama et al., 2005). These
112
tunnels accommodate incompatible cations such as Na, K, Sr, Ba, La, and Pb. A naturally
113
occurring liebermannite containing Ba2+ and K+ is reported to contain up to 5 wt. % H2O in its
114
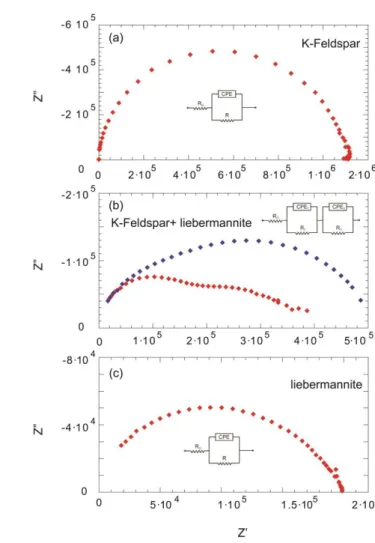
crystal structure (Miura, 1986), indicating that liebermannite could be an important host for H2O.
115
The hiP polymorph is observed to be stable down to the Earth’s lowermost mantle conditions
116
(Kawai & Tsuchiya, 2013; Sueda et al., 2004). At mantle transition zone conditions, phase
117
equilibria studies indicate that average continental crust is composed of a mixture of liebermannite
118
(~32 vol. %), stishovite (24 vol.%), majoritic garnet (30 vol. %) and minor amounts of calcium
119
aluminosilicate (CAS) phases (Irifune et al., 1994).
120
The presence of tunnels in the crystal structure of liebermannite facilitates the motion of
121
K+ ions along the channel, attaining superionic conduction at high temperatures (Furusawa et al.,
1988; Khanna et al., 1981; Yoshikado et al., 1982). More recently, the electrical conductivity of
123
liebermannite, relevant for the deeply subducted crust, has been examined using molecular
124
dynamics simulations. The predicted electrical conductivity for liebermannite with a 12.5 %
125
vacancy in the tunnel is ~20 S/m at 10 GPa and 1600 K (He et al., 2016). The magnitude of the
126
predicted electrical conductivity resulting from ionic conduction of K+ ions in the tunnels is
127
significantly greater than that of the electrical conductivity due to extrinsic defects. Hence, owing
128
to its high electrical conductivity, liebermannite potentially represents an ideal tracer mineral for
129
tracking subducted pathways of continental crustal components into the Earth’s lower mantle.
130
The unique crystal structure of liebermannite and the ability to accommodate large alkali
131
ions and possibly H2O in its tunnels highlight its importance as a possible H2O repository in the
132
subducted crustal components and a possible source for OIB. However, so far, studies on
133
liebermannite have been restricted to the equation of state, elasticity (Caracas & Boffa Ballaran,
134
2010; Kawai & Tsuchiya, 2013; Mookherjee & Steinle-Neumann, 2009), and electrical
135
conductivity (He et al., 2016) of the dry variety.
136
In this study, we first conducted high-pressure and temperature experiments to constrain
137
the electrical conductivity of hydrous liebermannite at the upper mantle, transition zone, and lower
138
mantle conditions, i.e., at pressures of 12, 15, and 24 GPa respectively. Then we examined the
139
water incorporation mechanisms in liebermannite. Finally, we explore whether the high H2O
140
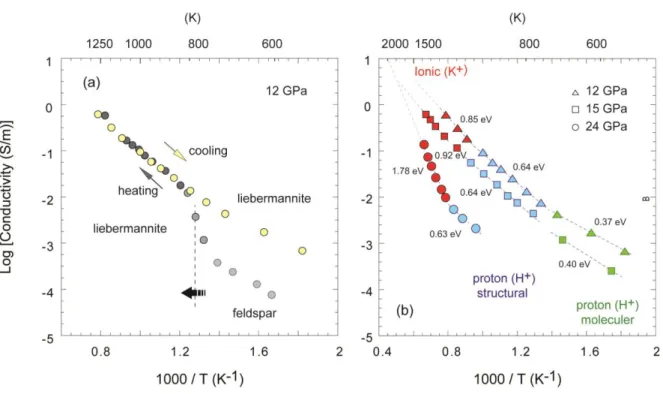
contents of OIB could have derived from hydrated crustal components of deeply subducted slabs
141
penetrated down to the lower mantle.
142 143 144 145
2. Materials and Methods 146
The starting powder was prepared using high purity oxide mixtures of K2CO3, Al2O3, and
147
SiO2. The mixture was slowly heated to 1000 °C overnight in a platinum crucible for decarbonate
148
K2CO3. The decarbonated powdered mixture was then heated to 1500 °C and kept 10 minutes to
149
obtain homogeneous glass. The time was optimized to avoid possible K loss at high temperatures.
150
High pressure-high temperature experiments were conducted using a 1500-ton multi-anvil
151
apparatus. The pre-synthesis of K-feldspar for electrical conductivity measurements were
152
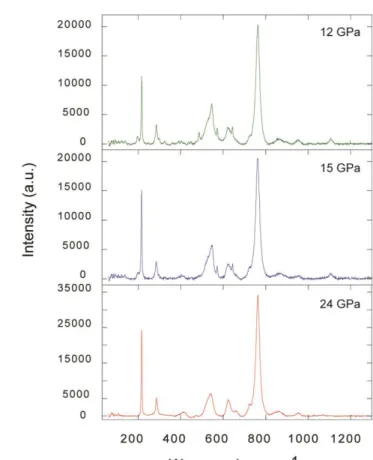
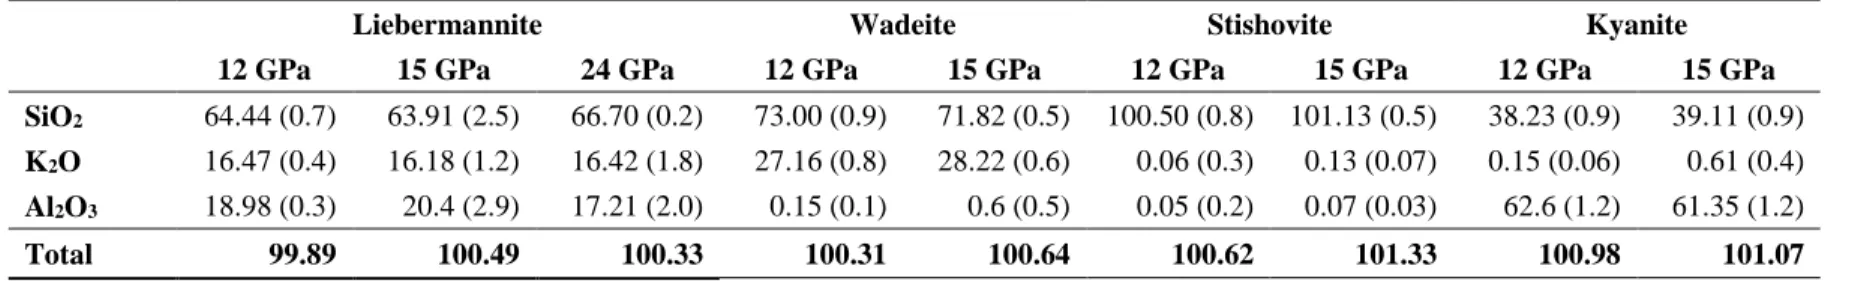
conducted at 2 GPa and 1200 K in a 14/8 assmbly (Fig. 1a). To synthesize hydrous K-feldspar we
153
add Al (OH)3 to the glass mixture to obtain ~ 100 wt. ppm H2O. The powdered mixture was packed
154
into a capsule made of rhenium (Re), and kept ant high-pressure and high-temperaure for durations
155
of 4 hours to obtain the cylindrical samples for electrical conductivity measurements. The water
156
contents of K-feldspar is measured to be 257±29 wt. ppm.
157
The pressure and temperature conditions for the electrical conductivity measurements were
158
carefully chosen based on the stability liebermannite (Nishiyama et al., 2005) and represent the
159
upper mantle (12 GPa), mantle transition zone (15 GPa), and the upper part of the lower mantle
160
(24 GPa). Electrical conductivity measurements were performed using octahedral pressure
161
medium composed of MgO and Cr2O3 (5 wt. %) in a 14/8 assembly (octahedron edge length/anvil
162
truncation edge length) at 12 GPa, in a 14/6 assembly at 15 GPa, and a 10/4 assembly at 24 GPa
163
(Fig.1b). MgO ceramic sleeves insulated the electrode wires from the furnace. All ceramic
164
assembly parts, including the pressure media, were baked at 1000 °C for more than 12 hours and
165
tthen stored at 125 °C in high- vacuum furnaces (< 100 mTorr) before assembling. This step
166
reduces the exposure of assembly components to atmospheric moisture and other impurities.The
167
sample temperature was measured using a type-C tungsten-rhenium (W95Re5-W74Re26)
thermocouple junction, placed at one end of the sample. One cable formed the thermocouple and
169
a separate W95Re5 cable placed at the opposite side of the sample connected to the impedance
170
spectroscopy for the electrical conductivity measurements.
171
The electrical conductivity of liebermannite samples was determined using the impedance
172
spectroscopy method using the Modulab MTS Impedance gain-phase analyzer. The frequency
173
range for the analyses was 106-101 Hz. After compressing the assembly to the desired pressure,
174
samples were heated to 500 K and while maintaining a temperature of 500 K, the electrical
175
resistance of the sample was measured regularly until the sample resistance reached a stable value.
176
The decrease of electrical resistance observed at this step corresponds to the removal of the
177
absorbed moisture in the sample capsule and the surrounding area, which could be incorporated
178
into the sample at higher temperatures (Manthilake et al., 2015). During the measurements, sample
179
resistance was determined in several heating and cooling cycles until the electrical resistance of
180
heating and cooling paths become reproducible. For the discussion, we have used the data from
181
the last cooling cycle, which minimizes the uncertainty in electrical conductivity. The sample
182
resistance can be obtained by fitting the impedance spectra with an appropriate equivalent circuit.
183
For polycrystalline samples, as we use in this study, the equivalent circuit can be illustrated by a
184
combination of resistor-capacitor/constant phase element (R-C/CPE) components, connected in
185
parallel, series, or a series-parallel combination. Once the electrical resistivity of the samples was
186
determined from the fit of the impedance spectra, the electrical conductivity was determined using
187
the radius and the axial length of the cylindrical sample measured after each experiment. The
188
inherent assumption is that the sample geometry remained constant during the experiment.
189
The chemical compositions the experimental run products were investigated using a
190
Cameca SxFiveTactis electron probe microanalyzer (EPMA) in wavelength dispersive (WDS)
mode operating at an accelerating voltage of 15 kV and 4 nA beam current. The low accelerating
192
voltage was used to avoid the K loss in liebermannite.
193
Powder X-ray diffraction (PXRD) analyses of experimental run products were carried out
194
to identify the crystal structures of liebermannite and the phases present in quenched samples at
195
15 and 24 GPa. The PXRD was obtained for ~1 mm3 of crushed samples that were placed on
zero-196
background Si sample holders. The PXRD was recorded using a Philipps X-Pert Pro diffractometer
197
with CuKα radiation source (λ = 0.15405 nm). The PXRD patterns were recorded over the 10–90° 198
(2θ) range in steps of 0.0167° with a counting time of 700 s per step. Lattice parameters were
199
obtained from LeBail fits using the FULLPROF program (Rodriguez-Carvajal, 1993). The
200
background can be obtained by linear interpolation between twenty-six points, and the peak
201
profiles were modeled using a pseudo-Voigt function.
202
Raman spectroscopy was used to identify liebermannite and the minor mineral phases
203
present in the experimental run products. Raman spectra were collected in a back-scattered
204
geometry using an InVia confocal Raman micro-spectrometer, equipped with a 532 nm diode laser,
205
a Peltier-cooled CCD detector, a Rayleigh rejection edge filter (Schiavi et al., 2018). The laser
206
power of 1-8 mW; the slit aperture of 65 μm, and a grating of 2400 l/mm were used for the present
207
analyses. These conditions result in lateral and axial spatial resolutions of ~1 and 3 μm and a
208
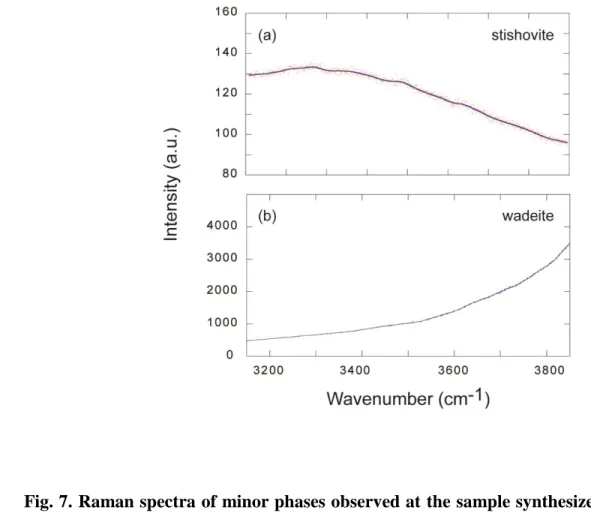
spectral resolution of 1 cm-1. Acquisition times were 30-60 s and 60-240 s for the low-wavenumber
209
and high-wavenumber region, respectively.
210
The quantification of H2O in liebermannite was performed using the Fourier Transform
211
Infrared (FTIR) spectroscopy. Unpolarized FTIR spectra of liebermannite were acquired using a
212
Vertex70 Bruker spectrometer equipped with a Globar light source, a KBr beamsplitter, and an
213
MCT (Mercury-Cadmium-Tellurium alloy) detector. The beam size for the analyses was ~ 30 µm.
The spectra were obtained through a CaF2 window with a resolution of 4 cm-1. About 2000 scans
215
were accumulated for a single spectrum. Thin slabs were cut perpendicular to the compression axis
216
of the experimental run products using a high-precision diamond wire saw and polished using
217
diamond mats without acetone or bond materials, such as crystal-bond or orthodontic adhesive
218
paste to avoid IR signal contaminations. Being the samples polycrystalline, it was not possible to
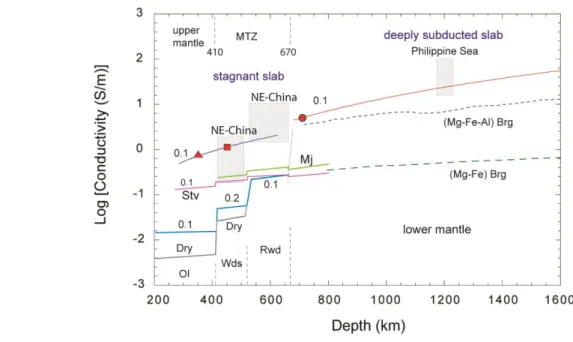
219
perform polarized measurements on single crystals; therefore, we estimated the H2O content of
220
each sample based on several spectra that were taken over many randomly oriented crystals. The
221
spectra were integrated between 2600 and 3800 cm-1, an average of several spectra was calculated
222
for each sample and multiplied by a factor 3. The OH content was quantified using the
Beer-223
Lambert law:
224
CH2O = 18.02 × A × 106 / ε × t × ρ
225
where CH2O is the concentration of hydrous species expressed in ppm H2O by weight, 18.02 is the
226
molecular weight of H2O; A is the total integrated area of bands in the region of interest, t is the
227
thickness of the sample in cm, ε is the molar absorption coefficient, and ρ is the density of the
228
sample in g/L. For the estimation of H2O content in liebermannite, we used the theoretically
229
predicted integral molar absorption coefficient of 250000 L/(mol.cm2) (Koch-Müller & Rhede,
230 2010). 231 232 3. Results 233
The electrical conductivity of liebermannite samples at 12, 15, and 24 GPa are summarized
234
in Fig. 2. The discontinuous increase in electrical conductivity at a temperature above 660 K during
235
the first heating cycle of the 12 GPa experiment coincides with the transformation of K-Feldspar
236
to liebermannite with increasing temperature (Fig. 2a). This transformation accounts for more than
one order of magnitude increase of conductivity for liebermannite. After the complete
238
transformation, the electrical conductivity of libermannite increases with increasing temperature
239
from 700 K to 1500 K and reached to about 1 S/m at 12 GPa and 1500 K. The increase of pressure
240
appears to have an inverse effect on the electrical conduction in liebermannite (Fig. 2b). The
241
impedance spectra of the sample undergoing K-feldspar to libermannite transition with increasing
242
temperature are shown (Fig. 3).
243
The activation enthalpy (H) of each conduction mechanism can be calculated by fitting
244
the data to equation, 𝜎 = 𝜎0𝑒𝑥𝑝(−∆𝐻|𝑅𝑇), where σ is the electrical conductivity (S/m), T is the
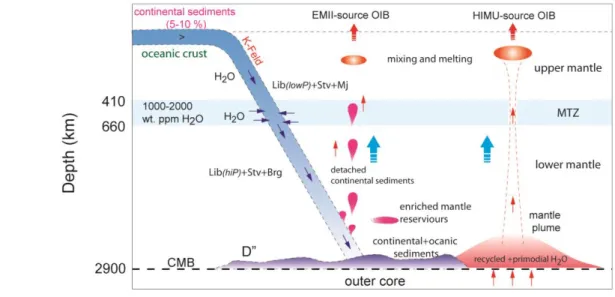
245
absolute temperature (K), σ0 isthe pre-exponential factor (S/m), and R is the gas constant (J/K
246
mol). Here, we analyzed the activation enthalpy, first by manually fitting different temperature
247
segments to the fitting equation and, second, by fitting the equation to the entire temperature range
248
(Fei et al., 2020). The estimated activation enthalpies for different conduction mechanisms obtaine
249
using two fitting methods are listed in Table 1.
250
The EPMA, SEM, and Raman grid-analyses indicate that liebermannite is the principal
251
phase present in samples synthesized at 12, 15, and 24 GPa (Fig. 4). However, minor amounts of
252
wadeite, kyanite, and stishovite presence in our samples, an observation consistent with a previous
253
study (Urakawa et al., 1994) (Table. 2) (Fig.5). The grid analyses with a step size of 5 μm also
254
confirmed the absence of melt in our samples. The minor phases mostly occur as isolated grains
255
within the libermannite matrix (Fig 5a) and the volume fraction of minor phases appeared to
256
decrease with increasing pressure. Chemical analyses of minor phases at the 24 GPa sample were
257
hampered by either absence of minor phases (e.g kyanite) at high-pressure samples or if present,
258
their extremely small grain sizes (< 5μm).
The FTIR analyses of libermannite samples after the electrical conductivity measurements
260
indicate water contents of 1044±87 wt. ppm at 12 GPa, 885±78 wt. ppm at 15 GPa and 1104±18
261
wt. ppm at 24 GPa (Fig 6). The high water contents compared to the K-feldspar starting material
262
suggest that the absorbed moisture in the assembly parts may have been incorporated into the
263
sample during the K-feldspar-libermannite transformation at high-temperature, yielding high
264
water contents in the liebermannite samples (i.e. higher than the amount of water produced by the
265
decomposition of Al(OH)3). We were not able to produce water-free liebermannite samples even
266
with dry pressure materials.
267
The infrared spectra provide information on water incorporation in liebermannite (Fig. 6).
268
Several O-H vibrational modes are observed: (1) the stretching vibrations of weakly hydrogen
269
bound hydroxyl units produce intense bands between 3700 and 3500 cm-1; these modes are more
270
pronounced in the 12 GPa sample. (2) The stretching vibrations of both H2O molecules and more
271
strongly hydrogen bound hydroxyl units occur in the 3425-3100 cm-1 wavenumber range; they
272
become dominant in the 15 and 24 GPa samples (Fig. 6a). (3) The O-H stretching and bending
273
vibrations of the hydronium (H3O+ )ion are observed near 2900 cm-1 and 1665 cm-1; these modes
274
disappear at the highest pressure. In the absence of organic contaminants, such as acetone or bond
275
materials, the coexistence of these two modes confirms the presence of H3O+ in lowP
276
liebermannite. (4) The H-O-H bending vibration of the water molecule slightly shifts from 1610
277
to 1630 cm-1 with increasing pressure (Fig. 6b). (5) The combination (stretching/bending) modes
278
of both H2O molecules (near 5200 cm-1) and hydroxyl units (near 4500 cm-1) display continuous
279
shift to lower frequencies with increasing pressure (Fig. 6c). This shift is compatible with the
280
increase of the strength of hydrogen bonds with pressure, as usually observed in minerals (Cynn
281
& Hofmeister, 1994). The observed spectral features suggest the presence of H2O and H3O+
substituting for K+ in the tunnel (Bethell & Sheppard, 1953) and the substitution of hydrogen (H+)
283
in octahedral sites where it forms O-H bonds with one of the six possible oxygen ions in the vacant
284
octahedral site.
285
The powder X-ray diffraction analyses were conducted on the samples synthesized at 15
286
GPa and 24 GPa. Both patterns can be refined with parameters consistent with the I4/m phase:
287
a = 9.3304(4)Å, c = 2.7223(2)Å. Obtaining the same lattice parameters for the samples out of the
288
different pressures of annealing experiments implies that the liebermannite phase is elastic enough
289
to regain its low-pressure parameters consistent with previous studies (Nishiyama et al., 2005;
290
Sueda et al., 2004).
291 292
4. Discussion and conclusions 293
4. 1 Electrical conduction in liebermannite 294
The electrical conductivity of K-feldspar before transforming into libermannite exhibit
295
higher electrical conductivity compared to the previous electrical conductivity measurements of
296
F-feldspar reported at 1 GPa (Hu et al., 2013). The high electrical conductivity of K-feldspar
297
observed in our study can be explained by the 0.02 wt. % H2O contents in our samples, compared
298
to the dry verity reported by Hu et al. 2013 study. Similar electrical behavior has been observed in
299
dry albite and water-bearing albite (Hu et al., 2013; Ni et al., 2011).
300
The electrical conductivity of hydrous liebermannite increases discontinuously upon
301
increasing temperature (Fig. 2b). At temperatures below 700 K, conductivity is likely to be
302
dominated by molecular water that is loosely bound in the tunnel sites and the associated activation
303
energy is less than 0.40 eV. In the temperature range between 700 K and 1100 K, the conductivity
304
is likely largely due to extrinsic proton defects that are formed due to coupled substitutions of the
octahedral sites. The associated activation energy varies between 0.64 eV and 0.78 eV. At
306
temperatures above 1200 K, the conductivity is likely to be dominated by fast motions of K+ or H+
307
ions (from H3O+) ions in the channel. The associated activation energy is greater than 0.82 eV.
308
Higher conductivity has also been observed in alkali bearing materials with the hollandite crystal
309
structure (Khanna et al., 1981). Such higher conductivity is often referred to as super-ionic
310
conductivity (He et al., 2016; Khanna et al., 1981). In our study, we are documenting such effects
311
at extreme pressures of 12 to 24 GPa in libermannite.
312
The electrical conductivity of minor phases, wadeite, stishovite, and kyanite should not
313
interfere with the measured conductivity of liebermannite due to their low volume fractions (occur
314
as isolated grains). Based on chemical analyses of individual liebermannite grains in our samples,
315
we observe a maximum of 7 % K+ site vacancy in our liebermannite after electrical conductivity
316
measurements at 12, 15, and 24 GPa. The intrinsic defects seem to dominate the conduction
317
mechanism at high temperatures, whereas extrinsic defects may be responsible for the observed
318
conductivity at lower temperatures.
319 320
4.2 Water incorporation in liebermannite 321
The occurrence of several OH stretching bands (Fig. 4a) suggests that different substitution
322
mechanisms take place, including H+ substitution in octahedral sites and H2O/H3O+ in tunnels,
323
resulting in distinct hydrogen bonding strengths. Protons attachment to both bridging and
non-324
bridging oxygen can also help to explain such a wide range of OH stretching vibrations. Strong
325
pleochroism in the 3500-3600 cm-1 range of the polycrystalline sample at 12 GPa indicates the
326
random orientation of the crystals, in contrast to higher pressure samples. Water/hydrogen could
327
be incorporated in liebermannite structure in a variety of sites including the substitution of H+ in
the silicon octahedral sites, i.e., SiSi4+= AlSi3++HSi1+ or SiSi4+= 4HSi1+,thesubstitution of H+ in the
329
aluminum octahedral site AlAl3+= 3HAl1+, the substitution of H+ and H3O+ in the potassium site
330
(KK1+= HK1+, or KK1+= (H3O)K1+) and accommodation of molecular H2O in the tunnel as in
331
KAlSi3O8 + H2O = KAlSi3O8·H2O. The chemical analyses provide crucial information on possible
332
coupled substitution mechanisms for hydrogen incorporation in liebermannite. The slight
333
deficiency in silicon and increase in aluminum observed in some liebermannite grains
334
(K0.957±0.044Al1.090±0.057Si2.931±0.032 O8) is consistent with a reaction involving a substitution in the
335
distorted octahedral with the direct replacement of Si4+ by Al3+ and H+ or by 4H+. The chemical
336
analyses also indicate a slight aluminum deficiency in some crystals (K1.00Al0.983Si3.01 O8). This
337
may suggest possible proton substitution in the octahedral site, replacing Al3+ with 3H+.
338
As the hiP liebermannite is considered the dominant polymorph throughout the Earth’s
339
lower mantle, knowledge on water solubility in the hiP structure becomes crucial to assess the
340
transport of H2O to the deepest lower mantle regions through deep extending slabs. Given the
341
positive clapeyron slope of P (GPa) = 16.6 + 0.007 K (T) between the lowP and hiP liebermannite
342
and assuming that trace quantity of water is unlikely to affect the slope, the hydrous liebermannite
343
sample synthesized at 24 GPa and 1500 K is expected to be the lowP polymorph with tetragonal
344
symmetry (Nishiyama et al., 2005). However, upon a decrease of temperature to 1000 K, at
345
constant pressure, the sample is likely to transform to hiP liebermannite with monoclinic symmetry
346
(Nishiyama et al., 2005). Upon structural transformation from lowP to hiP liebermannite, the
347
electrical resistivity measurements of the sample do not indicate a discontinuous decrease of the
348
electrical resistance, which indicates the release of free fluid phase or hydrous melting in the
349
sample (Freitas & Manthilake, 2019). Assuming that the water incorporation into the liebermannite
350
structure occurs at the highest temperature, this crucial observation suggests that the hiP
liebermannite structure is capable of sequestering H+ into octahedral sites as molecular H2O or
352
ionic H3O+ in its structure similar to the lowP liebermannite. The incorporation of H2O has been
353
observed in both naturally occurring tetragonal and monoclinic hollandite crystal structures with
354
different stoichiometry (Miura, 1986), thus confirming our observations on liebermannite. The
355
micro Raman grid-analyses of our samples after electrical conductivity measurements indicate the
356
absence of melt phases, confirming that the water expulsion may not occur in our samples at high
357
temperatures.
358
Due to the small grain sizes (< 5 μm), infrared analyses in these minor phases were not
359
possible; nevertheless, absence of peaks in the high-wavenumber region of the Raman spectra of
360
wadeite and Al-free stishovite indicates that water is not present within their crystal structure (Fig.
361
7). However, H2O contents up to 3 wt. % have been observed in stishovite containing aluminum
362
(Litasov et al., 2007; Yoshino et al., 2014). IR spectral features of Al-free stishovite exhibit some
363
similarities with those of liebermannite in the spectral range from 3111 to 3261 (Litasov et al.,
364
2007). Particularly peak position of 3117 cm-1 in the sample synthesized at 15 GPa (Fig. 7a)
365
overlaps the main peak position of stishovite at 3117 cm-1 observed for Al- free and Al-bearing
366
stishovite (Yoshino et al., 2014). In order to confirm that the spectral feature at 3117 cm-1 in
367
libermannite, we have analyzed the O-H region of the Raman spectra of stishovite in the 15 GPa
368
sample. The observed water-free conditions (Fig 7a) strongly suggests the spectral feature at 3117
369
cm-1 observed in libermannite could be unrelated to stishovite, rather a spectral feature
370
characteristic of libermannite. We conclude that the similarities btween libermannite and stishovite
371
may be related to similar substitution mechanisms of hydrogen in octahedral sites SiO6 or AlO6.
372
The preferential partitioning of water into the liebermannite phase over stishovite observed in our
373
samples may be partly due to the low Al content in stishovite that is in equilibrium with
liebermannite (Table 2). Therefore, the presence of Al-free stishovite in the studied samples
375
should not influence the IR spectra of liebermannite. Even in the case of very low water contents
376
of about 16-30 wt. ppm observed in Al-free stishovite (Litasov et al., 2007), these should not affect
377
water quantification of liebermannite in this study.
378 379
4.3 Geophysical implications 380
The upper mantle underneath the Philippine Sea (Tarits & Mandéa, 2010) and Northeastern
381
China (Kelbert et al., 2009) is characterized by unusual electrical and seismic wave velocity
382
structures, in particular, electrical conductivities as high as 1 S/m and high-velocity anomalies of
383
up to +δVP 1.5 % and δVS 2.0 % have been observed in these regions. The observed anomalies
384
cannot be readily explained by normal mantle consisting of major mantle phases such as olivine
385
and wadsleyite (Manthilake et al., 2009). If the observed positive velocity anomalies were assumed
386
to be caused by temperature variations alone, the temperature in the uppermost region of the mantle
387
transition zone estimated to be about 800 K below the normal mantle geotherm (Manthilake et al.,
388
2009). The corresponding electrical conductivity of hydrous olivine and wadsleyite for such low
389
temperatures would be significantly lower; as a consequence, the proton conduction in olivine and
390
wadsleyite cannot be responsible for the electrical conductivity observed at the upper mantle and
391
in the mantle transition zone (Manthilake et al., 2009). Similarly, the presence of melt cannot
392
explain the observed anomalies, because even a minor fraction of melt would significantly
393
decrease both the primary (VP) and secondary (VS) wave velocities (Chantel et al., 2016; Freitas
394
et al., 2017; Weidner et al., 2018).
395
Due to superionic conduction properties and high modal abundance (> 30 vol. %) of
396
liebermannite in deeply subducted crustal components, the electrical conduction in slabs is likely
to dominate by the liebermannite. This would make such slab components highly conductive
398
compared to slabs consisting of mafic and ultramafic lithologies (Huang et al., 2005; Yoshino et
399
al., 2008, 2008, 2014). However, the presence of liebermannite alone cannot account for the
400
positive velocity anomaly observed in the upper mantle beneath the Philippine Sea (Tarits &
401
Mandéa, 2010) and northeastern China (Kelbert et al., 2009) because the elastic wave velocities
402
measured in liebermannite are comparable with those of common mantle mineral phases (Caracas
403
& Boffa Ballaran, 2010; Mookherjee & Steinle-Neumann, 2009). Instead, the seismic wave
404
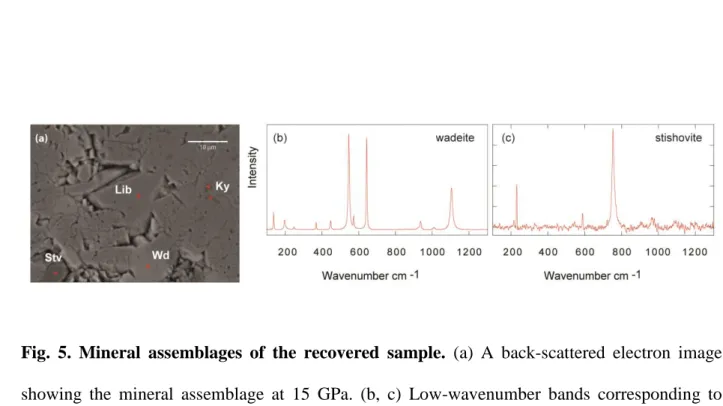
velocities of Al-poor stishovite, another principal mineral phase stable in subducting continental
405
sediments, are notably faster than those of mantle mineral phases (Gréaux et al., 2016). The
406
stishovite co-existing with liebermannite in our samples is noticeably devoid of aluminum (Table
407
2). Here we propose that Al-poor stishovite coexisting with liebermannite in the subducted 408
continental sediments may be responsible for the positive velocity anomaly observed at the mantle
409
transition zone beneath the Philippine Sea (Tarits & Mandéa, 2010) and northeastern China
410
(Kelbert et al., 2009).
411
Continental crustal portion of the subducted slab, consisting of libermannite, majoritic
412
garnet, and stishovite, are expected to have a higher 0.2 g cm-3density than the ambient mantle,
413
but this density relation is overturned at the 660 km discontinuity (Irifune et al., 1994; Nishiyama
414
et al., 2005). This implies that subducting crustal components of the slabs may penetrate into the
415
mantle transition zone, but are prevented from entering the lower mantle (Nishiyama et al., 2005),
416
such as those observed in the Northeastern China subduction system (Ichiki et al., 2006). However,
417
the lower mantle origin of some of the plumes (French & Romanowicz, 2015; Hart et al., 1992)
418
carrying the EM-type components in OIB magmas (Hart et al., 1992) provides strong evidence
419
supporting the presence of recycled continental materials in the lower mantle. We propose that
mixing of continental with oceanic sediments may increase the density of sedimentary components
421
facilitating the sinking of slabs towards the core-mantle boundary. The high electrical conductivity
422
observed at a 1200 km depths in the Earth’s lower mantle beneath the Philippine sea subduction
423
system (Kelbert et al., 2009; Tarits & Mandéa, 2010) may be linked to such continuous subduction
424
of continental sediments across the mantle transition zone into the Earth’s lower mantle (Fig. 7).
425
Owing to hotter temperatures relative to the ambient mantle, the rising plume is unlikely
426
to exchange incompatible elements, including water, with the surrounding mantle, including the
427
hydrated MTZ and the upper mantle (Bercovici & Karato, 2003). Thus, it is likely that the H2O
428
present in plume-derived rocks is primarily linked to the deep lower mantle source. The relatively
429
high H2O contents of OIB derived from deep mantle plumes hint towards the presence of hydrated
430
crustal components present in the deeper part of the lower mantle (Fig. 8). While major mineral
431
phases in pyrolitic compositions are almost devoid of H2O under lower mantle conditions, our
432
study demonstrates that liebermannite could be an important host of H2O in the Earth’s lower
433
mantle. In this scenario, H2O in the EMII-source OIB is primarily related to deeply subducted
434
continental materials, in which liebermannite is the principal H2O carrier. On the other hand, the
435
subducted continental materials that may reach the core-mantle boundary would hydrate the HIMU
436
type plume sources together with a possible contribution from dense hydrous magnesium silicates
437
(DHMS) (Nishi et al., 2014; Pamato et al., 2014) and primordial H2O (Dixon et al., 2002).
438 439 440 441 442 443
Acknowledgments 444
We thank Nathalie Bolfan-Casanova and Maud Boyet for constructive discussion, J-L. Devidal for
445
his assistance with electron microprobe analyses and Emmy Voyer for her assistance with SEM
446
analyses. The constructive and in-depth reviews by the associate Editor, and two reviewers: Lidong
447
Dai and Hongzhan Fei substantially improved the quality of the manuscript.G.M. acknowledges
448
funding from the(INSU-CNRS. M.M. is supported by the US National Science Foundation grants,
449
EAR 1753125, 1763215. This research was financed by the French Government Laboratory of
450
Excellence initiative n°ANR-10-LABX-0006, the Région Auvergne, and the European Regional
451
Development Fund (ClerVolc contribution number xx). The authors comply with AGU's data
452
policy, and the data of this study are available in Figshare.
453
(https://figshare.com/articles/Water_content_calculations/12179067)
454
and (https://figshare.com/articles/Experimental_data_xlsx/12179046).
455
The authors declare no competing financial interests.
456 457
References 458
Bercovici, D., & Karato, S.-I. (2003). Whole-mantle convection and the transition-zone water
459
filter. Nature, 425(6953), 39–44. https://doi.org/10.1038/nature01918
460
Bethell, D. E., & Sheppard, N. (1953). The Infrared Spectrum of the H3O + Ion in Acid
461
Hydrates. Journal of Chemical Physics, 21, 1421. https://doi.org/10.1063/1.1699260
462
Bolfan-Casanova, N., Keppler, H., & Rubie, D. C. (2003). Water partitioning at 660 km depth
463
and evidence for very low water solubility in magnesium silicate perovskite. Geophysical
464
Research Letters, 30(17), 1905. https://doi.org/10.1029/2003GL017182
465
Cabral, R. A., Jackson, M. G., Koga, K. T., Rose-koga, E. F., Hauri, E. H., Whitehouse, M. J., et
al. (2014). Volatile cycling of H2O, CO2, F, and Cl in the HIMU mantle: A new window
467
provided by melt inclusions from oceanic hot spot lavas at Mangaia, Cook Islands.
468
Geochemistry Geophysics Geosystems, 15, 4445–4467.
469
https://doi.org/10.1002/2014GC005473.Received
470
Caracas, R., & Boffa Ballaran, T. (2010). Elasticity of (K,Na)AlSi3O8 hollandite from lattice
471
dynamics calculations. Physics of the Earth and Planetary Interiors, 181(1–2), 21–26.
472
Retrieved from http://dx.doi.org/10.1016/j.pepi.2010.04.004
473
Chantel, J., Manthilake, G., Andrault, D., Novella, D., Yu, T., & Wang, Y. (2016). Experimental
474
evidence supports mantle partial melting in the asthenosphere. Science Advances, 2(5),
475
e1600246.
476
Cynn, H., & Hofmeister, A. M. (1994). High-pressure IR spectra of lattice modes and OH
477
vibrations in Fe- bearing wadsleyite. Journal of Geophysical Research, 99(B9), 17717–
478
17727. https://doi.org/10.1029/94jb01661
479
Deschamps, F., Kaminski, E., & Tackley, P. J. (2011). A deep mantle origin for the primitive
480
signature of ocean island basalt. Nature Geoscience, 4(11), 1–4.
481
https://doi.org/10.1038/ngeo1295
482
Dixon, J. E., Leist, L., Langmuir, C., & Schilling, J. (2002). Recycled dehydrated lithosphere
483
observed in plume-influenced mid-ocean-ridge basalt. Nature, 420, 385–389.
484
Fei, H., Druzhbin, D., & Katsura, T. (2020). The Effect of Water on Ionic Conductivity in
485
Olivine. Journal of Geophysical Research: Solid Earth, 125(3).
486
https://doi.org/10.1029/2019JB019313
487
Ferroir, T., Onozawa, T., Yagi, T., Merkel, S., Miyajima, N., Nishiyama, N., et al. (2006).
488
Equation of state and phase transition in KAlSi3O8 hollandite at high pressure. American
Mineralogist, 91, 327–332. https://doi.org/10.2138/am.2006.1879
490
Freitas, D., & Manthilake, G. (2019). Electrical conductivity of hydrous silicate melts :
491
Implications for the bottom-up hydration of Earth ’ s upper mantle. Earth and Planetary
492
Science Letters, 523, 115712. https://doi.org/10.1016/j.epsl.2019.115712
493
Freitas, D., Manthilake, G., Schiavi, F., Chantel, J., Bolfan-Casanova, N., Bouhifd, M. A., &
494
Andrault, D. (2017). Experimental evidence supporting a global melt layer at the base of the
495
Earth’s upper mantle. Nature Communications, 8(1), 2186.
https://doi.org/10.1038/s41467-496
017-02275-9
497
French, S. W., & Romanowicz, B. (2015). Broad plumes rooted at the base of the Earth’s mantle
498
beneath major hotspots. Nature, 525(7567), 95–99. https://doi.org/10.1038/nature14876
499
Fu, S., Yang, J., Karato, S. ichiro, Vasiliev, A., Presniakov, M. Y., Gavrilliuk, A. G., et al.
500
(2019). Water Concentration in Single-Crystal (Al,Fe)-Bearing Bridgmanite Grown From
501
the Hydrous Melt: Implications for Dehydration Melting at the Topmost Lower Mantle.
502
Geophysical Research Letters, 46(17–18), 10346–10357.
503
https://doi.org/10.1029/2019GL084630
504
Furusawa, S., Suemoto, T., & Ishigame, M. (1988). Quasielastic light scattering in the
one-505
dimensional superionic conductor hollandites. Physical Review B, 38(17), 12600–12606.
506
Gréaux, S., Kono, Y., Wang, Y., Yamada, A., Zhou, C., Jing, Z., et al. (2016). Sound velocities
507
of aluminum-bearing stishovite in the mantle transition zone. Geophysical Research Letters,
508
43, 4239–4246. https://doi.org/10.1002/2016GL068377.Received
509
Hacker, B. R. (2008). H2O subduction beyond arcs. Geochemistry Geophysics Geosystems, 9(3),
510
Q03001. https://doi.org/10.1029/2007GC001707
511
Hart, S. R. (1988). Heterogeneous mantle domains : signatures , genesis and mixing
chronologies. Earth and Planetary Science Letters, 90, 273–296.
513
Hart, S. R., Hauri, E. H., Oschmann, L. A., & Whitehead, J. A. (1992). Mantle Plumes and
514
Entrainment : Isotopic Evidence. Science, 256, 517–521.
515
He, Y., Sun, Y., Lu, X., Gao, J., Li, H., & Li, H. (2016). First-principles prediction of fast
516
migration channels of potassium ions in KAlSi3O8 hollandite: Implications for high
517
conductivity anomalies in subduction zones. Geophysical Research Letters, 43(12), 6228–
518
6233. https://doi.org/10.1002/2016GL069084.Received
519
van der Hilst, R. D., Widiyantoro, S., & Engdahl, E. R. (1997). Evidence for deep mantle
520
circulation from global tomography. Nature, 386, 578–584. Retrieved from
521
http://dx.doi.org/10.1038/386578a0
522
Hirschmann, M. M. (2006). Water, Melting, and the Deep Earth H2O Cycle. Annual Review of
523
Earth and Planetary Sciences, 34(1), 629–653.
524
https://doi.org/10.1146/annurev.earth.34.031405.125211
525
Hu, H., Li, H., Dai, L., Shan, S., & Zhu, C. (2013). Electrical conductivity of alkali feldspar solid
526
solutions at high temperatures and high pressures. Physics and Chemistry of Minerals,
527
40(1), 51–62. https://doi.org/10.1007/s00269-012-0546-4
528
Huang, X., Xu, Y., & Karato, S. (2005). Water content in the transition zone from electrical
529
conductivity of wadsleyite and ringwoodite. Nature, 434(7034), 746–749.
530
https://doi.org/10.1038/nature03426
531
Ichiki, M., Baba, K., Obayashi, M., & Utada, H. (2006). Water content and geotherm in the
532
upper mantle above the stagnant slab : Interpretation of electrical conductivity and seismic
533
P-wave velocity models. Physics of the Earth and Planetary Interiors, 155, 1–15.
534
https://doi.org/10.1016/j.pepi.2005.09.010
Irifune, T., Ringwood, A. E., & Hibberson, W. O. (1994). Subduction of continental crust and
536
terrigenous and pelagic sediments: an experimental study. Earth and Planetary Science
537
Letters, 126, 351–368.
538
Katsura, T., Sato, K., & Ito, E. (1998). Electrical conductivity of silicate perovskite at
lower-539
mantle conditions. Nature, 395(October), 493–495. https://doi.org/10.1038/26736
540
Katsura, T., Yoneda, A., Yamazaki, D., Yoshino, T., Ito, E., Suetsugu, D., et al. (2010).
541
Adiabatic temperature profile in the mantle. Physics of the Earth and Planetary Interiors,
542
183(1–2), 212–218. https://doi.org/10.1016/j.pepi.2010.07.001
543
Kawai, K., & Tsuchiya, T. (2013). First-principles study on the high-pressure phase transition
544
and elasticity of KAlSi3O8 hollandite. American Mineralogist, 98, 207–218.
545
https://doi.org/10.2138/am.2007.2246
546
Kelbert, A., Schultz, A., & Egbert, G. (2009). Global electromagnetic induction constraints on
547
transition-zone water content variations. Nature, 460(7258), 1003–1006.
548
https://doi.org/10.1038/nature08257
549
Khanna, S. K., Gruner, G., Orbach, R., & Beyeler, H. U. (1981). Thermally Activated
550
Microwave Conductivity in the Superionic Conductor Hollandite
551
(K1.54Mg0.77Ti7.23O16). Physical Review Letters, 47(4), 255–257.
552
Koch-Müller, M., & Rhede, D. (2010). IR absorption coefficients for water in nominally
553
anhydrous high-pressure minerals. American Mineralogist, 95(5–6), 770–775.
554
https://doi.org/10.2138/am.2010.3358
555
Litasov, K. D., Kagi, H., Shatskiy, A., Ohtani, E., Lakshtanov, D. L., Bass, J. D., & Ito, E.
556
(2007). High hydrogen solubility in Al-rich stishovite and water transport in the lower
557
mantle. Earth and Planetary Science Letters, 262, 620–634.
https://doi.org/10.1016/j.epsl.2007.08.015
559
Manthilake, G., Matsuzaki, T., Yoshino, T., Yamashita, S., Ito, E., & Katsura, T. (2009).
560
Electrical conductivity of wadsleyite as a function of temperature and water content.
561
Physics of the Earth and Planetary Interiors, 174(1–4), 10–18.
562
https://doi.org/10.1016/j.pepi.2008.06.001
563
Manthilake, G., Mookherjee, M., Bolfan-Casanova, N., & Andrault, D. (2015). Electrical
564
conductivity of lawsonite and dehydrating fluids at high pressures and temperatures.
565
Geophysical Research Letters, 42(18), 7398–7405. https://doi.org/10.1002/2015GL064804
566
Miura, H. (1986). The crystal structure of hollandite. Mineralogical Journal, 13(3), 119–129.
567
Mookherjee, M., & Steinle-Neumann, G. (2009). Detecting deeply subducted crust from the
568
elasticity of hollandite. Earth and Planetary Science Letters, 288(3–4), 349–358.
569
https://doi.org/10.1016/j.epsl.2009.09.037
570
Ni, H., Keppler, H., Manthilake, M. A. G. M., & Katsura, T. (2011). Electrical conductivity of
571
dry and hydrous NaAlSi3O8 glasses and liquids at high pressures. Contributions to
572
Mineralogy and Petrology, 162(3), 501–513. https://doi.org/10.1007/s00410-011-0608-5
573
Nishi, M., Irifune, T., Tsuchiya, J., Tange, Y., Nishihara, Y., Fujino, K., & Higo, Y. (2014).
574
Stability of hydrous silicate at high pressures and water transport to the deep lower mantle.
575
Nature Geoscience, 7, 224–227. https://doi.org/10.1038/NGEO2074
576
Nishiyama, N., Rapp, R. P., Irifune, T., Sanehira, T., Yamazaki, D., & Funakoshi, K. I. (2005).
577
Stability and P – V – T equation of state of KAlSi3O8 -hollandite determined by in situ
X-578
ray observations and implications for dynamics of subducted continental crust material.
579
Physics and Chemistry of Minerals, 32, 627–637.
https://doi.org/10.1007/s00269-005-0037-580
y
Ohta, K., Hirose, K., Ichiki, M., Shimizu, K., Sata, N., & Ohishi, Y. (2010). Electrical
582
conductivities of pyrolitic mantle and MORB materials up to the lowermost mantle
583
conditions. Earth and Planetary Science Letters, 289(3–4), 497–502.
584
https://doi.org/10.1016/j.epsl.2009.11.042
585
Pamato, M. G., Myhill, R., Boffa Ballaran, T., Frost, D. J., Heidelbach, F., & Miyajima, N.
586
(2014). Lower-mantle water reservoir implied by the extreme stability of a hydrous
587
aluminosilicate. Nature Geoscience, 8, 75–79. https://doi.org/10.1038/NGEO2306
588
Rodriguez-Carvajal, J. (1993). Recent advances in magnetic structure determination by neutron
589
powder diffraction. Physica B: Condensed Matter, 192, 55–69.
590
Schiavi, F., Bolfan-Casanova, N., Withers, A. C., Médard, E., Laumonier, M., Laporte, D., et al.
591
(2018). Water quantification in silicate glasses by Raman spectroscopy: Correcting for the
592
effects of confocality, density and ferric iron. Chemical Geology, 483(March), 312–331.
593
https://doi.org/10.1016/j.chemgeo.2018.02.036
594
Schmidt, M. W. (1996). Experimental Constraints on Recycling of Potassium from Subducted
595
Oceanic Crust. Science, 272(5270), 1927–1930.
596
https://doi.org/10.1126/science.272.5270.1927
597
Sinmyo, R., Pesce, G., Greenberg, E., McCammon, C., & Dubrovinsky, L. (2014). Lower mantle
598
electrical conductivity based on measurements of Al, Fe-bearing perovskite under lower
599
mantle conditions. Earth and Planetary Science Letters, 393, 165–172.
600
https://doi.org/10.1016/j.epsl.2014.02.049
601
Smyth, J. R., & Jacobsen, S. D. (2006). Nominally anhydrous minerals and Earth ’ s deep water
602
cycle. (S. van der Lee & S. D. Jacobsen, Eds.), American Geophysical Union Monograph
603
Series. Washington DC: American Geophysical Union.
Sueda, Y., Irifune, T., Nishiyama, N., Rapp, R. P., Ferroir, T., Onozawa, T., et al. (2004). A new
605
high-pressure form of KAlSi3O8 under lower mantle conditions. Geophysical Research
606
Letters, 31(23), 1–4. https://doi.org/10.1029/2004GL021156
607
Syracuse, E. M., Keken, P. E. Van, Abers, G. A., van Keken, P. E., Abers, G. A., Suetsugu, D.,
608
et al. (2010). The global range of subduction zone thermal models. Physics of the Earth and
609
Planetary Interiors, 183(1–2), 73–90. https://doi.org/10.1016/j.pepi.2010.02.004
610
Tarits, P., & Mandéa, M. (2010). The heterogeneous electrical conductivity structure of the
611
lower mantle. Physics of the Earth and Planetary Interiors, 183, 115–125.
612
https://doi.org/10.1016/j.pepi.2010.08.002
613
Urakawa, S., Kondo, T., Igawa, N., Shimomura, O., & Ohno, H. (1994). Synchrotron Radiation
614
Study on the High-Pressure and High-Temperature Phase Relations of KAISi3O8. Physics
615
and Chemistry of Minerals, 21, 387–391.
616
Weidner, D. J., Li, L., Whitaker, M. L., & Triplett, R. (2018). Ultrasonic Acoustic Velocities
617
During Partial Melting of a Mantle Peridotite KLB-1. Journal of Geophysical Research:
618
Solid Earth, 123(2), 1252–1261. https://doi.org/10.1002/2017JB014753
619
Willbold, M., & Stracke, A. (2006). Trace element composition of mantle end-members:
620
Implications for recycling of oceanic and upper and lower continental crust. Geochemistry
621
Geophysics Geosystems, 7, Q04004. https://doi.org/10.1029/2005GC001005
622
Yoshikado, S., Ohachi, T., Taniguchi, I., Onoda, Y., Watanabe, M., & Fujiki, Y. (1982). Ionic
623
conductivity of hollandite type compounds from 100 Hz to 37.0 GHz. Solid State Ionics, 7,
624
335–344.
625
Yoshino, T., Manthilake, G., Matsuzaki, T., & Katsura, T. (2008). Dry mantle transition zone
626
inferred from the conductivity of wadsleyite and ringwoodite. Nature, 451(7176), 326–329.
https://doi.org/10.1038/nature06427
628
Yoshino, T., Nishi, M., Matsuzaki, T., Yamazaki, D., & Katsura, T. (2008). Electrical
629
conductivity of majorite garnet and its implications for electrical structure in the mantle
630
transition zone. Physics of the Earth and Planetary Interiors, 170(3–4), 193–200.
631
https://doi.org/10.1016/j.pepi.2008.04.009
632
Yoshino, T., Shimojuku, A., & Li, D. (2014). Electrical conductivity of stishovite as a function
633
of water content. Physics of the Earth and Planetary Interiors, 227, 48–54.
634
https://doi.org/10.1016/j.pepi.2013.12.003
635
Yoshino, T., Kamada, S., Zhao, C., Ohtani, E., & Hirao, N. (2016). Electrical conductivity model
636
of Al-bearing bridgmanite with implications for the electrical structure of the Earth’s lower
637
mantle. Earth and Planetary Science Letters, 434, 208–219.
638 https://doi.org/10.1016/j.epsl.2015.11.032 639 640 641 642 643 644 645 646 647 648 649 650
Figures 651
652
Fig.1. A schematic cross-section of the assembly. (a) Used for the synthesis of K-feldspar. (b) 653
For electrical conductivity measurements at high-pressure and high-temperature. The three-654
electrode configuration for electrical conductivity, which designed to avoid electrode leads sharing
655
the same tungsten carbide anvil in the KAWAI-cell, is expected to improve the insulation
656
resistance of the assembly.
657 658 659 660 661 662 663
664
Fig. 2. The electrical conductivity of liebermannite as a function of inverse temperature. (a) 665
A plot of the logarithm of electrical conductivity as a function of inverse temperature. The
666
transformation of K-feldspar to liebermannite occurred above 600 K resulting in more than one
667
order of magnitude increase of conductivity. (b) Liebermannite at pressures 12, 15, and 24 GPa.
668
Different conduction mechanisms are labeled in different colors. The activation enthalpies are
669
shown next to individual fitting lines. The error bars associated with the electrical conductivity
670
data measurements are less than the symbol size at high temperatures.
671 672 673 674 675 676
677 678 679 680 681 682 683 684 685 686 687 688 689 690 691
Fig. 3. Impedance spectra of the sample at different stages of heating at 12 GPa. (a) at 500 K 692
electrical conductivity of K-feldspar before transforming into liebermannite, (b) at 718 K and 750
693
K, on the onset of the phase transformation, the second arc in the spectra develops. These
694
additional arcs correspond to the formation of liebermannite. (c) At 850 K, after the complete
695
transformation into liebermannite, there is a significant increase in the sample resistance. The
696
sample resistance is due to the single conductive libermannite phase. The corresponding equivalent
697
circuit.
698 699
700 701 702 703 704 705 706 707 708 709 710 711 712
Fig. 4. Raman spectra of liebermannite at 12, 15, and 24 GPa. 713 714 715 716 717 718 719 720 721 722
723 724 725 726
727
Fig. 5. Mineral assemblages of the recovered sample. (a) A back-scattered electron image 728
showing the mineral assemblage at 15 GPa. (b, c) Low-wavenumber bands corresponding to
729
vibrations of the alumino-silicate network; (b) wadeite, (c) stishovite.
730 731 732 733 734 735 736 737 738 739 740 741
742
743 744 745
Fig. 6. FTIR spectra of liebermannite. (a) Near IR spectra of samples synthesized at 12 (green 746
lines), 15 (blue lines), and 24 (red lines) GPa. The calculated H2O contents (ppm wt.) are indicated
747
next to spectra. (b) Middle IR spectra of the three samples showing bending modes of H2O
748
molecules and H3O+ ions. (c) High-wavenumber IR region displaying bands at ~5200 (stretching
749
vibrations of H2O) and 4500-4700 cm-1 (O-H stretching vibrations). The peak at 4170 cm-1 could
750
be related to H-H vibrations.
752 753 754 755 756 757 758 759 760 761 762 763
Fig. 7. Raman spectra of minor phases observed at the sample synthesized at 15 GPa. The 764
background uncorrected Raman spectra in the O-H region of stishovite (a) and wadeite (b),
co-765
existing with liebermannite. The background noise of the Raman spectrum of stishovite was
766
smoothed using the loess regression method shown in the blue line. Both indicate water absent
767
conditions in their crystal structure. Raman analyses of kyanite were not possible due to their small
768 grain sizes. 769 770 771 772 773 774
775 776 777 778 779 780 781 782 783 784
Fig. 8. Comparison of electrical conductivities of liebermannite with global and regional 785
electrical conductivity profiles. The blue and red lines correspond to the extrapolation of 786
electrical conductivity along the relevant subduction geotherms (Syracuse et al., 2010), and along
787
the adiabatic geotherm in the lower mantle (Katsura et al., 2010), respectively. The red shaded
788
triangle, square, and the circle indicate the electrical conductivity of liebermannite at 12, 15, and
789
24 GPa, respectively. The gray shaded boxes indicate the conductivity profiles of NE-China
790
(Kelbert et al., 2009) and the Philippine Sea (Tarits & Mandéa, 2010). The electrical conductivity
791
profiles of dry (black lines) and wet (blue lines) olivine, wadsleyite, ringwoodite (Yoshino et al.,
792
2008), stishovite with 0.1 wt% of H2O (Yoshino et al., 2014) (pink lines) and majorite garnet
793
(Yoshino et al., 2008) (light green lines) are shown for comparison. The electrical conductivity of
794
(Mg, Fe) bridgmanite (Katsura et al., 1998) (green dashed line) and (Mg, Fe, Al) bridgmanite (Ohta
795
et al., 2010; Sinmyo et al., 2014; Yoshino et al., 2016) (blue dashed line), extrapolated along the
796
adiabatic geotherm in the lower mantle (Katsura et al., 2010), are shown for comparison. The
797
numbers next to conductivity lines are the water contents in wt. %.
799 800 801 802 803 804 805 806
Fig. 9. The potential mechanism explaining the elevated H2O content in ocean island basalts.
807
K-feldspar in subducting continental sediments transforms to liebermannite above 8 GPa and
808
continues to be stable down to the core-mantle boundary conditions. Most of the H2O carried to
809
the lower mantle by deep penetrating slabs may have been incorporated into the slab at the surface.
810
However, due to the imbalance of the mass of H2O transported to the Mantle Transition Zone
811
(MTZ) via subduction (Hacker, 2008) and the estimated mass of H2O stored in MTZ based on
812
H2O contents of constituent phases (Freitas & Manthilake, 2019), extraction of H2O from MTZ
813
to the lower mantle can be expected. Because of the ability of libermannite to accommodate several
814
wt. % of the water in its structure (both in lattice defects and the tunnel structures), we argue that
815
libermannite could be a possible carrier of water from the MTZ to the lower mantle. In this
two-816
step, H2O conveyor process, the extraction of H2O by rehydration of deep penetrating slabs at the
817
MTZ would be a likely scenario. Depending on gravitational stability, the subducting continental
818
sediment component may detach from deep-extending slabs, rise through the mantle forming
819
EMII-source OIB, in which liebermannite is the principal water carrier. Some continental
820
sediments may reach the CMB and provide H2O for HIMU-source lower mantle-derived plumes.
821
(Lib: liebermannite, Sa: K-feldspar, Mj: majorite garnet, Brg: bridgmanite, Stv; stishovite).
822 823 824 825

![Antideuteron production in ϒ(nS) decays and in e[superscript +]e[superscript −] → q[bar over q] at √s ≈ 10.58 GeV](data:image/gif;base64,R0lGODlhAQABAIAAAP///wAAACH5BAEAAAAALAAAAAABAAEAAAICRAEAOw==)