HAL Id: hal-01210010
https://hal.archives-ouvertes.fr/hal-01210010
Submitted on 28 May 2020
HAL is a multi-disciplinary open access
archive for the deposit and dissemination of
sci-entific research documents, whether they are
pub-lished or not. The documents may come from
teaching and research institutions in France or
abroad, or from public or private research centers.
L’archive ouverte pluridisciplinaire HAL, est
destinée au dépôt et à la diffusion de documents
scientifiques de niveau recherche, publiés ou non,
émanant des établissements d’enseignement et de
recherche français ou étrangers, des laboratoires
publics ou privés.
Julien Y. Dutheil, Sylvain Gaillard, Eva H. Stukenbrock
To cite this version:
Julien Y. Dutheil, Sylvain Gaillard, Eva H. Stukenbrock. MafFilter: a highly flexible and extensible
multiple genome alignment files processor. BMC Genomics, BioMed Central, 2014, 15,
�10.1186/1471-2164-15-53�. �hal-01210010�
Dutheil et al. BMC Genomics 2014, 15:53
http://www.biomedcentral.com/1471-2164/15/53
S o f t w a r e
Open Access
MafFilter: a highly flexible and extensible
multiple genome alignment files processor
Julien Y Dutheil
1,2*, Sylvain Gaillard
3,4,5and Eva H Stukenbrock
6Abstract
Background: Sequence alignments are the starting point for most evolutionary and comparative analyses. Full genome sequences can be compared to study patterns of within and between species variation. Genome sequence alignments are complex structures containing information such as coordinates, quality scores and synteny structure, which are stored in Multiple Alignment Format (MAF) files. Processing these alignments therefore involves parsing and manipulating typically large MAF files in an efficient way.
Results: MafFilter is a command-line driven program written in C++ that enables the processing of genome
alignments stored in the Multiple Alignment Format in an efficient and extensible manner. It provides an extensive set of tools which can be parametrized and combined by the user via option files. We demonstrate the software’s functionality and performance on several biological examples covering Primate genomics and fungal population genomics. Example analyses involve window-based alignment filtering, feature extractions and various statistics, phylogenetics and population genomics calculations.
Conclusions: MafFilter is a highly efficient and flexible tool to analyse multiple genome alignments. By allowing the user to combine a large set of available methods, as well as designing his/her own, it enables the design of custom data filtering and analysis pipelines for genomic studies. MafFilter is an open source software available at
http://bioweb.me/maffilter.
Background
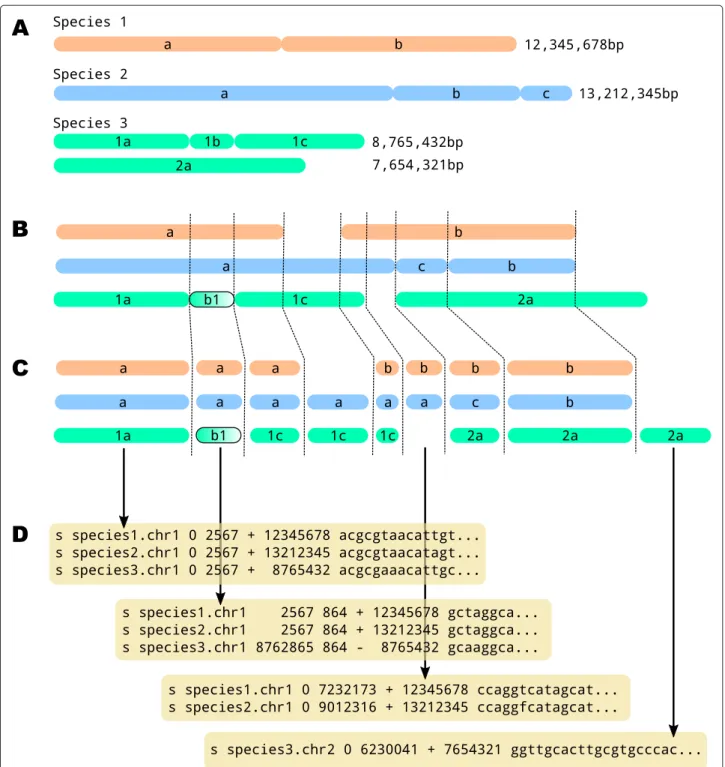
Evolutionary comparative genomics and population genomics analyses build on alignments of genome sequences that record homologous nucleotide positions between two or more genomes. While gene alignments are described with only three types of character edit (mis-matches, insertions and deletions), genome alignments allow for rearrangements, such as inversions, complemen-tations and translocations, leading to breakage of at least one of the input sequence. Regions devoid of such breaks are called synteny blocks, and a genome alignment can be defined as a set of such blocks of homologous positions (Figure 1).
Multiple alignment files are used for storing and shar-ing genome comparison data. They are typically written
*Correspondence: [email protected]
1Max Planck Institute for Terrestrial Microbiology, Department of Organismic Interactions, Marburg, Germany
2Université Montpellier 2, CNRS UMR 5554, Institut des Sciences de l’Evolution de Montpellier, Place E. Bataillon, Montpellier 34095, France
Full list of author information is available at the end of the article
in the Multiple Alignment Format (MAF, see Figure 1D), a format in particular popularized by the UCSC genome browser [1]. Programs generating MAF files include BlastZ and MultiZ from the Threaded Blockset Aligner (TBA) package [2] or Last [3]. The multiple alignment serves as an entry to further analyses and several process-ing steps are required to filter the data, particularly the removal of low-quality regions. In addition, many down-stream analysis tools take as input single syntenic blocks only, requiring the global alignment to be exported into multiple alignment files in an external format such as Fasta or Phylip. This conversion often comes at the cost of losing information such as original genome coordi-nates that may be required in the further analysis pipeline. Solutions to this issue can involve the generation of a database that integrates all analyses results [4]. This is however a tedious process, which conveniently can be avoided.
We here introduce a new program which facilitates the processing and analysis of multiple alignment files. The
© 2014 Dutheil et al.; licensee BioMed Central Ltd. This is an Open Access article distributed under the terms of the Creative Commons Attribution License (http://creativecommons.org/licenses/by/2.0), which permits unrestricted use, distribution, and reproduction in any medium, provided the original work is properly cited.
Figure 1 Genome alignment. A) Schematic karyotypes of three species and length of their chromosomes. B) Chromosome alignment of the three species. Species 2 displays a rearrangement (segments b and c are inverted), and species 3 has an inversion (segment 1b). C) Corresponding synteny blocks. D) Synteny blocks written in the MAF format.
program allows the user to define his/her own analy-sis pipeline and efficiently processes the input MAF file. Each synteny block is processed separately and passed through a series of filters previously defined by the user (see Figure 2). Each filter performs a predefined task, such as cleaning the alignment or computing relevant statistics,
and passes the synteny block, eventually modified, to the next filter. The output of the program is typically one or several MAF files, and/or several alignment files in exter-nal formats like Fasta or Phylip. Furthermore the program allows the output of statistical results in spreadsheet files, or even tree files if phylogenetics analyses are involved.
Dutheil et al. BMC Genomics 2014, 15:53 Page 3 of 10 http://www.biomedcentral.com/1471-2164/15/53
Figure 2 Example pipeline. The UCSC 46 vertebrate genome alignment of Human chromosome 1 is processed through several filters in order to reconstruct the genealogy of the Primate sequences in windows of 1kb. The distribution of block sizes at various steps of the filtering is shown under Results.
MafFilter deals internally with sequence meta-data such as genome coordinates or quality scores, thereby facilitat-ing the analysis of final results and their integration with external sources of information.
Implementation Program interface
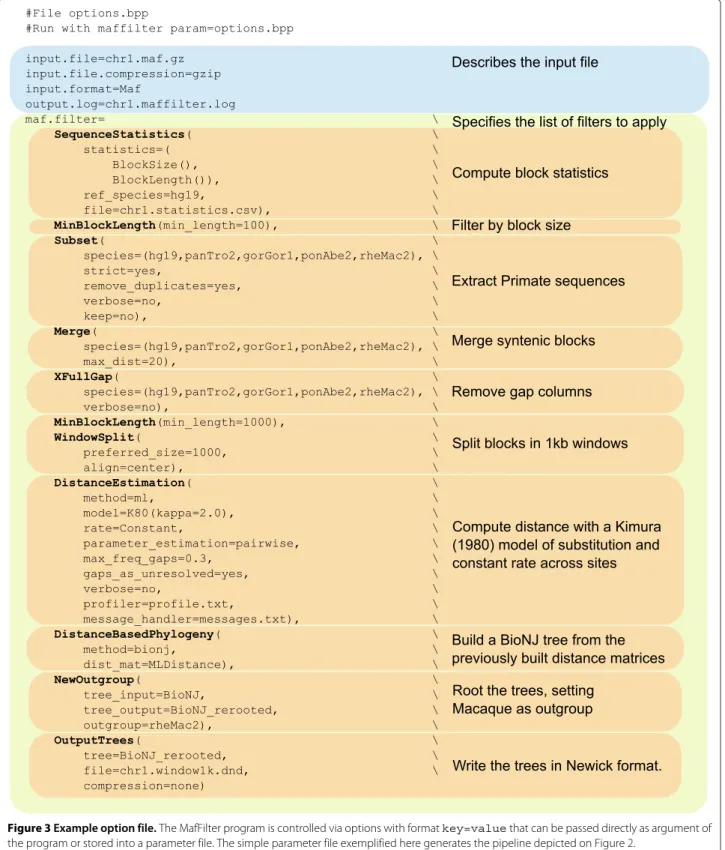
The MafFilter program provides a command line interface to the MAF parser and filters from the Bio++ libraries. It uses the Bio++ Options language, a ‘key-value’ syntax introduced for the Bio++ Program Suite which features strong similarities with the R statistical language [5,6]. Briefly, the behaviour of MafFilter is controlled via com-mands of the type option=value, which can be passed as arguments to the program, or stored in an indepen-dent option file. In the simplest case, values are simple numbers or expressions, but can be of more complex structures with arguments. Figure 3 shows the option file generating the pipeline displayed in Figure 2. The first lines describe the input file (path, format and compres-sion). Subsequently is given a list of filters, defining the various steps in the pipeline (see Table 1 for available fil-ters). Each filter accepts several arguments allowing the user to specify parameters and output files. The special filter SequenceStatistics allows the computation of several statistics (Table 2) which are specified by the user. Some of these statistics accept additional control argu-ments such as a subset of species, or ingroup and outgroup specifications.
Code design
The central data elements in a genome alignment are synteny blocks, i.e. contiguous genomic regions shar-ing common ancestry represented as a sequence align-ment. A genome alignment consists of a collection of these blocks together with the corresponding coordi-nates for each single genome. We developed new data structures for handling such data. Each synteny block is stored as a MafBlock instance which stores the under-lying alignment into a SiteContainer, a central class of the Bio++ library for which numerous methods and tools are already available [7]. Individual sequences are stored as MafSequence objects, an extension of the SequenceWithAnnotation class from the bpp-seq library allowing the storage and processing of associ-ated quality scores. In addition, MafSequence stores genomic coordinates as chromosome names, strands and start positions.
To process the input genome alignment, MafFilter uses a streaming strategy, as storing all alignment blocks into memory would be highly inefficient, if ever possi-ble, for large data sets. We developed an iterator-based implementation, which loops over all blocks in a file while storing only the necessary information in memory.
This is achieved through the new MafIterator classes, which retrieve the next available block when calling the nextBlock method. The use of iterator classes permits to easily implement complex process-ing procedures as workflows. We name “filter” a special instance of MafIterator which takes as input (typi-cally via the constructor of the class) another instance of MafIterator. Calling the nextBlock method of the filter will automatically call the nextBlock method of the input MafIterator. Looping on the final iterator will thereby automatically loop over all input blocks. As a filter can input another filter it is possible to design a com-plete processing chain in an easy and highly modulable way.
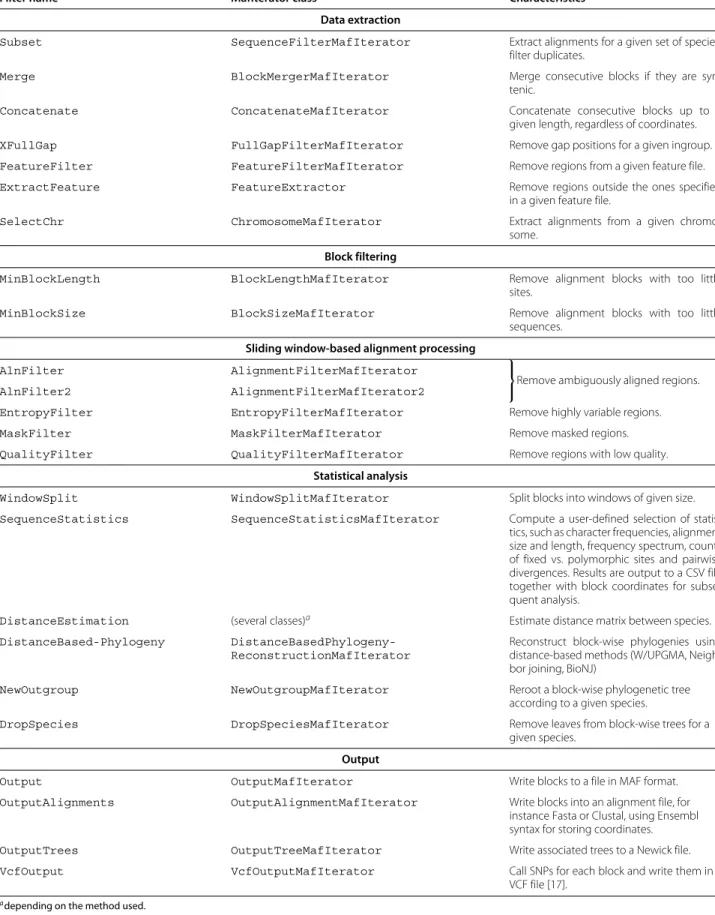
Table 1 lists all currently available MafIterator classes. One of the classes implementing the MafIterator interface is the MafAlignmentParser itself, which iterates over all blocks in a MAF file. Conversely, the OutputMafIterator class takes as input another MafIteratorand writes all available blocks to a file in the MAF format. Finally, the SequenceStatistics-MafIteratorapplies a series of user-defined statistics on each block, before forwarding it without modification. Usable statistics (see Table 2 for list of currently avail-able statistics) implement the MafStatistics inter-face. Adding new processing steps to MafFilter is made easy by this object-oriented, iterator-based implementa-tion as the developer only has to provide a new imple-mentation of the MafIterator or MafStatistics interfaces. These new C++ classes can also be used for developing new software independently of MafFilter and we therefore distribute them as part of the Bio++
bpp-seq-omicslibrary [6].
Computer efficiency
As MAF files can be rather large (typically several giga-bytes) MafFilter can read and write compressed files, using the zip, gzip and bzip2 compression formats. The compression and decompression is achieved with the boost-iostream library. Practically, the use of compressed files has very little impact on the memory usage or com-putation speed while reducing considerably the amount of disk space. At the time of writing, the amount of publicly available parsers for MAF files is rather limited. The cor-responding classes in the Python language have not yet integrated the stable branch of the BioPython libraries. In order to assess the performance of the Bio++ parser, we therefore compare it to the BioPerl library. The resulting perl script (see Additional file 1) parses the compressed MAF file and outputs for each alignment block with more than a thousand sites the number of sequences, the length of the alignment and the coordinates of the sequence of one species if represented in the alignment block. This simple pipeline allows to directly compare the efficiency of
Dutheil et al. BMC Genomics 2014, 15:53 Page 5 of 10 http://www.biomedcentral.com/1471-2164/15/53
Figure 3 Example option file. The MafFilter program is controlled via options with format key=value that can be passed directly as argument of the program or stored into a parameter file. The simple parameter file exemplified here generates the pipeline depicted on Figure 2.
the parsers themselves, as the only computations required are file reading, as well as allocation and initialization of the dedicated structures for storing data into memory. The corresponding MafFilter option file is provided in
the example directory of the distributed source code. To compare the two approaches, we used the 46 vertebrates alignment of Human chromosome 22 downloaded from UCSC [8] as input data, and ran the analyses on a linux
Table 1 Available filters
Filter name MafIterator class Characteristics
Data extraction
Subset SequenceFilterMafIterator Extract alignments for a given set of species,
filter duplicates.
Merge BlockMergerMafIterator Merge consecutive blocks if they are
syn-tenic.
Concatenate ConcatenateMafIterator Concatenate consecutive blocks up to a
given length, regardless of coordinates.
XFullGap FullGapFilterMafIterator Remove gap positions for a given ingroup.
FeatureFilter FeatureFilterMafIterator Remove regions from a given feature file.
ExtractFeature FeatureExtractor Remove regions outside the ones specified
in a given feature file.
SelectChr ChromosomeMafIterator Extract alignments from a given
chromo-some. Block filtering
MinBlockLength BlockLengthMafIterator Remove alignment blocks with too little
sites.
MinBlockSize BlockSizeMafIterator Remove alignment blocks with too little
sequences. Sliding window-based alignment processing
AlnFilter AlignmentFilterMafIterator
⎫ ⎬
⎭Remove ambiguously aligned regions.
AlnFilter2 AlignmentFilterMafIterator2
EntropyFilter EntropyFilterMafIterator Remove highly variable regions.
MaskFilter MaskFilterMafIterator Remove masked regions.
QualityFilter QualityFilterMafIterator Remove regions with low quality.
Statistical analysis
WindowSplit WindowSplitMafIterator Split blocks into windows of given size.
SequenceStatistics SequenceStatisticsMafIterator Compute a user-defined selection of
statis-tics, such as character frequencies, alignment size and length, frequency spectrum, counts of fixed vs. polymorphic sites and pairwise divergences. Results are output to a CSV file together with block coordinates for subse-quent analysis.
DistanceEstimation (several classes)a Estimate distance matrix between species.
DistanceBased-Phylogeny
DistanceBasedPhylogeny-ReconstructionMafIterator
Reconstruct block-wise phylogenies using distance-based methods (W/UPGMA, Neigh-bor joining, BioNJ)
NewOutgroup NewOutgroupMafIterator Reroot a block-wise phylogenetic tree
according to a given species.
DropSpecies DropSpeciesMafIterator Remove leaves from block-wise trees for a
given species. Output
Output OutputMafIterator Write blocks to a file in MAF format.
OutputAlignments OutputAlignmentMafIterator Write blocks into an alignment file, for
instance Fasta or Clustal, using Ensembl syntax for storing coordinates.
OutputTrees OutputTreeMafIterator Write associated trees to a Newick file.
VcfOutput VcfOutputMafIterator Call SNPs for each block and write them in a
VCF file [17].
Dutheil et al. BMC Genomics 2014, 15:53 Page 7 of 10 http://www.biomedcentral.com/1471-2164/15/53
Table 2 Available statistics
Statistic name MafStatistic class Characteristics
Block structure
BlockLength BlockLengthMafStatistics Report the alignment length of each block.
SequenceLength SequenceLengthMafStatistics Report the number of nucleotides of a given species in each block.
BlockSize BlockLengthMafStatistics Report the number of sequences in each block.
AlnScore AlignmentScoreMafStatistics Report the alignment score for each block, if any.
Block content
BlockCounts CharacterCountsMafStatistics Compute the frequency of each character in each
block.
SiteStatistics SiteMafStatistics Compute site-base statistics: number of sites without
gap, number of complete sites (no gap, no unresolved character), number of parsimony-informative sites in each block.
Population genetics
PairwiseDivergence PairwiseDivergenceMafStatistics Compute the sequence dissimilarity between two individuals.
PolymorphismStatistics PolymorphismMafStatistics Compare two groups of sequences, and compute the number of fixed/polymorphic sites between and within each group.
DiversityStatistics SequenceDiversityMafStatistics For a given group of sequences, compute the number of seggregating sites and Watterson’s theta. SiteFrequencySpectrum SiteFrequencySpectrumMafStatistics Compute the (unfolded) frequency spectrum for a
given group of sequences.
CountClusters CountClustersMafStatistics Compute the number of haplotype groups, given a
certain mutation threshold, providing a tree has been previously computed.
workstation (Intel(R) Xeon(R) CPU E5520 @ 2.27GHz, with 16Gb of RAM running Ubuntu 12.04). The com-plete parsing takes 30 minutes with the BioPerl script while it completes in only 3 minutes with MafFilter. Maf-Filter was used to analyse the complete Gorilla genome aligned with other Primates (2Gb alignment) [9], as well as resequencing data of 27 individual genomes from the fungus Zymoseptoria pseudotritici (40Mb alignment, E. Stukenbrock, pers. communication).
Results
Approximate the ancestral recombination graph with 1kb windows
We downloaded the 46 vertebrate genome alignment from UCSC [8] and built a pipeline in order to infer underly-ing sequence genealogy along the genome (Figure 2). The tasks performed by MafFilter involved: (1) extracting the Primate sequences (Human, Chimp, Gorilla, Orangutan and Macaque), (2) merging syntenic blocks in Primates, (3) removing gap positions in each block, (4) cutting the resulting alignment into windows of 1kb with no syn-teny break and (5) computing a distance tree with Kimura distance [10] in each window. The analysis of chromo-some 1, the largest alignment, completed in 30 minutes. The memory consumption increased at the start of the
program execution, and was stable during the whole fil-tering, reaching a maximum value of 4,850kB (as mea-sured by the maximum resident set size, see Additional file 2). The output file contained 3,591 trees (one for each window). Among those trees, 613 grouped Human and Gorilla and 547 grouped Chimpanzee and Gorilla as the closest relatives leading to an estimate of 32% incom-plete lineage sorting. This value is very similar to what was reported using more advanced modelling on the same data set [9].
Extract homologous regions of a gene set
We analysed the multiple alignment of the fungus
Zymoseptoria tritici (synonym Mycosphaerella
gramini-cola) aligned with 12 genomes of three closely related species [11]. We extracted all sequences homologous to the reference gene set from Z. tritici, containing 28,314 exons. MafFilter extracted all features where at least one homologue was found and output the resulting align-ments in a file with Clustal format. General statistics such as the number of homologues found were also com-puted. The full analysis completed in less than five min-utes and used 30MB of memory (See Additional file 2). The pipeline extracted 24,932 exons, of which 24,514 had at least one homologue in another genome, and 20,268
were shared by all the 13 aligned genomes. We report a highly significant positive correlation between the exon length and number of homologous exons (Figure 4, Kendall’s τ = 0.133, p-value < 2.2e-16) suggesting that isolate/species-specific genes tend to be shorter. Among short genes are the so-called effector genes which play a role in pathogenicity by manipulating the host defence and metabolism. This result is therefore consistent with a high dynamics and specificity of the effector gene repertoire.
Extract all non-coding regions from a single genome
In this example, a Fasta file containing all chromosome sequences of the fungus Ustilago maydis [12,13] was imported and compared to a GFF3 annotation file con-taining all protein coding genes [14]. Fasta import is enabled in MafFilter providing that the sequences are comprehensive, that is, all contig data start at nucleotide position 1. In this pipeline all gene sequences defined in the GFF files were removed. The resulting blocks were then filtered to keep only regions greater than 300 bp, and were written in a gzip-compressed MAF file. Statistics (block length, nucleotide composition) were also com-puted on the resulting blocks. The program completed in 18 minutes, used a maximum of 86MB of memory
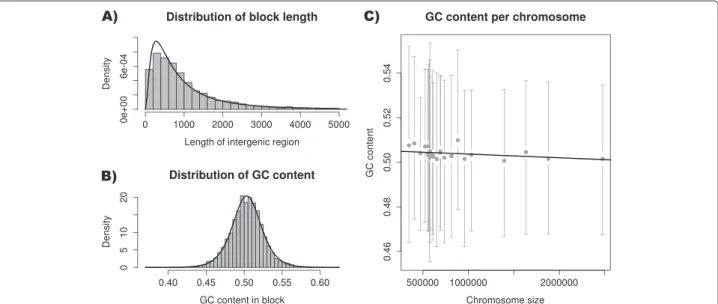
(See Additional file 2) and output 5,487 blocks of inter-genic regions. The global distribution of interinter-genic region lengths was well fitted by a log-normal distribution with mean 6.542, corresponding to an intergenic length of 694bp (Figure 5). The GC content followed a logistic dis-tribution with location 0.503 and scale 0.012, revealing a homogeneous GC content along the genome. GC con-tent, however, was weakly – yet significantly – negatively correlated with chromosome size (Figure 5, Kendall’s
τ = -0.034, p-value = 0.0002603). Such a correlation is expected if GC-biased gene conversion is at stake since smaller chromosomes have a higher average recombina-tion rate and therefore a higher GC-content equilibrium [15].
Conclusion
Integrated analysis of large genome alignments is a com-putational challenge for today’s comparative and evolu-tionary genomics research and its importance is expected to grow in the near future. We have introduced here the MafFilter program that allows the easy and efficient anal-ysis of such data. The program is highly parametrizable and allows to perform a broad range of analyses and data processing on MAF files. In addition, the components of the underlying parsers and methods are available as
Figure 4 Zymoseptoria tritici exon length. Exon length plotted as a function of the number of strains for which a homologous exon is found. Grey points and bars represent the observed means and the 2.5 and 97.5% quantiles of the observed distributions, respectively. The solid line is the estimated regression line.
Dutheil et al. BMC Genomics 2014, 15:53 Page 9 of 10 http://www.biomedcentral.com/1471-2164/15/53
Figure 5 Ustilago maydis intergenic regions. A) Distribution of the length of intergenic regions in the U. maydis genome (histogram) with the corresponding fit of a log-normal distribution (solid line). B) Distribution of GC content in intergenic regions (histogram) with the corresponding fit of a logistic distribution (solid line). C) GC content plotted as a function of chromosome size. Grey points and bars represent the observed means and the 2.5 and 97.5% quantiles of the observed distributions, respectively. The solid line is the estimated regression line.
an object-oriented library, facilitating the implementation and integration of new analysis tools. As it reads and outputs standard formats, the MafFilter software is a pow-erful complement of existing genomic tools such as the SAMTools [16] and VCFTools [17].
Availability and requirements MAF parser and filters
Project name:MafFilter
Project web site:http://bioweb.me/maffilter
Operating systems: all for which a C++ compiler is available, including GNU/Linux, MacOS and Windows Programming language:C++
Compiler:gcc 3.4 and higher versions
Other requirements: the C++ standard library, the core, seq, phyl, seq-omics and bpp-phyl-omics libraries from Bio++ (available at http:// bioweb.me/biopp), the boost-iostreams library (available at http://www.boost.org/users/download/).
License: open source software distributed under the GPL-compatible CeCILL version 2.0 license.
The MAF parser and analysis filters (see Table 1) are available through the Bio++ libraries bpp-seq-omics and
bpp-phyl-omics [6]. The bpp-seq-omics library contains the parser sensu stricto and the sequence based analysis tools, while the bpp-phyl-omics provides more advanced computational tools such as phylogenetic reconstruction methods. The documentation of the application program-ming interface (API) is available online on the Bio++ website
at http://bioweb.me/biopp/articles/documentation/. The API is generic and enables the user to use the parser in his/her own software. It also allows the implementation and combination of new filters with the existing ones. A complete manual (PDF and HTML) is available from the MafFilter website, which describes all available options. Example application files are distributed along with the program.
Additional files
Additional file 1: BioPerl script using the SeqIO:Maf parser. Additional file 2: CPU and memory usage during the execution of MafFilter for the three example pipelines.
Competing interests
The authors declare that they have no competing interests.
Authors’ contributions
JYD, SG and EHS designed the software. JYD and SG implemented the algorithms and developed the software. JYD and EHS wrote the manuscript. All authors read and approved the final manuscript.
Acknowledgements
Kasper Munch is acknowledged for his help on an earlier version of this program.
Funding
JD acknowledges the LOEWE-Zentrum für Synthetische Mikrobiologie (Synmikro) for funding. EHS acknowledges the Max Planck Society for funding. This publication is the contribution no. 2014-004 of the Institut des Sciences de l’Évolution de Montpellier (ISE-M).
Author details
1Max Planck Institute for Terrestrial Microbiology, Department of Organismic Interactions, Marburg, Germany.2Université Montpellier 2, CNRS UMR 5554, Institut des Sciences de l’Evolution de Montpellier, Place E. Bataillon,
Montpellier 34095, France.3INRA, UMR 1345 Institut de Recherche en Horticulture et Semences, SFR 4207 QUASAV, Angers F-49045, France. 4Agrocampus Ouest, UMR 1345 Institut de Recherche en Horticulture et Semences, SFR 4207 QUASAV, Angers F-49045, France.5Université d’Angers, LUNAM Université, UMR 1345 Institut de Recherche en Horticulture et Semences, SFR 4207 QUASAV, Angers F-49045, France.6Max Planck Institute for Terrestrial Microbiology, Fungal Biodiversity Group, Marburg, Germany. Received: 8 August 2013 Accepted: 16 January 2014
Published: 22 January 2014
References
1. Kent WJ, Sugnet CW, Furey TS, Roskin KM, Pringle TH, Zahler AM, Haussler D: The human genome browser at UCSC. Genome Res 2002,
12(6):996–1006.
2. Blanchette M, Kent WJ, Riemer C, Elnitski L, Smit AFA, Roskin KM, Baertsch R, Rosenbloom K, Clawson H, Green ED, Haussler D, Miller W: Aligning
multiple genomic sequences with the threaded blockset aligner.
Genome Res 2004, 14(4):708–715.
3. Kiełbasa SM, Wan R, Sato K, Horton P, Frith MC: Adaptive seeds tame
genomic sequence comparison. Genome Res 2011, 21(3):487–493.
4. Dutheil JY, Hobolth A: Ancestral population genomics. Methods Mol
Biol (Clifton, N.J.) 2012, 856:293–313.
5. Dutheil J, Boussau B: Non-homogeneous models of sequence
evolution in the Bio++ suite of libraries and programs. BMC Evol Biol
2008, 8:255.
6. Guéguen L, Gaillard S, Boussau B, Gouy M, Groussin M, Rochette NC, Bigot T, Fournier D, Pouyet F, Cahais V, Bernard A, Scornavacca C, Nabholz B, Haudry A, Dachary L, Galtier N, Belkhir K, Dutheil JY: Bio++: efficient
extensible libraries and tools for computational molecular evolution. Mol Biol Evol 2013, 30(8):1745–1750.
7. Dutheil J, Gaillard S, Bazin E, Glémin S, Ranwez V, Galtier N, Belkhir K:
Bio++: a set of C++ libraries for sequence analysis, phylogenetics, molecular evolution and population genetics. BMC Bioinformatics
2006, 7:188.
8. UCSC genome browser. Downloaded from [http://hgdownload.soe.
ucsc.edu/goldenPath/hg19/multiz46way/maf]. [Last accessed November 6th, 2013].
9. Scally A, Dutheil JY, Hillier LW, Jordan GE, Goodhead I, Herrero J, Hobolth A, Lappalainen T, Mailund T, Marques-Bonet T, McCarthy S, Montgomery SH, Schwalie PC, Tang YA, Ward MC, Xue Y, Yngvadottir B, Alkan C, Andersen LN, Ayub Q, Ball EV, Beal K, Bradley BJ, Chen Y, Clee CM, Fitzgerald S, Graves TA, Gu Y, Heath P, Heger A, et al.: Insights into hominid evolution from
the gorilla genome sequence. Nature 2012, 483(7388):169–175.
10. Kimura M: A simple method for estimating evolutionary rates of base
substitutions through comparative studies of nucleotide sequences. J Mol Evol 1980, 16(2):111–120.
11. Stukenbrock EH, Bataillon T, Dutheil JY, Hansen TT, Li R, Zala M, McDonald BA, Wang J, Schierup MH: The making of a new pathogen: insights
from comparative population genomics of the domesticated wheat pathogen Mycosphaerella graminicola and its wild sister species.
Genome Res 2011, 21(12):2157–2166.
12. Kämper J, Kahmann R, Bölker M, Ma LJ, Brefort T, Saville BJ, Banuett F, Kronstad JW, Gold SE, Müller O, Perlin MH, Wösten HAB, de Vries R, Ruiz-Herrera J, Reynaga-Peña CG, Snetselaar K, McCann M, Pérez-Martín J, Feldbrügge M, Basse CW, Steinberg G, Ibeas JI, Holloman W, Guzman P, Farman M, Stajich JE, Sentandreu R, González-Prieto JM, Kennell JC, Molina L, et al.: Insights from the genome of the biotrophic fungal
plant pathogen Ustilago maydis. Nature 2006, 444(7115):97–101.
13. MIPS Ustilago maydis Database. Downloaded from [ftp://ftpmips.gsf. de/fungi/Ustilago_maydis/]. [Last accessed November 6th, 2013]. 14. Ustilago maydis PEDANT database. Generated from [http://pedant.
helmholtz-muenchen.de/pedant3htmlview/pedant3view?Method= analysis&Db=p3_t237631_Ust_maydi_v2]. [Last accessed November 6th, 2013].
15. Duret L, Eyre-Walker A, Galtier N: A new perspective on isochore
evolution. Gene 2006, 385:71–74.
16. Li H, Handsaker B, Wysoker A, Fennell T, Ruan J, Homer N, Marth G, Abecasis G, Durbin R, 1000 Genome Project Data Processing Subgroup:
The sequence alignment/map format and SAMtools. Bioinformatics
2009, 25(16):2078–2079.
17. Danecek P, Auton A, Abecasis G, Albers CA, Banks E, DePristo MA, Handsaker RE, Lunter G, Marth GT, Sherry ST, McVean G, Durbin R, 1000 Genomes Project Analysis Group: The variant call format and VCFtools.
Bioinformatics 2011, 27(15):2156–2158.
doi:10.1186/1471-2164-15-53
Cite this article as: Dutheil et al.: MafFilter: a highly flexible and extensible
multiple genome alignment files processor. BMC Genomics 2014 15:53.
Submit your next manuscript to BioMed Central and take full advantage of:
• Convenient online submission • Thorough peer review
• No space constraints or color figure charges • Immediate publication on acceptance
• Inclusion in PubMed, CAS, Scopus and Google Scholar • Research which is freely available for redistribution
Submit your manuscript at www.biomedcentral.com/submit