HAL Id: hal-02497337
https://hal.archives-ouvertes.fr/hal-02497337
Submitted on 3 Mar 2020HAL is a multi-disciplinary open access
archive for the deposit and dissemination of sci-entific research documents, whether they are pub-lished or not. The documents may come from teaching and research institutions in France or abroad, or from public or private research centers.
L’archive ouverte pluridisciplinaire HAL, est destinée au dépôt et à la diffusion de documents scientifiques de niveau recherche, publiés ou non, émanant des établissements d’enseignement et de recherche français ou étrangers, des laboratoires publics ou privés.
Numerical simulations of magmatic enclave deformation
Alain Burgisser, Alexandre Carrara, Catherine Annen
To cite this version:
Alain Burgisser, Alexandre Carrara, Catherine Annen. Numerical simulations of magmatic enclave deformation. Journal of Volcanology and Geothermal Research, Elsevier, 2020, 392, pp.106790. �10.1016/j.jvolgeores.2020.106790�. �hal-02497337�
1
Numerical simulations of magmatic enclave deformation
Alain BURGISSER
1*, Alexandre CARRARA
1, Catherine ANNEN
11
Univ. Grenoble Alpes, Univ. Savoie Mont Blanc, CNRS, IRD, IFSTTAR, ISTerre,
38000 Grenoble, France.
Abstract: 330 words, Main text: 6900 words, 10 Figures, 2 Tables, 73 references.
* Corresponding author: Phone: (+33) 479 758 780. Fax: (+33) 479 758 742. Email:
[email protected]
2
Abstract
Present in both plutonic and volcanic rocks, enclaves are inclusions of magma into a compositionally distinct magmatic host. Classical links between their shapes and the dynamical conditions that prevailed during their formation have been drawn from fluid–fluid analogies and from solid rock mechanics. Magmas, however, are hydrogranular suspensions with a rheology distinct from these two-end-members. This work presents results from computational fluid dynamics with discrete element modeling (DEM) aimed at deforming crystal-rich enclaves in pure shear. The CFD-DEM approach explicitly resolves solid–solid interactions such as contact and friction while taking into account fluid coupling. The first series of deformation involved only pure fluids to validate the setup. The second series comprised seven runs aimed at reproducing magmatic conditions. Enclaves were made of a cylindrical suspension of particles embedded into a host with different characteristics. In both media, particles and fluids had densities, viscosities, elastic characteristics, and sizes tailored to the geological constraints of the Adamello batholith, Italy. Each run corresponds to a temperature along the two respective crystallization paths and span crystal contents from 10 to 62 vol.%. Results show that, to first order, deformation does not depend on differences in melt viscosities, crystal contents, or bulk viscosity contrast. This is due to the formation of force chains parallel to the main compression direction, which transmits stress across the enclave. A simple, first-order relationship could be fitted to our data to relate shear and enclave deformation, which we applied to the case of the Adamello pluton. There is a second-order dependence of deformation on the onset of particles contacts and force chains, which are both related to particle concentration. The main control of these second-order effects lies in the host crystal content. Enclave particles pack early, quickly erasing differences in initial content and building force chains parallel to the compression axis that transmit stresses to the host. Whether the host is able to transmit those stresses across its own volume is controlled by host crystal content.
3
Keywords:
pluton, magma chamber, Adamello batholith, viscosity contrast, CDF-DEM, force chains.4
1. Introduction
Ubiquitous in both plutonic and volcanic rocks, enclaves are inclusions of partially to wholly crystallized magmas hosted in a generally more silicic magma (e.g., Didier and Barbarin, 1991; Paterson et al., 2019). These compositionally defined structures present a large variety of shapes and sizes, and have been long suspected to record dynamical information on the conditions that prevailed during their formation (Vernon et al., 1988; Paterson et al., 1989). In early subsolidus (plutonic) rock studies, the deformation of a solid inclusion hosted in a softer matrix was not only studied using solid mechanics (e.g., Pfiffner and Ramsay, 1982), but also by using pure fluids (e.g., Bilby et al., 1975; Gay, 1976; Lisle et al., 1983). More recently, deformation studies have used mixtures with bulk non-Newtonian rheologies (e.g., Treagus, 2002; Jessell et al., 2009; Marques et al., 2014, and references therein). In hypersolidus conditions, which are relevant to magmatic systems, modeling enclave deformations by using the analogy of two fluids has also been used (e.g., Williams and Tobisch, 1994; Caricchi et al., 2012; Laurent et al., 2017). Magmas, however, are inherently multiphase mixtures of melt, crystals and possibly gas bubbles. The presence of at least two phases (two miscible melts and crystals of various sizes, shapes and chemical composition) motivated experiments using particle-laden fluids (Hodge and Jellinek, 2012; Hodge et al., 2012). Such experiments showed that streams of suspensions flowing into a clear fluid break up and deform under the combined effects of buoyant ascent and shear in more complex ways than a simple fluid.
The detailed process of enclave formation is highly dynamic as it involves thermal exchange, crystallization, possible gas exsolution, and possible mechanical mixing between the melts and/or the host and inclusion minerals (e.g., Coombs et al., 2000; De Campos et al., 2004; Laumonier et al., 2014; Petrelli et al., 2016; Wiesmaier et al., 2015). Even when leaving aside the roles of volatiles and crystallization, the rheology of crystal-bearing magmas is generally complex because of the feedback between melt–crystal entrainment, crystal–crystal friction and collision, and intermittent lock-up of
5
crystals in contact with each other (e.g., Bergantz et al., 2017). This complexity motivated first-order estimates of enclave formation and deformation that distinguish three broad classes of behavior at high melt viscosity, when crystal settling is unimportant (Andrews and Manga, 2014). If their crystal content are low (e.g., <20 vol.%), enclaves deform as Newtonian fluid mixtures. At intermediate crystal content (e.g., 20–40 vol.%), enclaves deform only if the inclusion yield stress is overcome. Yield stress, as applied to a magma suspension, is a bulk characterization of the lock-up of the crystal network, which is controlled to first order by a combination of crystal content, shape, and solid friction. At higher crystal content, enclaves act as rigid bodies because the crystals are in permanent state of jamming and the melt forms a partly disconnected network.
Here, we take the simplified view of documenting the mechanical interaction between thermally equilibrated host and enclave without exsolved volatiles. The main goal of this study is to use recent advances in computational fluid dynamics to refine previous work (Caricchi et al., 2012) done on enclave deformation using the analogy of pure fluids. To keep some consistency with the study of Caricchi et al. (2012), we use the geological constraints of the Adamello batholith, which is an Alpine intrusion located in Northern Italy that was emplaced incrementally 42 to 31 Ma ago (John and Blundy, 1993; Schaltegger et al., 2009; Fiedrich et al., 2017). We explore how crystal-rich enclaves deform under planar strain and pure shear thanks to computational fluid dynamics with discrete element modeling (CFD-DEM). Such type of numerical simulations have proven to be a powerful tool to study crystal-rich magma dynamics (Bergantz et al., 2017, 2015; Schleicher et al., 2016; Carrara et al., 2019). The behavior of the continuous fluid phase (silicate melt) is computed by solving the Navier-Stokes equations on an Eulerian grid. Individual crystals are represented by spheres, the trajectories of which are computed in a Lagrangian framework with the Newton laws of motion. This representation of the solid phase allows the CFD-DEM framework to explicitly resolve solid/solid interactions such as contact and friction while taking into account the coupling with the surrounding fluid (Trulsson et al., 2012). Approximating crystals as spheres, however, is a limitation
6
because the anisotropy of natural crystals can either induce jamming at lower particle volume fraction compared to spheres, or ease deformation by strain localization due to crystal alignment (e.g., Cimarelli et al., 2011; Picard et al., 2013; Mader et al., 2013; Moitra and Gonnermann, 2015). Our spherical approximation can thus be applied to equant crystals such as quartz or olivine but fails to capture the behavior of elongated crystals such as plagioclase microlite. In dilute conditions, significant particle elongation can also affect settling because drag forces are non-uniform around crystals (Dioguardi et al., 2014; Bergantz et al., 2017). This is not a concern in this study because settling is inconsequential.
2. Methods
We performed CFD-DEM numerical simulations by using the MFIX-DEM software (https://mfix.netl.doe.gov/). The equations are summarized in the supplementary material (Tables S1-S2). Detailed explanations about the theory and implementation of the model can be found in Garg et al. (2010), Syamlal (1998), Syamlal et al. (1993), and validation of the DEM approaches in Garg et al. (2012) and Li et al. (2012).
As the flows simulated are in the laminar regime and the particle Reynolds numbers are also well below the transition to turbulence (Furuichi and Nishiura, 2014), the drag forces exerted by the fluid on the particles as well as gravity forces were calculated using an analytical simplification instead of the usual numerical evaluation (Garg et al., 2012). The reason behind this algorithmic modification can be understood by considering the equation of motion for the solids in the absence of particle contacts: 𝑑 𝑣⃗⃗⃗⃗ 𝑝 𝑑𝑡 = − ∇𝑃 𝜌𝑝+ 𝑔 + 𝛽 𝛷 𝜌𝑝(𝑣⃗⃗⃗⃗ − 𝑣𝑓 ⃗⃗⃗⃗ ), 𝑝 (1)
where 𝑣⃗⃗⃗⃗ is the particle velocity vector, 𝑣𝑝 ⃗⃗⃗⃗ is the fluid velocity vector, ∇𝑃 is the local fluid pressure 𝑓
7
coefficient, and 𝑔 is the gravitational acceleration vector. The first term on the right hand side of Eq. (1) is the pressure force, which includes the particle buoyancy. The last term expresses the drag force that depends on the relative motion of the particle compared to the fluid, and on the momentum transfer coefficient, which is parameterized using the Gidaspow drag model (Gidaspow, 1994). In crystal-rich conditions, inertial effects may be neglected, and 𝛽 reduces to a form of Kozeny-Carman relationship (Li et al., 2012):
𝛽 =(1−𝛷) 𝑑150 𝛷2 𝜂
𝑝2, (2)
where 𝜂 is the fluid dynamic viscosity and 𝑑𝑝 is the particle diameter. Similarly to Bergantz et al. (2017), it is convenient to define the particle viscous response time, 𝜏𝑣= 𝛷 𝜌𝑝/𝛽, as the ratio of the
particle density times the crystallinity, over the momentum transfer coefficient. The classical numerical method used to integrate in time Eq. (1) imposes to use time steps smaller than 𝜏𝑣, which is a strong limitation to the application of such method to crystal-rich magmas (for chemically evolved and crystal-bearing magmas, 𝜏𝑣≈ 10−10 s). At low particle Reynolds number and Stokes number, 𝜏𝑣
is much smaller than the fluid characteristic time, which means that the fluid velocity and pressure gradient within Eq. 1 may both be considered constant during the particle acceleration in response to a change in its environment. Consequently, Eq. (1) reduces to a first-order ordinary differential equation with a solution of the form:
𝑣 𝑝(𝑡) = 𝑣 𝑝0𝑒 −𝑡 𝜏𝑣− [𝑣 𝑓+ 𝜏𝑣(𝑔 +∇𝑃 𝜌𝑝)] (1 − 𝑒 −𝑡 𝜏𝑣) , (3)
where 𝑣 𝑝0 is the initial particle velocity vector. The effective force, 𝐹 𝐺𝑃𝐷, needed to get from the velocity at time 𝑡1 to that a DEM time step, ∆𝑡, later is:
𝐹 𝐺𝑃𝐷(𝑡1) = 𝑚𝑝
∆𝑡 (𝑣 𝑝(𝑡1+ ∆𝑡) − 𝑣 𝑝(𝑡1)). (4)
8
𝐹 𝐺𝑃𝐷(𝑡1) = 𝑚𝑝 ∆𝑡 [𝑣 𝑓(𝑡1) − 𝑣 𝑝(𝑡1) + 𝜏𝑣(𝑔 − ∇𝑃(𝑡1) 𝜌𝑝 )] (1 − 𝑒 −∆𝑡 𝜏𝑣). (5)Equation (5) presents the advantage to depend on the simulation time step and does not have to comply with a stability criterion. When ∆𝑡 ≫ 𝜏𝑣, Eq. (5) yields the force needed to reach the particle
terminal velocity in one time step, and when ∆𝑡 < 𝜏𝑣, it is able to recover the particle acceleration curve. As a result, the DEM time steps are far larger than those stemming from the classical numerical integration of Eq. (1), which significantly decreases the computational costs. By capturing the particle acceleration curve, our approach builds on that used in Furuichi and Nishiura (2014), which assumes that particles systematically jump to their terminal velocities in one time step.
The first type of runs is two-dimensional compression of a flat cylinder, which corresponds to planar strain. The second type is uniaxial compression of an ellipsoid, which corresponds to pure shear where the material is free to expand in any direction perpendicular to the compression axis. The cross-shaped computational domains of both geometries are depicted in Fig. 1. Planar strain was imposed to an enclave positioned in the middle of the cross by imposing an incoming fluid velocity on two opposite extremities of the cross (inlets) and letting the fluid flow out at the two other extremities (outlets) (Fig. 1A). The computational domain contains 120×120×3 fluid cells with an edge length of 1 cm. The inlet and outlet aperture is 40 cm in all runs except two runs that were carried out with a 80-cm aperture to quantify how aperture size affect large deformations. The geometry of pure shear compression is that of classic uniaxial test with a square horizontal cross-section (Fig. 1B). The domain contains 120×120×120 fluid cells and the fluid was free to flow at the mid-section periphery. Inlets and outlets apertures are 60 cm wide.
In both geometries, all walls are free slip with respect to the fluid and act as a frictional material with respect to the particles. The vicinities of the fluid inlets and outlets are particle-free and the shapes of both the inlet and outlets ducts ensure that the flow field around the enclave corresponds to that expected from pure shear. The boundary condition at both outlets is free pressure and velocity,
9
which yield numerically stable solutions because there is a continuous outflow of material through these outlets. The cuboid region in the center of the cross is subject to a hyperbolic flow field when a single fluid of uniform density and viscosity is used (e.g., Mulchrone and Meere, 2015). Gravity is directed in the negative z direction so that the symmetry of the planar shear flow field is not disturbed by the hydrostatic pressure gradient. Under uniaxial deformation, setting a standard gravity field of 9.81 m/s2 would perturb the symmetry of the imposed pure shear because of the outflow condition in
the gravity direction and because the melt is Newtonian. In the coldest, most viscous magmas, the response times of the crystals (i.e. their diameter divided by their terminal fall velocity) are much longer than typical run durations (2–10 s). They are, however, on the order of 30 minutes for the hotter case we simulate (1030 °C with only 9 vol.% crystals in the host). To prevent gravity-driven particle drainage during uniaxial compression, we thus used a reduced but finite gravity field (10-3
m/s2) in the z direction. Setting gravity to zero would yield similar results at the expense of tedious
changes in model implementation.
Particles sizes and number proportions are summarized in Table 1. The Hertzian collision model was chosen for the particles and the walls. Particles have a Young modulus of 2 MPa, a Poisson ratio of 0.27, a Coulomb friction coefficient of 0.32, a normal damping coefficient of 0.7 and a tangential damping coefficient of 0.35. The Young modulus is lower than that expected for real crystals to ensure reasonably large time steps while avoiding unrealistic particle overlaps and keeping dynamic verisimilitude (Lommen et al., 2014). Wall characteristics are identical to those of particles, except that the Poisson ratio is set to 0.2. Setting smooth walls (zero friction) or changing their Poisson coefficient did not influence results. Pure fluid was injected in the inlets at the same velocities normal to the x-z plane but in opposite directions to push the particle-laden host fluid into the inlets shafts. At the inlets, the injection superficial velocities were 0.05 m/s for all runs, which yields a shear rate of 0.05 s-1. We checked that lowering this speed by factors of 2 and 10 did not change the results.
10
fluid velocity gradients in the z direction of planar strain runs were <10-8 m/s.
The enclave was initialized by setting the fluid cells with the relevant melt density and viscosity. A scalar field advected by the fluid was used to distinguish the enclave melt from the host melt. The initial positions of the enclave particles were defined in two stages. First, randomly distributed particles were settled in a 20×20×3 cm fluid-free tank. Then, a 20-cm cylinder of particles was extracted from the resulting dense, cuboid bed, which formed the densest enclaves (62 vol% particles). Crystal-poor enclaves were built by proportionally expanding the cuboid bed in the x-y directions and extracting the particles fitting into the 20-cm cylinder of particles. The uniaxial sphere was generated by accumulating slices of the cylindrical enclave expanded in an isotropic way to reach a 20-cm diameter. The ensuing artificial particle alignment was no longer visible after the first recorded time step because of particle rearrangement under strain. The host particles were initialized in a similar fashion by using a 120×120×3 cm settled bed and subtracting particles that overlap with the walls and the enclaves. Planar strain runs had typically 7-8 particles in the z direction, which ensured that particles were free to rearrange themselves in 3D so that steric effects were properly captured.
Results are reported in enclave shape ratio (major semi-axis X divided by minor semi-axis Y). Shapes were obtained in Paraview visualization software by imaging the trace of a thresholded interpolation surface of the parameters of interest on an x-y plane located in the domain mid-thickness (z=1.5 cm for planar strain and 60 cm for uniaxial strain). Parameters were fluid volume fraction, fluid viscosity, and particle type (inside vs. outside the enclave). Images were then treated with ImageJ software to fit ellipses on the resulting contours and retrieve shape parameters. All runs were carried out so that the major axis was aligned with the x direction. The imposed amount of shear at time step j, εj, was calculated using:
𝜀𝑗 = ∑ ∆𝑥 𝑥𝑖−1 𝑗
11
where Δx is the distance increment during one recorded time step (0.2 s times 10 cm/s) and x0=40, 60
or 80 cm, which is the edge length of the square region making the center of the cross (Fig. 1). In other words, Δx is the displacement of tracer particles seeded at both inlets, which represent the equivalent of tracking the two moving pistons in a classic uniaxial piston cylinder apparatus.
Six planar strain runs were carried out without particles but with contrasting fluid densities, viscosities, and inlet/outlets widths (Table 2). These runs were used to benchmark our setup and model by recovering an analytical solution of cylindrical ellipse deformation (Bilby et al., 1975):
ln (1+𝜀𝑗
1−𝜀𝑗) = ln 𝑅𝐵+
(1−𝜇)(𝑅𝐵−1)
𝜇(𝑅𝐵+1) (7)
where RB is the theoretical X/Y ratio and μ is the ratio between the host and the enclave viscosities.
Viscosities are those of the melts in particle-free runs and they are bulk viscosities in particle-laden runs. Equation (7) needs to be solved numerically to find RB.
Two other deformation relationships were used to analyze our results. The first is that used by Caricchi et al. (2012):
𝑅𝐶 = (1 + 𝜇𝜀𝑗) 3
(8) The other was proposed by Manga (1996):
𝑅𝑀= exp ( 𝜀𝑗
1+1/𝜇) (9)
One pure shear run was carried out without particles but with contrasting fluid densities and viscosities (930i, Table 2). The analytical solution of an oblate ellipsoid deformation under uniaxial strain reads (Bilby et al., 1975):
ln (1+𝜀𝑗 1−𝜀𝑗) = ln 1 𝑅𝑈+ 2(1−𝜇) 𝜇 [ 1 3− 1−𝛽(1−𝛽2)−1 2⁄ arccos 𝛽 1−𝛽2 ] (10)
12
Seven planar strain runs and one uniaxial run were carried out with particle content, melt viscosities and densities that match the in-situ crystallization paths of magmas having the respective bulk chemical compositions of host and enclaves at Adamello (Table S3; John and Blundy, 1993). Isobaric crystallizations were carried out using the MELTS model in the software PELE (Boudreau, 1999) at 250 MPa and at the Ni–NiO buffer with initial melt water content of 2 wt%. They recover approximately the volume proportions of the two main minerals identified in the host and intrusion at Adamello (Fig. S1). Melt viscosities are calculated in PELE using the model of Giordano et al. (2008) and we calculated bulk viscosities according to Costa et al. (2009).
3. Results
3.1 Pure fluids
Figure 2 shows the ratio between the enclave shapes (X/Y) predicted by Eqs. (7–10) and those measured in particle-free CFD-DEM runs as a function of the viscosity ratio between host and enclave. Under planar strain, all relationships quantify deformation in the same way as our runs when the host viscosity is much smaller than that of the enclave. When the host viscosity is nearing or exceeds that of the enclave, however, relationships differ greatly among themselves and only Eq. (7) is close to our results. Under uniaxial strain, Eq. (10) yields a fit of similar quality as Eq. (7) for planar strain runs. We thus carried out a more detailed comparison between the Bilby et al. (1975) relationship and our pure fluid simulations.
Figure 3 shows the measured deformation of particle-free runs of cylindrical ellipses under planar strain for various host/enclave viscosity ratios as a function of the solution of Eq. (7). Our results follow Eq. (7) at small deformation for all viscosity ratios. When the aperture size of the inlets and outlets is 40 cm, runs depart from Eq. (7) at large deformation, when the extreme edges of the deformed ellipse go from the central part of the domain into the lateral arms of the cross (Fig. 1A). This is because our 40-cm setup is only an approximation of a planar strain velocity field once
13
enclaves are deformed past the central region. This limitation is confirmed by the behavior of the run with 80-cm apertures, which follows Eq. (7) up to X/Y ratios of ~7, when the flattened ellipse can no longer be discretized accurately because its shortest axis is <6 fluid cells. The 40-cm setup thus overestimates elongation compared to the 80-cm setup. This drift at large X/Y values can be corrected for with a second degree polynomial fit (Fig. 3): 𝑅𝐵𝑐𝑜𝑟𝑟 = 0.5 + √0.25 − 2.5(1 − 𝑅𝐵). Keeping such
narrow apertures for most runs, which significantly shortens calculation times, will be justified a posteriori by the fact that all pure fluid relationships, including Eq. (7), greatly overestimate particle-bearing enclave elongation, regardless of aperture size.
3.2 Suspensions
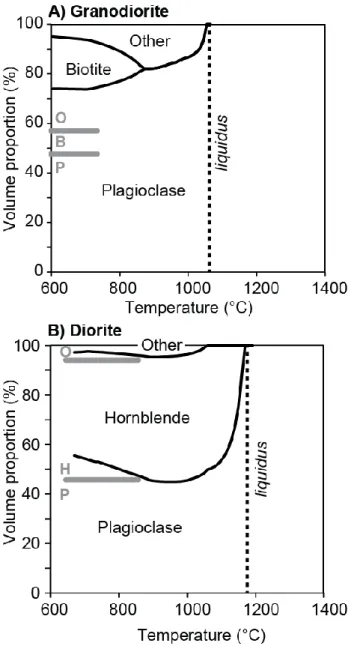
Following Caricchi et al. (2012), we consider that enclave and host material are thermally equilibrated. Run temperatures were chosen to maximize the range of crystal contents of each component within model limits. Our assumption that crystals can be represented as spheres sets a limit to the maximum particle volume fraction we can consider. The maximum packing fraction is highest for bimodal suspension with ~70% coarse particles and ~30% of particles as fine as possible (e.g., Faroughi and Huber, 2014). Unlike Caricchi et al. (2012), we chose to relate crystal content and temperature by using the MELTS model embedded in the PELE software (Fig. 4). This is partly to avoid the water-saturated, crystal-rich end of the cooling paths, which are strongly affected by how gas saturation is handled (open vs. closed system degassing), and partly because PELE recovers well the main mineral proportions found in the natural enclaves (Fig. S1), which ensures a consistency with the particles mixtures we use in the runs.
The two most common minerals found in the Adamello enclaves are 0.5–1 mm grains of K-feldspar and plagioclase and those found in the host granodiorite are plagioclase of 1–3 mm and quartz <2 mm (John and Blundy, 1993). To keep computational times reasonable short, we selected the higher bounds of these grain size estimates. We initialized our hosts with ~4-mm particles and our
14
enclaves with ~30% of dense, 2-mm particles and ~70% of less dense, 4-mm particles (Table 1; Fig. S1). Coarse particles were of two or three slightly different sizes to avoid crystallization effects, such as the spontaneous organization in hexagonal lattice of monodisperse spheres that creates locked-in regions. The maximum particle content in the enclaves is ~62 vol%, which sets the lowest bound of temperature to 820 °C (Table 2). The maximum temperature was set to 1030 °C with a host close to a particle-free suspension with <10 vol% crystals. The resulting bulk viscosity ratios cover many orders of magnitude, spanning from 10-7 to 1.
A typical run is given in Fig. 5 (3D version in Fig. S2). The maximum deformation is limited to ε10=0.7 to ensure that the short axis of the deformed ellipse contains at least 6 fluid cells. The fluid
cells being ~2.5 times larger than the coarsest particles, the aliasing causes some enclave particles to be suspended in host melt. The lateral extremities of the enclave sweep host particles during deformation, creating a bulge of host particles at maximum packing.
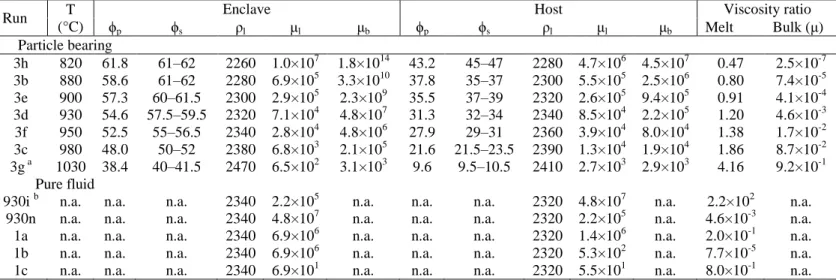
Figure 6 shows the ratio between the enclave shapes (X/Y) predicted by Eqs. (7–10) and those measured in particle-laden CFD-DEM runs as a function of the ratio between the bulk viscosities of the host and the enclave. As with pure fluids, the Bilby et al. (1975) relationship corrected for the geometrical effect of the aperture size recovers best our planar strain results, but with considerable scatter because the predicted values is 1 to 5.8 times larger than the measured values (Fig. 6). The uniaxial predicted deformation using Eq. (10) corrected for the geometrical effect is 1 to 1.5 times larger than the measured values.
We attempted to fit an empirical relationship to our results. We chose that of Caricchi et al. (2012) for its simplicity and adjusted the viscosity ratio, μ, to match our measured deformation. A single value of μ=1.1 recovers the measured values within 21%, regardless of strain geometry (Fig. 6):
𝑅𝐶𝑓𝑖𝑡= (1 + 1.1𝜀𝑗) 3
(11) If, instead, the viscosity ratio of the corrected Bilby et al. (1975) relationships is adjusted, a
15
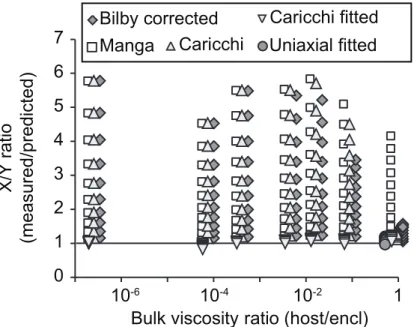
single value of 10 ensures a satisfactory fit. These single-valued factors suggest that, unlike pure fluids, suspension deformation is not a function of the viscosity contrast between host and enclave. This is confirmed by the behavior of X/Y as a function of εj (Fig. 7) because all runs deform in a very
similar fashion, regardless of viscosity ratio or whether the enclaves spread laterally into the arms of the cross-shaped domain (see Fig. 3). The small but visible differences among the curves of Fig. 7 cannot be explained by the fact that the velocity field departs from that of pure shear once enclaves are deformed past the central region or by a simple combination of the parameters summarized in Table 2. This led us to quantify particle contacts in detail.
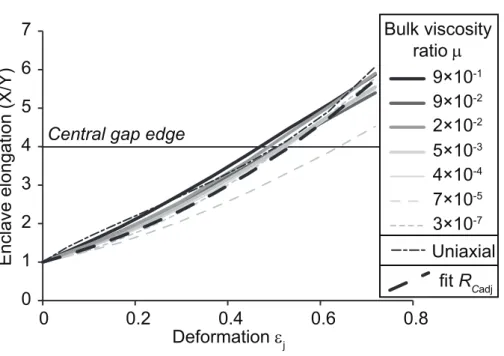
Force chain is a powerful concept to understand how stress is supported by the grains. The chains are quantified by tracking normal forces between each particle pair during deformation. A division between pairs having normal forces above the mean and those featuring forces below the mean can be made, which separates load-bearing particles from spectator particles, respectively (Radjai et al., 1999; Bergantz et al., 2017). As force chains only exist during contact, they give a partial picture of the granular topology because only touching particles are accounted for. This picture can be completed by tracking particle chains thanks to particle overlaps and distinguishing touching particles that make the solid network from floating particles. Figure 8 shows the evolution of load-bearing vs. spectator and of touching vs. floating particles in host and enclave for four representative runs. In enclaves, the proportion of load-bearing particles increases quite sharply for most runs before reaching a plateau, the value of which is commensurate with the magnitude of the bulk viscosity contrast. The number of touching particles decreases gently in all runs but that with the most dilute enclave (41 vol% particles). This crystal-poor enclave has initially many floating particles. They quickly touch each other at the beginning of the deformation and behave similarly to the other enclaves after ε=0.18. Contacts are set earlier in more crystal-rich enclaves. The general decrease of contacts at large ε follows that of crystal content (Fig. 8C). This slight dilution is driven by enclave elongation and the ensuing increase of surface area; enclave particles close to the enclave boundary
16
bear fewer contacts with particles contained in the more dilute host than with other enclave particles. At small deformation, both force and particle chains have a fabric parallel to the main compression direction, spanning enclaves across in response to the imposed stress (Fig. 9). In crystal-rich hosts, this fabric extends into the host at larger deformation, forming chains that cross the host– enclave boundary. As ellipses become more elongated, chains become shorter but are distributed all along the major axis. Crystal-poor enclaves have fewer load-bearing particles compared to crystal-rich ones (Fig. 8B), mostly because crystal-rich enclaves concentrate load bearers along the maximum elongation axis (Fig. 9B). This is likely the result of crowding due to converging flow lines towards the central axis and away from the hyperbolic point (e.g., Mulchrone and Meere, 2015).
Force chains have a more complex behavior in hosts compared to enclave. The proportion of load-bearing either increases or decreases before reaching a plateau that is close to 40% for all runs (Fig. 8A) except that with the bulk viscosity ratio closest to one (μ=0.9). The proportion of touching particles in hosts increases in a logistic fashion; large viscosity contrasts reaching the high plateau earlier than low contrasts (e.g., plateau at ε=0.18 for μ=3×10⁻⁷ vs. plateau at ε=0.5 for μ=2×10⁻²). In
crystal-poor hosts, this behavior results exclusively from the accumulation of host particles at the lateral extremities of the enclave, whereas all particles are subject to crowding in crystal-rich hosts. When bulges reach a sufficiently large distance from the central hyperbolic point, flow lines are nearly parallel to the spreading axis. The bulges and the host particles ahead of them travel then at the same velocity, ending bulge accretion and the associated increase of particles in contact with each other. Force chains are mostly present in the bulges and on the outline of the enclave for all runs. The large number of load-bearing particles in the crystal-poor host is due to the fact that force pairs only occur in the bulges of that run, unlike the others that feature weaker force chains throughout the host. Although their initial accumulation rates differ from run to run, bulges of crystal-rich hosts end up with ~40% load-bearing particles (Fig. 9B), which is simply controlled by the size of the domain compared to that of the bulges.
17
Differences in deformation behavior are thus not simply related to crystal content or bulk viscosity ratio. They are instead controlled by how the solid phase reorganizes itself to transmit stresses. In the host, most of the stress is concentrated in the bulges, which resist enclave elongation. The evolution of bulge resistance depends strongly on host crystal content because bulges are built by sweeping and accumulating host particles until a steady-state shape is reached. In the enclave, maximum compressive stress is accommodated by force chains that extend well into the host if it is crystal-rich enough. The enclave crystal content plays a more minor role compared to that of the host because force chains are quickly established therein when deformation starts, even for crystal-poor enclaves. This dominant role of host crystal content is illustrated by the contrasting behavior of the two runs with the lowest bulk viscosity ratios (μ=3×10⁻⁷ and 7×10⁻⁵), which have the same enclave
crystallinity but differ in host crystallinity (Figs. 7 and 8C).
3.3 Application to a natural case
Our data show that, to first order, enclave deformation under pure shear is not a function of crystal content, whether that of the enclave or that of the host. One immediate implication of this result is that the common assumption that enclave deformation can be approximated as the deformation of two miscible fluids with a bulk viscosity equivalent to that of both crystal-bearing magmas can be revisited. There are two main physical reasons why the fluid-like approximation does not capture the deformation of particle-bearing fluids. The first is the presence of inter-particle contacts that transmit stress through force chains. The second reason is linked to the fact that our enclaves are, by design (the injected magma is assumed more mafic than the host), richer in crystals than the host. As a result, enclave edges sweep crystals, causing differential motion of fluid and particles and accumulating host crystals near the enclave lateral extremities. The semi-empirical Eq. (11) captures enclave deformation and is calibrated by our runs up to a flattening ratio of ~10.
18
information from the deformed enclaves brings the need to define the causes of pure shear. As no significant subsolidus deformation due to tectonics is expected to have occurred (Fiedrich et al., 2017), magmatic foliation, crystal bending, and relatively low amounts of trapped liquid point to late (near-solidus) crystal-melt separation that could have accompanied enclave deformation. This separation could have led to a loss of at most 27% of melt (Fiedrich et al., 2017). Translated into a maximum amount of pure shear, ε, this loss corresponds to ε=0.27×ϕ, where ϕ is the pre-compacted crystal content. Melt extraction being assumed to be most efficient at 0.5<ϕ<0.7 (Dufek and Bachmann, 2010), the corresponding enclave flattening according to Eq. (11) is at most 1.5–1.8, which is far less than the >2 ratios commonly measured on the field (John and Blundy, 1993).
Alternatively (or concurrently), the deformation could be due to the incremental construction of the pluton by repeated injections (John and Blundy, 1993; Caricchi et al., 2012). The relationship between the intrusion of new material inside a pre-existing magma body and the deformation of the surrounding material is a long-standing issue (Pfiffner and Ramsay, 1982; Paterson and Fowler, 1993). The earliest attempts at quantifying deformation were based on sub-spherical plutons growing by ―ballooning‖ (i.e. radial expansion, Johnson et al., 2001), although more recently field evidence suggests a combination of processes (Paterson and Vernon, 1995). Caricchi et al. (2012) modeled the thermal history of the Adamello pluton construction by assuming that the pluton was built by successive injections of magma pulses at a common feeding point. Each injection produces a lateral expansion of the already emplaced magma, deforming it. Each new magma pulse enters the main reservoir with a suspended cargo of roughly spherical, thermally equilibrated enclaves. Recent thermal modeling (Alves et al., 2015) shows that this assumption is justified; 60-cm enclaves cool in typically <2 months while only a couple of weeks is needed for 30-cm enclaves. Such durations are far shorter than that of repeated injections. The radial expansion caused by the repeated injections produce the foliation patterns and the deformation of the enclaves observed in the field.
19
Supplementary Text 1, we extend this geometry by considering also ballooning (Ramsay, 1989; Johnson et al., 2001) and dykes (Annen et al., 2008). As with melt extraction, we combined these injection styles with Eq. (11) to determine enclave flattening by pure (or planar) shear as a function of the distance from the injection point. Figure 10 shows enclave deformation as functions of injection shape and enclave initial position, alongside Adamello data from John and Blundy (1993). This simple model suggests that enclave deformation depend on its initial position before deformation, regardless of intrusion shape.
4. Discussion
Instead of carrying out a systematic parametric study, we only considered cases where host and enclave characteristics (crystal content, melt densities and viscosities) follow natural trends expected when mafic material intrudes a more silicic host. This approach takes advantage of the fact that chemical and phase changes buffer the trends of these physical characteristics, thereby reducing the number of degrees of freedom (e.g., Scaillet et al., 2000; Montagna et al., 2017). As a result, the enclave material had systematically a higher particle volume fraction and a lower melt viscosity than the host. Melt and bulk densities varied from run to run, but are not expected to play a role in deformation dynamics because gravity was perpendicular to the axes of main deformation. Our approach thus leaves many host–enclave combinations aside (e.g., crystal-poor, viscous enclave in a crystal-rich, low-viscosity host), which are interesting from a theoretical standpoint albeit less common in nature. Another limitation is that our simulations are aimed at exploring enclave deformation in planar strain and pure shear, which is one end-member of deformation. Another important end-member is simple shear, which creates a different deformation dynamics involving the rotation of the deformed enclave (e.g., Arbaret et al., 2001; Schmid and Podladchikov, 2004). Simple shear will be the subject of a further study.
20
melt viscosities, crystal contents, or bulk viscosity contrast. This is a strong departure from the behavior of pure fluids, which suggests that the coaxial deformation of rocks changes fundamentally when shifting from subsolidus conditions to the presence of a quantity of melt sufficient to create a non-cohesive magmatic suspension. In magmatic conditions, the semi-empirical Eq. (11) captures enclave deformation and is calibrated by our runs up to a flattening ratio of ~10. Figure 10 extrapolates this relationship up to a ratio of ~60 by considering that enclave deformation is mainly controlled by the formation of force chains parallel to the main compression direction (see below) and that these chains are built continuously along the whole width of the flattening enclave as deformation proceeds. However, except for one outlier at X/Y=19, natural data at Adamello pluton, have X/Y ratios mostly within our calibration values, which justifies our approach. We stress that enclave deformation is an inherently 3D process and that enclave flattening to ratios >50 is uncommon (e.g., Vernon et al., 1988; Didier and Barbarin, 1991).
One implication of our results is that the link between enclave deformation and strain conditions is more direct than previously assumed. We illustrated how this finding impacts our capability to use enclave shape as markers of the emplacement dynamics by revisiting the case of the Adamello pluton. Caricchi et al. (2012) used a thermo-mechanical model to link magmatic strain to deformation by taking into account the rheological differences between mafic enclaves and their host granitic magma as a function of temperature. This dependence to temperature means that they were able to constrain the emplacement time of the Adamello pluton by comparing enclave deformation data to thermally-controlled strain trajectories as a function of time and distance from the magma injection point. Our results suggest that enclave deformation can instead be linked to strain conditions regardless of rheological difference, which excludes this elegant possibility to link enclave deformation to the thermal evolution of the pluton and its growth rate.
Our first-order deformation relationship applied to melt extraction from a mush, which probably caused the magmatic foliation observed at Adamello (Fiedrich et al., 2017), suggests that
21
extraction did not cause sufficient pure shear to explain the observed enclave deformation. When our deformation relationship is instead linked to multiple injections in a pre-existing host, enclave flattening depends on the initial position of the non-deformed enclave with respect to the injection point rather than on the geometry of the injection setup. Figure 10 suggests that the Adamello enclaves started deforming when they were between 0.5 and 2 km from the central injection point. This result hinges on the assumption of injections of identical volumes. Changes in injection volumes and/or rates (Paterson et al., 2011; Schöpa and Annen, 2013) greatly affect pure shear histories (Ramsay, 1989), significantly changing the deformation paths of Fig. 10. We also expect that this direct link between injection and deformation will be modulated by other factors (e.g., Paterson and Vernon, 1995) when considering the interpretation of natural systems. We thus view Fig. 10 as an illustrative application of our semi-empirical deformation relationship rather than a geologically meaningful quantification.
An additional limiting factor to relating injection and deformation like in Fig. 10 is that there is more than one occasion for enclaves to be strained. Enclaves form by disaggregation of the injected material in an environment that is not shear free. Such non-coaxial deformation during enclave formation is thus likely to precede that due to the effect of the next injection illustrated in Fig. 10. Another factor is that our simulations involve polydisperse spheres, but crystals are anisometric, which enhances shear localization (Picard et al., 2013) and creates crystal orientation domains (Ildefonse et al., 1992; Picard et al., 2011) and mineral foliation (Arbaret et al., 1996). Our particles are not cohesive but crystals may adhere to each other by synneusis at low melt fraction (Philpotts and Dickson, 2000; Paterson et al., 2019).
All our runs deformed in a similar fashion, but our results also highlight a second-order dependence of deformation on the onset of particles contacts and force chains, which are both related to particle concentration. Host crystal contents are more important than those of enclaves because enclave particles pack early, quickly erasing differences in initial crystal contents and transmitting
22
solid stresses to the host. Whether the host is able to transmit those stresses across its own volume is controlled by host crystal content. Enclave deformation is thus partly controlled by the coupling of the solid phases instead of by that of the melt phases. Quantifying the stress partition between force chains, melt viscous deformation, and melt–particle entrainment will be within the scope of a future study, because it would clarify 1) which phase interactions (melt–melt, particle–melt, or particle– particle) exert these second-order controls of deformation, and 2) the apparent lack of effect of domain geometry at large deformation, when the extreme edges of the deformed ellipse go from the central part of the domain into the lateral arms of the cross.
A seemingly more minor phenomenon occurs along the axis of maximum elongation. When enclaves are stretched, they sweep host particles in their way, flanking the enclaves with two bulges featuring a dense network of force chains that opposes deformation. Unlike the case of two pure fluids deformed at low Reynolds number, these bulges make the deformation an irreversible process, which is a hallmark of particulate suspensions (Souzy et al., 2016). Viscous numbers (Ivg in Bergantz et al.,
2017), are 105–1010 in the enclaves and 103–105 in the hosts. Owing to the large melt viscosity of
magmas, these values are much higher than the ones usually reached in CFD-DEM studies (Boyer et al., 2011; Ness and Sun, 2015; Chèvremont et al., 2019). They characterize a regime where, if present, contact forces dissipate most of the power compared to viscous drag and melt viscosity (Trulsson et al., 2012), which is consistent with our results showing that the emergence of force chains takes precedence over melt viscosity contrast.
5. Conclusions
This work presents results from computational fluid dynamics with discrete element modeling aimed at deforming crystal-rich enclaves in pure shear. The first series of deformation involved only pure fluids to validate the setup and several pre-existing deformation relationships. The second series comprised seven runs aimed at reproducing magmatic conditions. Enclaves were made of a
23
cylindrical suspension of particles embedded into a host with different characteristics. In both media, particles and fluids had densities, viscosities, elastic characteristics, and sizes tailored to the in-situ crystallization paths of magmas having the respective bulk chemical compositions of host and enclaves found in the Adamello pluton, Italy. Each run corresponds to a temperature along the two respective crystallization paths and span crystal contents from 10 to 62 vol.% .
The most surprising result is that, to first order, deformation does not depend on differences in melt viscosities, crystal contents, or bulk viscosity contrast. This is due to the formation of force chains parallel to the main compression direction, which transmits stress across the enclave, bypassing the fluid interfaces. A simple, first-order relationship could be fitted to our data to relate shear and enclave deformation. We applied this relationship to the case of multiple injections in a pre-existing host, following the setup proposed by Caricchi et al., (2012) to explain the Adamello pluton construction. This setup assumes that enclaves are thermally equilibrated with the host and that they deform because the surrounding host is stretched by the expansion caused by the arrival of new material in the main feeding area of the magmatic system. Our results illustrate that the enclave deformation depends on the initial position of the non-deformed enclave with respect to the injection point rather than on injection geometry. This interpretation ignores all other sources of enclave deformation.
All our runs deformed in a similar fashion, but our results also highlight a second-order dependence of deformation on the onset of particles contacts and force chains, which are both related to particle concentration. The main control of these second-order effects lies in the host crystal content. Enclave particles pack early, quickly erasing differences in initial content and building force chains parallel to the compression axis that transmit stresses to the host. Whether the host is able to transmit those stresses across its own volume is controlled by host crystal content.
24
Acknowledgments
We would like to thank two anonymous reviewers for their constructive comments, K. Russell for his proficient editorial handling, and R. Mari for stimulating discussions on granular processes. All the numerical simulations presented in this paper were performed using the CIMENT infrastructure (ciment.ujf-grenoble.fr), which is supported by the Rhône-Alpes region (GRANT CPER07_13CIRA: www.ci-ra.org). This project was partially funded by a grant from USMB (AAP 2018). C.A. received funding from the European Union’s Horizon 2020 research and innovation programme under the Marie Sklodowska-Curie grant agreement No. 794594.
References
Alves, A., Pereira, G. de S., Janasi, V. de A., Higgins, M., Polo, L.A., Juriaans, O.S., Ribeiro,
B.V., 2015. The origin of felsic microgranitoid enclaves: Insights from plagioclase
crystal size distributions and thermodynamic models. Lithos 239, 33–44.
https://doi.org/10.1016/j.lithos.2015.09.027
Andrews, B.J., Manga, M., 2014. Thermal and rheological controls on the formation of mafic
enclaves or banded pumice. Contrib. Mineral. Petrol. 167, 961.
https://doi.org/10.1007/s00410-013-0961-7
Annen, C., Pichavant, M., Bachmann, O., Burgisser, A., 2008. Conditions for the growth of a
long-lived shallow crustal magma chamber below Mount Pelee volcano (Martinique,
Lesser Antilles Arc). J. Geophys. Res. 113. https://doi.org/10.1029/2007JB005049
Arbaret, L., Diot, H., Bouchez, J.-L., 1996. Shape fabrics of particles in low concentration
suspensions: 2D analogue experiments and application to tiling in magma. J. Struct.
Geol. 18, 941–950. https://doi.org/10.1016/0191-8141(96)00011-9
Arbaret, L., Mancktelow, N.S., Burg, J.-P., 2001. Effect of shape and orientation on rigid
particle rotation and matrix deformation in simple shear flow. J. Struct. Geol. 23,
113–125. https://doi.org/10.1016/S0191-8141(00)00067-5
Bergantz, G.W., Schleicher, J.M., Burgisser, A., 2017. On the kinematics and dynamics of
crystal-rich systems. J. Geophys. Res. Solid Earth 122, 2017JB014218.
https://doi.org/10.1002/2017JB014218
Bergantz, G.W., Schleicher, J.M., Burgisser, A., 2015. Open-system dynamics and mixing in
magma mushes. Nat. Geosci. 8, 793–796. https://doi.org/10.1038/ngeo2534
Bilby, B.A., Eshelby, J.D., Kundu, A.K., 1975. The change of shape of a viscous ellipsoidal
region embedded in a slowly deforming matrix having a different viscosity.
25
Boudreau, A.E., 1999. PELE—a version of the MELTS software program for the PC
platform. Comput. Geosci. 25, 201–203.
Boyer, F., Guazzelli, É., Pouliquen, O., 2011. Unifying Suspension and Granular Rheology.
Phys. Rev. Lett. 107. https://doi.org/10.1103/PhysRevLett.107.188301
Caricchi, L., Annen, C., Rust, A., Blundy, J., 2012. Insights into the mechanisms and
timescales of pluton assembly from deformation patterns of mafic enclaves. J.
Geophys. Res. Solid Earth 117, B11206. https://doi.org/10.1029/2012JB009325
Carrara, A., Burgisser, A., Bergantz, G.W., 2019. Lubrication effects on magmatic mush
dynamics. J. Volcanol. Geotherm. Res. 380, 19–30.
Chèvremont, W., Chareyre, B., Bodiguel, H., 2019. Quantitative study of the rheology of
frictional suspensions: Influence of friction coefficient in a large range of viscous
numbers. Phys. Rev. Fluids 4, 064302.
https://doi.org/10.1103/PhysRevFluids.4.064302
Cimarelli, C., Costa, A., Mueller, S., Mader, H.M., 2011. Rheology of magmas with bimodal
crystal size and shape distributions: Insights from analog experiments. Geochem.
Geophys. Geosystems 12. https://doi.org/10.1029/2011GC003606
Coombs, M.L., Eichelbeger, J.C., Rutherford, M.J., 2000. Magma storage and mixing
conditions for the 1953-74 eruptions of Southwest Trident volcano, Katmai National
Park, Alaska. Contrib. Mineral. Petrlogy 140, 99–118.
Costa, A., Caricchi, L., Bagdassarov, N., 2009. A model for the rheology of particle-bearing
suspensions and partially molten rocks. Geochem. Geophys. Geosystems 10.
De Campos, C.P., Dingwell, D.B., Fehr, K.T., 2004. Decoupled convection cells from mixing
experiments with alkaline melts from Phlegrean Fields. Chem. Geol. 213, 227–251.
https://doi.org/10.1016/j.chemgeo.2004.08.045
Didier, J., Barbarin, B., 1991. Enclaves and Granite Petrology. Elsevier.
Dioguardi, F., Dellino, P., Mele, D., 2014. Integration of a new shape-dependent particle–
fluid drag coefficient law in the multiphase Eulerian–Lagrangian code MFIX-DEM.
Powder Technol. 260, 68–77. https://doi.org/10.1016/j.powtec.2014.03.071
Dufek, J., Bachmann, O., 2010. Quantum magmatism: Magmatic compositional gaps
generated by melt-crystal dynamics. Geology 38, 687–690.
Faroughi, S.A., Huber, C., 2014. Crowding-based rheological model for suspensions of rigid
bimodal-sized particles with interfering size ratios. Phys. Rev. E 90, 052303.
Fiedrich, A.M., Bachmann, O., Ulmer, P., Deering, C.D., Kunze, K., Leuthold, J., 2017.
Mineralogical, geochemical, and textural indicators of crystal accumulation in the
Adamello Batholith (Northern Italy). Am. Mineral. 102, 2467–2483.
https://doi.org/10.2138/am-2017-6026
Furuichi, M., Nishiura, D., 2014. Robust coupled fluid‐particle simulation scheme in Stokes‐
flow regime: Toward the geodynamic simulation including granular media. Geochem.
Geophys. Geosystems 15, 2865–2882. https://doi.org/10.1002/2014GC005281
Garg, R., Galvin, J., Li, T., Pannala, S., 2012. Open-source MFIX-DEM software for gas–
solids flows: Part I—Verification studies. Powder Technol. 220, 122–137.
Garg, R., Galvin, J., Li, T., Pannala, S., 2010. Documentation of open-source MFIX–DEM
software for gas-solids flows. URL Httpsmfix Netl Doe
Govdocumentationdemdoc2012-1 PdfAccessed 31 March 2014.
Gay, N.C., 1976. The change of shape of a viscous ellipsoidal region embedded in a slowly
deforming matrix having a different viscosity — a discussion. Tectonophysics 35,
403–407. https://doi.org/10.1016/0040-1951(76)90078-0
26
Gidaspow, D., 1994. Multiphase Flow and Fluidization: Continuum and Kinetic Theory
Descriptions. Academic Press.
Giordano, D., Russell, J.K., Dingwell, D.B., 2008. Viscosity of magmatic liquids: A model.
Earth Planet. Sci. Lett. 271, 123–134.
Hodge, K.F., Carazzo, G., Jellinek, A.M., 2012. Experimental constraints on the deformation
and breakup of injected magma. Earth Planet. Sci. Lett. 325–326, 52–62.
https://doi.org/10.1016/j.epsl.2012.01.031
Hodge, K.F., Jellinek, A.M., 2012. Linking enclave formation to magma rheology. J.
Geophys. Res. Solid Earth 117, B10208. https://doi.org/10.1029/2012JB009393
Ildefonse, B., Sokoutis, D., Mancktelow, N.S., 1992. Mechanical interactions between rigid
particles in a deforming ductile matrix. Analogue experiments in simple shear flow. J.
Struct. Geol. 14, 1253–1266. https://doi.org/10.1016/0191-8141(92)90074-7
Jessell, M.W., Bons, P.D., Griera, A., Evans, L.A., Wilson, C.J.L., 2009. A tale of two
viscosities. J. Struct. Geol. 31, 719–736. https://doi.org/10.1016/j.jsg.2009.04.010
John, B.E., Blundy, J.D., 1993. Emplacement-related deformation of granitoid magmas,
southern Adamello Massif, Italy. GSA Bull. 105, 1517–1541.
https://doi.org/10.1130/0016-7606(1993)105<1517:ERDOGM>2.3.CO;2
Johnson, S.E., Albertz, M., Paterson, S.R., 2001. Growth rates of dike-fed plutons: Are they
compatible with observations in the middle and upper crust? Geology 29, 727–730.
https://doi.org/10.1130/0091-7613(2001)029<0727:GRODFP>2.0.CO;2
Laumonier, M., Scaillet, B., Pichavant, M., Champallier, R., Andujar, J., Arbaret, L., 2014.
On the conditions of magma mixing and its bearing on andesite production in the
crust. Nat. Commun. 5, 5607.
Laurent, O., Zeh, A., Gerdes, A., Villaros, A., Gros, K., Słaby, E., 2017. How do granitoid
magmas mix with each other? Insights from textures, trace element and Sr–Nd
isotopic composition of apatite and titanite from the Matok pluton (South Africa).
Contrib. Mineral. Petrol. 172, 80. https://doi.org/10.1007/s00410-017-1398-1
Li, T., Garg, R., Galvin, J., Pannala, S., 2012. Open-source MFIX-DEM software for
gas-solids flows: Part II—Validation studies. Powder Technol. 220, 138–150.
Lisle, R.J., Rondeel, H.E., Doorn, D., Brugge, J., van de Gaag, P., 1983. Estimation of
viscosity contrast and finite strain from deformed elliptical inclusions. J. Struct. Geol.
5, 603–609. https://doi.org/10.1016/0191-8141(83)90072-X
Lommen, S., Schott, D., Lodewijks, G., 2014. DEM speedup: Stiffness effects on behavior of
bulk material. Particuology, Special issue on conveying and handling of particulate
solids – Challenges of discrete element simulation, application and calibration 12,
107–112. https://doi.org/10.1016/j.partic.2013.03.006
Mader, H.M., Llewellin, E.W., Mueller, S.P., 2013. The rheology of two-phase magmas: A
review and analysis. J. Volcanol. Geotherm. Res. 257, 135–158.
https://doi.org/10.1016/j.jvolgeores.2013.02.014
Manga, M., 1996. Mixing of heterogeneities in the mantle: Effect of viscosity differences.
Geophys. Res. Lett. 23, 403–406. https://doi.org/10.1029/96GL00242
Marques, F.O., Mandal, N., Taborda, R., Antunes, J.V., Bose, S., 2014. The behaviour of
deformable and non-deformable inclusions in viscous flow. Earth-Sci. Rev. 134, 16–
69. https://doi.org/10.1016/j.earscirev.2014.03.007
Martel, C., Pichavant, M., Holtz, F., Scaillet, B., 1999. Effects of fO2 and H2O on andesite
phase relations between 2 and 4 kbar. J. Geophys. Res. 104, 29453–29470.
27
Moitra, P., Gonnermann, H.M., 2015. Effects of crystal shape- and size-modality on magma
rheology. Geochem. Geophys. Geosystems 16, 1–26.
https://doi.org/10.1002/2014GC005554
Montagna, C.P., Papale, P., Longo, A., Bagagli, M., 2017. Magma Chamber Rejuvenation:
Insights from Numerical Models, in: Advances in Volcanology. Springer, Berlin,
Heidelberg, pp. 1–12. https://doi.org/10.1007/11157_2017_21
Mulchrone, K.F., Meere, P.A., 2015. Shape fabric development in rigid clast populations
under pure shear: The influence of no-slip versus slip boundary conditions.
Tectonophysics 659, 63–69. https://doi.org/10.1016/j.tecto.2015.08.003
Ness, C., Sun, J., 2015. Flow regime transitions in dense non-Brownian suspensions:
Rheology, microstructural characterization, and constitutive modeling. Phys. Rev. E
91, 012201. https://doi.org/10.1103/PhysRevE.91.012201
Paterson, S.R., Ardill, K., Vernon, R., Žák, J., 2019. A review of mesoscopic magmatic
structures and their potential for evaluating the hypersolidus evolution of intrusive
complexes. J. Struct. Geol., Back to the future 125, 134–147.
https://doi.org/10.1016/j.jsg.2018.04.022
Paterson, S.R., Fowler, T.K., 1993. Re-examining pluton emplacement processes. J. Struct.
Geol. 15, 191–206. https://doi.org/10.1016/0191-8141(93)90095-R
Paterson, S.R., Okaya, D., Memeti, V., Economos, R., Miller, R.B., 2011. Magma addition
and flux calculations of incrementally constructed magma chambers in continental
margin arcs: Combined field, geochronologic, and thermal modeling studies.
Geosphere 7, 1439–1468. https://doi.org/10.1130/GES00696.1
Paterson, S.R., Vernon, R.H., 1995. Bursting the bubble of ballooning plutons: A return to
nested diapirs emplaced by multiple processes. GSA Bull. 107, 1356–1380.
https://doi.org/10.1130/0016-7606(1995)107<1356:BTBOBP>2.3.CO;2
Paterson, S.R., Vernon, R.H., Tobisch, O.T., 1989. A review of criteria for the identification
of magmatic and tectonic foliations in granitoids. J. Struct. Geol. 11, 349–363.
https://doi.org/10.1016/0191-8141(89)90074-6
Petrelli, M., El Omari, K., Le Guer, Y., Perugini, D., 2016. Effects of chaotic advection on
the timescales of cooling and crystallization of magma bodies at mid crustal levels.
Geochem. Geophys. Geosystems 17, 425–441.
https://doi.org/10.1002/2015GC006109
Pfiffner, O.A., Ramsay, J.G., 1982. Constraints on geological strain rates: Arguments from
finite strain states of naturally deformed rocks. J. Geophys. Res. Solid Earth 87, 311–
321. https://doi.org/10.1029/JB087iB01p00311
Philpotts, A.R., Dickson, L.D., 2000. The formation of plagioclase chains during convective
transfer in basaltic magma. Nature 406, 59–61.
Picard, D., Arbaret L., Pichavant M., Champallier R., Launeau P., 2013. The rheological
transition in plagioclase‐bearing magmas. J. Geophys. Res. Solid Earth 118, 1363–
1377. https://doi.org/10.1002/jgrb.50091
Picard, D., Arbaret, L., Pichavant, M., Champallier, R., Launeau, P., 2011. Rheology and
microstructure of experimentally deformed plagioclase suspensions. Geology 39,
747–750.
Piwinskii, A.J., Wyllie, P.J., 1968. Experimental Studies of Igneous Rock Series: A Zoned
Pluton in the Wallowa Batholith, Oregon. J. Geol. 76, 205–234.
28
Radjai, F., Roux, S., Moreau, J.J., 1999. Contact forces in a granular packing. Chaos
Interdiscip. J. Nonlinear Sci. 9, 544–550. https://doi.org/10.1063/1.166428
Ramsay, J.G., 1989. Emplacement kinematics of a granite diapir: the Chindamora batholith,
Zimbabwe. J. Struct. Geol. 11, 191–209.
https://doi.org/10.1016/0191-8141(89)90043-6
Scaillet, B., Whittington, A., Martel, C., Pichavant, M., Holtz, F., 2000. Phase equilibrium
constraints on the viscosity of silicic magma II: implications for mafic-silicic mixing
processes. Trans. R. Soc. Edinb. Earth Sci. 91, 61–72.
Schaltegger, U., Brack, P., Ovtcharova, M., Peytcheva, I., Schoene, B., Stracke, A.,
Marocchi, M., Bargossi, G.M., 2009. Zircon and titanite recording 1.5million years of
magma accretion, crystallization and initial cooling in a composite pluton (southern
Adamello batholith, northern Italy). Earth Planet. Sci. Lett. 286, 208–218.
https://doi.org/10.1016/j.epsl.2009.06.028
Schleicher, J.M., Bergantz, G.W., Breidenthal, R.E., Burgisser, A., 2016. Time scales of
crystal mixing in magma mushes. Geophys. Res. Lett. 43, 1543–1550.
https://doi.org/10.1002/2015GL067372
Schmid, D.W., Podladchikov, Y.Yu., 2004. Are isolated stable rigid clasts in shear zones
equivalent to voids? Tectonophysics 384, 233–242.
https://doi.org/10.1016/j.tecto.2004.04.006
Schöpa, A., Annen, C., 2013. The effects of magma flux variations on the formation and
lifetime of large silicic magma chambers. J. Geophys. Res. Solid Earth 118, 926–942.
https://doi.org/10.1002/jgrb.50127
Souzy, M., Pham, P., Metzger, B., 2016. Taylor’s experiment in a periodically sheared
particulate suspension. Phys. Rev. Fluids 1, 042001.
https://doi.org/10.1103/PhysRevFluids.1.042001
Syamlal, M., 1998. MFIX documentation numerical technique. EG and G Technical Services
of West Virginia, Inc., Morgantown, WV (United States).
Syamlal, M., Rogers, W., OBrien, T.J., 1993. MFIX documentation theory guide. USDOE
Morgantown Energy Technology Center, WV (United States).
Treagus, S.H., 2002. Modelling the bulk viscosity of two-phase mixtures in terms of clast
shape. J. Struct. Geol. 24, 57–76. https://doi.org/10.1016/S0191-8141(01)00049-9
Trulsson, M., Andreotti, B., Claudin, P., 2012. Transition from the Viscous to Inertial
Regime in Dense Suspensions. Phys. Rev. Lett. 109, 118305.
https://doi.org/10.1103/PhysRevLett.109.118305
Vernon, R.H., Etheridge, M.A., Wall, V.J., 1988. Shape and microstructure of microgranitoid
enclaves: Indicators of magma mingling and flow. Lithos 22, 1–11.
https://doi.org/10.1016/0024-4937(88)90024-2
Wiesmaier, S., Morgavi, D., Renggli, C.J., Perugini, D., De Campos, C.P., Hess, K.-U.,
Ertel-Ingrisch, W., Lavallée, Y., Dingwell, D.B., 2015. Magma mixing enhanced by bubble
segregation. Solid Earth 6, 1007–1023. https://doi.org/10.5194/se-6-1007-2015
Williams, Q., Tobisch, O.T., 1994. Microgranitic enclave shapes and magmatic strain
histories: Constraints from drop deformation theory. J. Geophys. Res. Solid Earth 99,
24359–24368. https://doi.org/10.1029/94JB01940
29
Figure Captions
Figure 1: Simulation setup. A) Views from above and from the side of the thin 3D domain
undergoing planar strain shear. B) View the cubic 3D domain undergoing pure shear. Axes are labeled in m and the rendering is based on the fluid cells. Shear is driven by incoming normal velocities at two opposite boundaries (white arrows) and accommodated by free outflow along the Y (planar strain and pure shear) and Z (pure shear only) directions. Run 3g at t=0 s (see Table 2).
Figure 2: Ratio between the predicted enclave shape (X/Y) and that measured in the
CFD-DEM runs as a function of the viscosity ratio between host and enclave for pure fluids. Each run at a given viscosity ratio is represented by 10 symbols, which correspond to deformation increasing from ε1=0.05 to ε10=0.7. Planar strain predictions follow the
relationships proposed by Bilby et al. (1975) (diamonds, RB), Manga (1996) (squares,
RM), and Caricchi et al. (2012) (triangles, RC). Triangles at a viscosity ratio of 220 are not
shown because they overestimate the deformation by a factor 130 to 3500, which is beyond the y-axis range. Uniaxial deformation predictions follow the Bilby et al. (1975) relationship (circles, RU). Some symbols have been slightly shifted along the x-axis for
clarity.
Figure 3: Enclave shape (X/Y) measured in pure-fluid CFD-DEM runs vs. shape predicted by
Bilby et al. (1975) as a function of the viscosity ratio between host and enclave (from 8×10⁻⁵ to 220). All runs have inlet and outlet apertures of 40 cm, except one run that has
80-cm apertures (black circles). Symbol sizes represent the maximum distance that the further edge of the deformed enclave reaches at the end of a run. The dashed line is a fit correcting the geometrical drift at large X/Y (RBcorr). The inset illustrates a maximum
30
Figure 4: Crystal content as a function of temperature for the host granodiorite (thick black
line) and two enclave dioritic compositions (thin black lines) using the MELTS model in the software PELE (Boudreau, 1999). Labels indicate the initial melt water content at high temperature. Vertical dashed lines mark run temperatures (Table 2). The gray lines are the fits of the experimental data – triangles are from Piwinskii and Wyllie (1968) and circles are from Martel et al. (1999) – used in the work of Caricchi et al. (2012).
Figure 5: Typical planar strain run (3g) at maximum deformation (ε10=0.7). Axes are labeled in
m. Blue particles belong to the host. Green particles are host particles that reached concentration similar to that of the enclave. They are referred to as bulges in the text. Yellow particles are enclave particles surrounded by enclave melt and red particles are enclave particles surrounded by host melt.
Figure 6: Ratio between the predicted enclave shape (X/Y) and that measured in the
CFD-DEM runs as a function of the bulk viscosity ratio between host and enclave for suspensions. Each run at a given viscosity ratio is represented by 10 symbols, which correspond to deformation increasing from ε1=0.05 to ε10=0.7. Planar strain predictions
follow the relationships proposed by Bilby et al. (1975) (corrected for the geometrical drift at large X/Y, diamonds, RBcorr), Manga (1996) (squares, RM), and Caricchi et al.
(2012) (upward triangles, RC). Fits (RCfit ,see text) of the run results using the Caricchi et
al. (2012) relationship are represented by downward triangles for planar strain and by circles for uniaxial deformation. Some symbols have been slightly shifted along the x-axis for clarity.
Figure 7: Enclave shape (X/Y) vs. deformation for all particle-laden runs. An empirical fit (Eq.
(11)) is also shown. The horizontal line marks the X/Y ratio beyond which the enclave is more elongated than the inlet aperture size for planar strain. The X/Y ratio beyond which