HAL Id: tel-01928014
https://tel.archives-ouvertes.fr/tel-01928014
Submitted on 20 Nov 2018HAL is a multi-disciplinary open access
archive for the deposit and dissemination of sci-entific research documents, whether they are pub-lished or not. The documents may come from teaching and research institutions in France or abroad, or from public or private research centers.
L’archive ouverte pluridisciplinaire HAL, est destinée au dépôt et à la diffusion de documents scientifiques de niveau recherche, publiés ou non, émanant des établissements d’enseignement et de recherche français ou étrangers, des laboratoires publics ou privés.
Biological invasion risk assessment, considering
adaptation at multiple scales : the case of topmouth
gudgeon Pseudorasbora parva
David Fletcher
To cite this version:
David Fletcher. Biological invasion risk assessment, considering adaptation at multiple scales : the case of topmouth gudgeon Pseudorasbora parva. Biodiversity and Ecology. Université Montpellier, 2018. English. �NNT : 2018MONTG029�. �tel-01928014�
1
Rapport de gestion
2015
THÈSE POUR OBTENIR LE GRADE DE DOCTEUR
DE L’UNIVERSITÉ DE MONTPELLIER
En: Ecologie et Biodiversité École doctorale: GAIA
Unité de recherche: UMR 5554 - ISEM - Institut des Sciences de l'évolution de Montpellier
Présentée par David FLETCHER
Le 4 Juin 2018
Sous la direction de Rodolphe GOZLAN
et Simon BLANCHET
et Phillipa GILLINGHAM
Devant le jury composé de
Rodolphe GOZLAN, Dr., IRD Simon BLANCHET, Dr., SETE Martin DAUFRESNE, Dr., IRSTEA Gordon COPP*, Prof., CEFAS
Rémi CHAPPAZ, Prof., Université Aix-Marseille
Jean-Christophe AVARRE, Dr., Université de Montpellier * Président du jury Directeur Co-Directeur Rapporteur Rapporteur Examinateur Examinateur
Titre de la thèse : Assessing further scope for spread in a
biological invasion, considering adaptation at multiple
scales: the case of topmouth gudgeon, Pseudorasbora
2
PUBLICATIONS AND PRESENTATIONS
Published journal articles
Fletcher, D. H., Gillingham, P. K., Britton, J. R., Blanchet, S., & Gozlan, R. E. (2016). Predicting global invasion risks: a management tool to prevent future introductions. Scientific reports, 6, srep26316.
Submitted journal articles
Fletcher, D. H., Gillingham, P. K. & Gozlan, R. E. (2017). The role of genetic lineages in predicting climate suitability for invasive species. Submitted to
PLOS ONE and currently undergoing revisions, following review.
Articles in preparation
Fletcher, D. H., Blanchet, S., Britton, J. R., Gillingham, P. K. & Gozlan, R. E. Thermal impact on life history traits of invasive fish populations: an experimental approach. (in prep. for submission to Ecology of Freshwater
Fish).
Fletcher, D. H., Blanchet, S., Britton J. R., Gillingham, P. K. & Gozlan, R. E. Biological drivers of fish dispersal during an invasion process. (in prep. for submission to Behavioural Ecology).
Oral presentations
Fletcher, D. H. (2016). Predicting global invasion risks: a management tool to prevent future introductions. British Ecological Society annual international conference. 11th-14th December 2016. ACC, Liverpool, UK.
3
RÉSUMÉ
Afin de quantifier les risques d’invasion chez le goujon Asiatique Pseudorasbora
parva, un petit cyprinidae d’eau douce, j’ai tout d’abord utilisé une approche
corrélative visant à modéliser enveloppe climatique de cette espèce et dans laquelle j’ai intégré un proxy relatif à la probabilité d’introduction. Cette approche s’appuie sur l’hypothèse que les organismes s’adaptent aux conditions environnementales locales ou régionales. J’ai ensuite comparé les conditions climatiques occuppées de deux lignées génétiques majeures à la fois dans les aires natives et non-natives. Puis dans un second temps, par une approche expérimentale j’ai comparé la réponse aux variations de température, des traits d’histoire de vie de populations vivant dans des zones climatiques contrastées. Finalement, je me suis intéressé à la dispersion des goujons Asiatiques afin de tester si les populations situées sur les fronts d’invasions avaient des capacités de colonisation plus importante. J’ai donc quantifié et comparé le long d’un gradient d’invasion, le potentiel de dispersion des individus ainsi que des traits pouvant y être liés (activité et morphologie).
L’étude des risques d’invasions a montré que de nombreuses zones – au delà des zones déjà occupées - étaient climatiquement favorables au goujon Asiatique. C’était le cas en particulier pour certaines zones comme l’Australie, l’Amériques du Sud et du Nord, indiquant que l’invasion de cette espèce pourrait encore s’étendre. Après avoir pris en compte les probabilités d’introduction, cette étude a montré que l’Amérique du Nord était la zone la plus à risques. Par contre, l’enveloppe climatique modélisée entre les différentes lignées dans les zones géographiques non-natives sont très similaire, ce qui laisse à penser qu’il n’y a pas de patrons d’adaptation locale chez cette espèce. Pour autant, enveloppes climatiques de l’espèce modélisée dans la zone
4
européenne (non-native) sont différentes de celle modélisées dans la zone asiatique (native), ce qui suggère une expansion lors processus de colonisation. Les réponses thermiques des traits d’histoire de vie du goujon Asiatique testés expérimentalement n’ont pas variées significativement entre les populations originaires de conditions climatiques continentales et maritime-tempérées. Par exemple, l’effort reproductif global des femelles n’a pas varié entre les températures testées (15-25°C) mais la stratégie temporelle de reproduction a beaucoup varié. L’effort reproductif était plus cours et plus intense à forte température, alors qu’il était plus étalé et avec des pics reproductifs moins forts à faible température. Par ailleurs, il semble qu’il existe un gradient morphologique fort entre les populations situées à différentes distances du front d’invasion ce qui suggère une forte plasticité morphologique mais qui ne serait pas liée à la capacité de dispersion de ces populations. En effet, cette dernière ne variait pas significativement le long du gradient d’invasion. La capacité de dispersion serait principalement liée à la taille du corps de goujon Asiatique, les individus les plus grands ayant une probabilité plus élevée de disperser.
Bien que les prédictions générales du modèle utilise pour caractériser l’enveloppe climatique puissent être affectées par de potentielles adaptations à l’échelle de la population ou de la lignée évolutive, les résultats suggèrent qu’une certaine incertitude liée à ces prédictions persiste puisque la distribution native ne prédisait que très mal la distribution actuelle dans les zones non-natives. Par ailleurs, mes travaux expérimentaux à plus fine échelle suggèrent que cette espèce est extrêmement adaptable et tolère une large gamme environnementale, ce qui pourrait expliquer son caractère invasif. Les connaissances produites au cours de cette thèse constituent donc des ressources extrêmement pertinentes pour développer des stratégies de gestion visant à contrôler les invasions futures du goujon Asiatique.
5
Mots-clés: Invasion biologique, poisson, niche écologique, modèles spatiaux,
6
ABSTRACT
In this thesis I set out to quantify the risk of invasion from the invasive freshwater fish, Pseudorasbora parva, at a global extent, using traditional correlative ecological niche modelling approaches with the integration of surrogate data representing introduction likelihood (Chapter II). These correlative approaches rely upon key assumptions relating to the presence or absence of local or regional adaptations, and so I subsequently tested for evidence of such adaptations in genetic lineages and in individual populations. This was achieved through analyzing climatic differentiation of key genetic lineages in the native and non-native ranges (Chapter III) and by conducting lab experiments comparing thermal responses of important life history traits in populations from contrasting climates (Chapter IV). The initial risk assessment did not account for a key factor in invasions; namely, natural dispersal. Natural dispersal has been observed to be subject to selection in vanguard populations of invasive species, and adaptation of dispersal traits can infer additional invasive vigor, allowing the species to spread across the landscape quicker. For this reason, I quantified dispersal, activity and morphological differences, often associated with differential dispersal ability, in populations along a distance-gradient from an invasion front, in order to identify if P. parva is capable of such adaptations.
The initial risk mapping study showed that large areas, beyond the current distribution of the species, are climatically suitable. These areas are mainly in North and South America, Australia and New Zealand, and constitute significant scope for spread and impact of this species. When introduction likelihood was included, N. America appears most at risk. I found no evidence to suggest that native genetic lineages represented local adaptations to their respective native climates - there was little or no
7
differentiation of the lineages’ occupied climatic conditions in the European range. It was also apparent, from the comparisons, that the climatic conditions in the European range constituted an expansion, compared to the native range. The thermal responses of P. parva life history traits did not differ significantly between populations from a strongly seasonal continental climate and a mild temperate maritime climate. The overall reproductive output of females did not vary according to breeding season temperature, however, temporal reproductive strategy showed a strong response, with lower temperatures inducing a protracted breeding season and higher temperatures inducing rapid and intense reproductive output. The dispersal and morphology-related study identified a strong gradient of morphological change, corresponding with distance from invasion front. This demonstrates a high degree of plasticity in P.
parva’s morphology in an invasion context, however this was not linked to either
dispersal or activity levels, neither of which was significantly linked to distance from invasion front. Dispersal was best explained by body size, with larger fish more likely to disperse further.
Whilst I found no evidence to suggest that the model predictions (Chapter II) were hampered by differentiation at either lineage or population levels, the findings of Chapter III do highlight the uncertainties surrounding the degree of conservatism in such predictions, mainly owing to the fact that past, native, distribution did not accurately represent the current distribution. The results of Chapters II-IV show broad tolerances and great plasticity in P. parva, which likely underpin this species success as a pan-continental invader. The knowledge produced in this thesis provides a useful new resource for the development of management strategies for P. parva and could be usefully enhanced by the additional of analogous studies on native populations, which could help elucidate the source of the observed plasticity.
8
Keywords: Biological invasion, fish, ecological niche, spatial modelling,
9
REMERCIEMENTS
First I’d like express my sincere gratitude to Rudy Gozlan, Simon Blanchet, Pippa Gillingham and Rob Britton for their supervision and guidance throughout my studentship. I always left steering meetings with a renewed sense of confidence and clarity about what I next needed to achieve and comments on manuscripts were always helpful and no doubt improved their chances of publication immeasurably. In particular, thanks to Rudy for organising the whole project and the funding in the first place and for helping me to navigate the intricacies of the university administrational system in a country where I have only the weakest grasp of the language. Thanks to Pippa for always being available at short notice for meetings where she typically facilitated my realisation of how to tackle problems with one or two choice questions, for guidance on all things spatial and for her constant encouragement. Thanks to Rob for his guidance on maintaining the fish and the aquaria equipment, for his general guidance on all things fishy. Thanks to Simon for organising the necessary permits and for the inordinate amount of time spent driving us around the South of France, collecting fish, and for his expert guidance on statistical methods and on wine. I must also say a particular thanks to Jean-Francois Martin, for his role in my steering committee and for running around, delivering paperwork and obtaining signatures each year, typically at short notice, for my re-enrolment at the university – I am very, very grateful.
I have been very lucky to have met a number of fantastic, kind, helpful and supportive people during my studentship, both in France and in the UK.
In France, thanks to Julien Cote, who arranged my accommodation whilst I worked in Moulis and to all my other housemates there who made it such an enjoyable experience. A number of fellow PhD students and also some interns helped out on various aspects of the experimental work in Moulis, from helping me build and maintain the experimental systems, to helping catch the fish and run the actual experiments. Thank you to Yoann Buoro, Nico Cant, Yahui Zhao, Lieven Therry, Jerome Prunier, Keoni Saint-Pe and anyone else that helped in any way.
In the UK, the thermal challenge experiments were quite high maintenance; the fish required checking, feeding and cleaning every day. For the times when I was away, thank you to the kind souls who so graciously agreed to help out. Thank you to Danny Sheath, Josie Pegg, Tea Bašić, Adrian Blake, Georgina Busst, for looking after things while I was away. This meant more than you can imagine; I hope the tequila was worth it. Thank you to my office mates and friends at Bournemouth University for providing such an intellectually stimulating environment in which to work – I always looked forward to seeing what interesting new diagram or profound quotation had been added to the white-board.
Thank you also to my family and friends who have been unwavering in their support and encouragement. Last, but by no means least, the most enormous and heartfelt thanks have to go to my wonderful and loving wife, Colette, for supporting me emotionally and financially throughout this endeavour, for being a constant source of inspiration, motivation and encouragement – words cannot adequately express the level of gratitude I feel.
10
TABLE OF CONTENTS
PUBLICATIONS AND PRESENTATIONS ... 2
PUBLISHED JOURNAL ARTICLES ... 2
SUBMITTED JOURNAL ARTICLES ... 2
ARTICLES IN PREPARATION ... 2 ORAL PRESENTATIONS ... 2 RÉSUMÉ ... 3 ABSTRACT ... 6 REMERCIEMENTS ... 9 TABLE OF CONTENTS ...10 LIST OF TABLES ...13 LIST OF FIGURES ...14
RÉSUMÉ EXÉCUTIF EN FRANÇAIS ...18
CHAPTER I - GENERAL INTRODUCTION ...28
BIOLOGICALINVASIONS ... 29
TACKLINGTHEPROBLEM ... 31
RISKANALYSIS ... 33
Introduction ... 34
Establishment ... 35
Characteristics of introduction events ...35
Characteristics of the introduced organism ...37
Characteristics of the recipient environment ...37
Spread ... 42
Impact ... 43
RAPIDRISKASSESSMENTSANDSCREENINGTOOLS ... 45
ECOLOGICALNICHEMODELS ... 46
SPECIES’ADAPTATIONTONEWENVIRONMENTS ... 48
OBJECTIVESOFTHETHESIS... 54
FOCALSPECIES ... 55
CHAPTER II - PREDICTING GLOBAL INVASION RISKS: A MANAGEMENT TOOL TO PREVENT FUTURE INTRODUCTIONS. ...58
ABSTRACT ... 59
INTRODUCTION ... 60
MATERIALS&METHODS ... 63
Data on presence and absence of P. parva ... 63
Predictor variable data ... 64
Additional data ... 66
Modelling methods ... 67
Creation of the P. parva risk map ... 68
RESULTS ... 69
Predictive accuracy in models ... 69
Predictor variable importance... 70
Suitability predictions ... 72
Risk predictions ... 73
DISCUSSION ... 73
REFERENCES ... 81
CHAPTER III - THE ROLE OF GENETIC LINEAGES IN PREDICTING CLIMATE SUITABILITY FOR INVASIVE SPECIES. ...93
11
ABSTRACT ... 94
INTRODUCTION ... 96
MATERIALS&METHODS ... 100
Occurrence data ... 100
Lineage data ... 101
Environmental Data ... 102
Ordination techniques – niche overlap, equivalency and similarity tests ... 104
RESULTS ... 105
Niche comparisons of lineages in native range ... 105
Niche comparisons between native and introduced ranges ... 106
Niche comparisons of lineages in the introduced range ... 108
DISCUSSION ... 109
REFERENCES ... 117
CHAPTER IV - THERMAL IMPACT ON LIFE HISTORY TRAITS OF INVASIVE FISH POPULATIONS: AN EXPERIMENTAL APPROACH. ... 132
ABSTRACT ... 133
INTRODUCTION ... 135
MATERIALS&METHODS ... 138
Sources of adult fish ... 138
Aquarium facility and initial holding conditions ... 139
Experimental design ... 140
Data collection ... 142
Data analyses ... 144
RESULTS ... 146
Reproductive effort ... 146
Temporal pattern in reproductive effort ... 148
Growth of progeny ... 154
DISCUSSION ... 155
CONCLUSION ... 162
REFERENCES ... 163
CHAPTER V - BIOLOGICAL DRIVERS OF FISH DISPERSAL DURING AN INVASION PROCESS. ... 174
ABSTRACT ... 175
INTRODUCTION ... 177
MATERIALS&METHODS ... 181
Sampling methods and locations ... 181
Activity ... 182 Morphology ... 183 Dispersal propensity ... 184 Morphology analysis ... 186 Activity analysis ... 186 Dispersal analysis ... 187 RESULTS ... 188 Morphometric analysis ... 188 Activity ... 190 Dispersal ... 191 DISCUSSION ... 193 CONCLUSIONS ... 198 REFERENCES ... 199
CHAPTER VI - GENERAL DISCUSSION... 209
APPROACH ... 210
SUMMARY ... 210
12
CLIMATICADAPTATIONS ... 217
DISPERSALANDMORPHOLOGY ... 220
CONCLUSIONS ... 222
PERSPECTIVES ... 223
REFERENCES ... 226
13
LIST OF TABLES
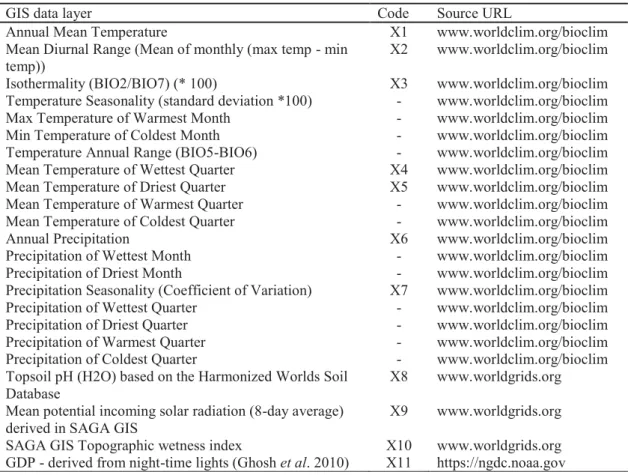
Table 2.1 Description of abiotic descriptor datasets used in analysis and source URLs. Variables in the column entitled code marked with an asterisk were retained for modelling procedures...62
Table 2.2 Mean variable importance by modelling method, as a percentage. Variable importance scores, as measured by randomization technique, calculated for individual models as 1— Pearson’s correlation between predictions, before and after randomization. Scores were then converted into a % of the sum of all variable importance scores for each modelling method. The scores of the three most important variables in the final EMmw model are highlighted in bold...68
Table 3.1 GIS layer datasets, used in analysis. Those with a short ‘code’ were retained for final analysis...100
Table 3.2 List of entities compared and respective data used to calibrate each of the PCA-Env runs...101
Table 4.1 Names, locations and climatic descriptors for the three sampled populations. Climatic descriptors were extracted from Hijmans et al. (2005) ‘bioclim’ dataset, based on mean monthly temperatures, but converted to °C where necessary. Seasonality is calculated as the standard deviation multiplied
by one
hundred...134
Table 4.2 The number of replicates used per temperature treatment and population. Two populations from Poland (PL1 & PL2) and one from England...137
Table 5.1 Proportion of between-group variance explained by each of the five linear discriminants...185
Table 5.2 Coefficients of linear discriminants for LDA of 11 morphometric characteristics of Pseudorasbora parva, using population location as grouping factor...185
14
LIST OF FIGURES
Figure 1.1 Heuristic diagram, adapted from Soberón & Peterson (2005), depicting visual representations of the three categories of constrains that determine a species distribution; Abiotic constraints (A); Biotic constraints (B); Physical barriers to dispersal (P) ...36
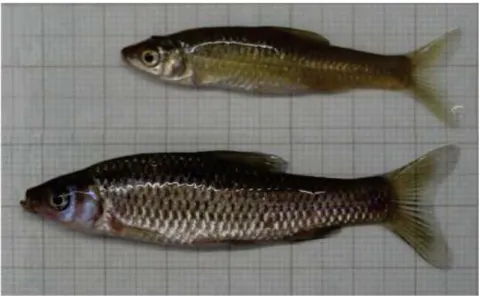
Figure 1.2 Photograph of female (top) and male (bottom) Pseudorasbora parva ...52
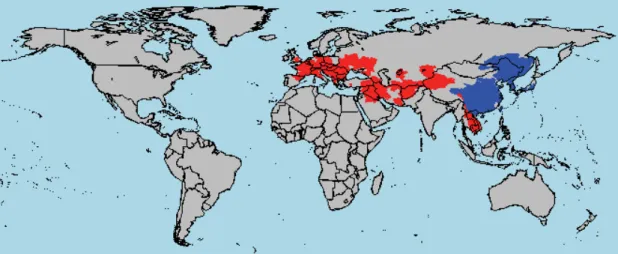
Figure 1.3 Global map displaying river basins where Pseudorasbora parva occurs, in the native (blue) and non-native (red) ranges, according to Tedesco et al. (2017)...53
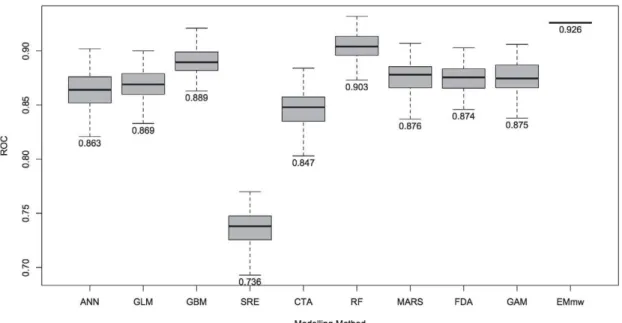
Figure 2.1 Box-plots displaying the Area Under Curve (AUC), Receiver Operating Characteristic (ROC) evaluation scores for all models, grouped by modelling method. Components of box-plots represent minimum, lower quartile, mean upper quartile and maximum values for each modelling method. For each group n = 100, except for EMmw, where n = 1...66
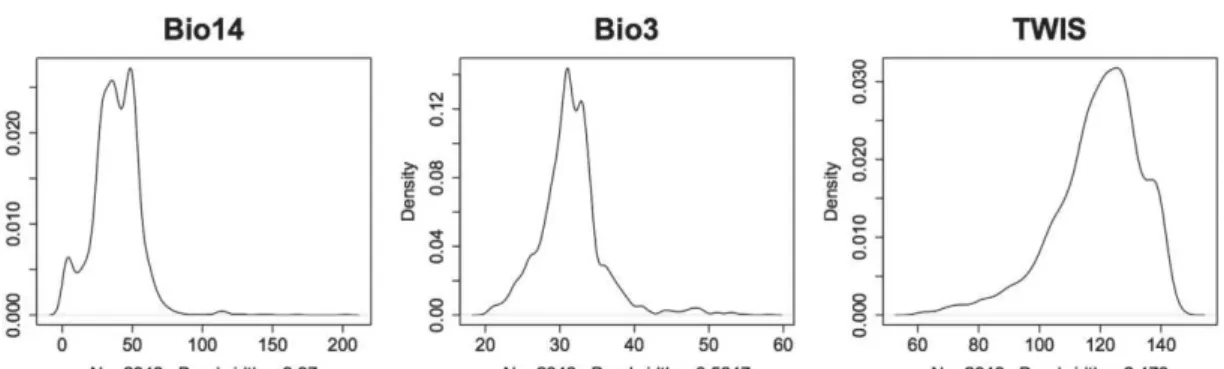
Figure 2.2 Density plots of top three most important variables in final mean-weighted Ensemble Model (EMmw), in order of importance; (a) Bio14 – Precipitation of driest month (mm); (b) Bio3 – Isothermality (mean diurnal temperature range divided by annual temperature range; (c) TWIS – Topographic Wetness Index...68
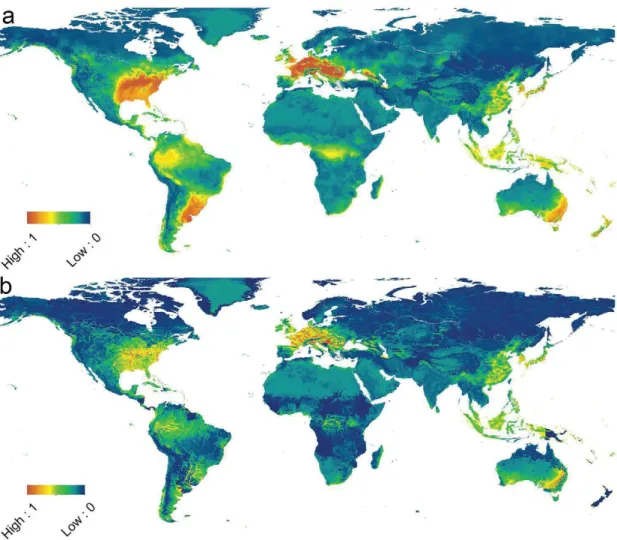
Figure 2.3 Suitability (a) and Risk (b) maps. Both maps use the same colour scale, from low value of 0 to high value of 1, indicating suitability and risk of successful invasion, respectively. Final layout of map panels was generated
using Esri ArcMap (Version 10.0, Build 2414. url:
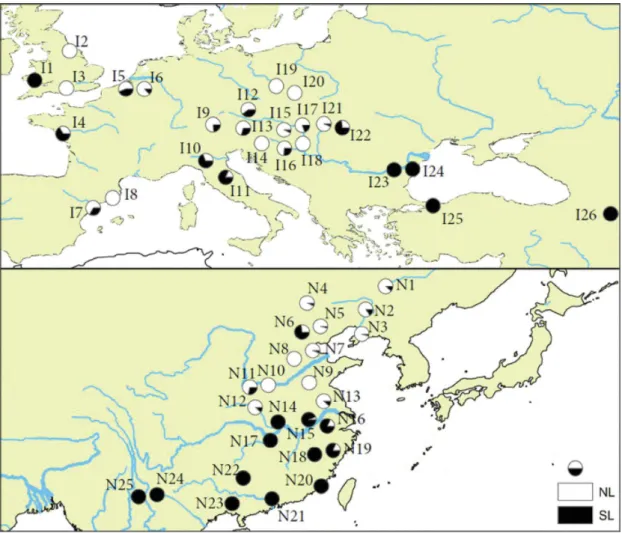
https://www.arcgis.com/)...69 Figure 3.1 Map displaying the locations of populations sampled and the identified lineages, including relative proportions depicted in pie charts, in both the native and introduced ranges identified by Simon et al., 2011, 2015 and Hardouin et al., 2018)...99
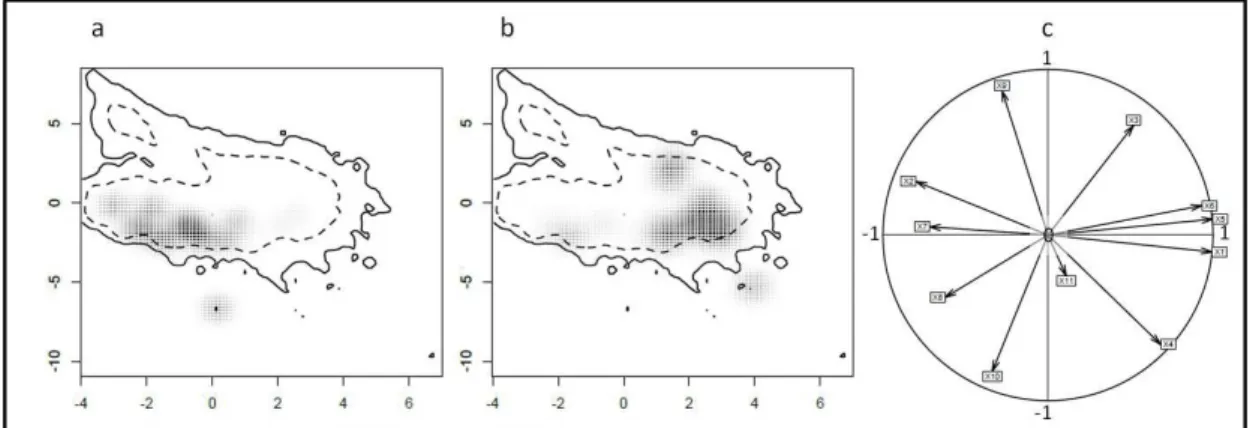
Figure 3.2 Kernel-smoothed output of PCA trained on data from native range, depicting bioclimatic niche of Native Northern lineage (a), Native Southern Lineage (b) and correlation circle of the PCA (c). Solid and dashed contours represent 100% and 50% of background environmental data...103
15
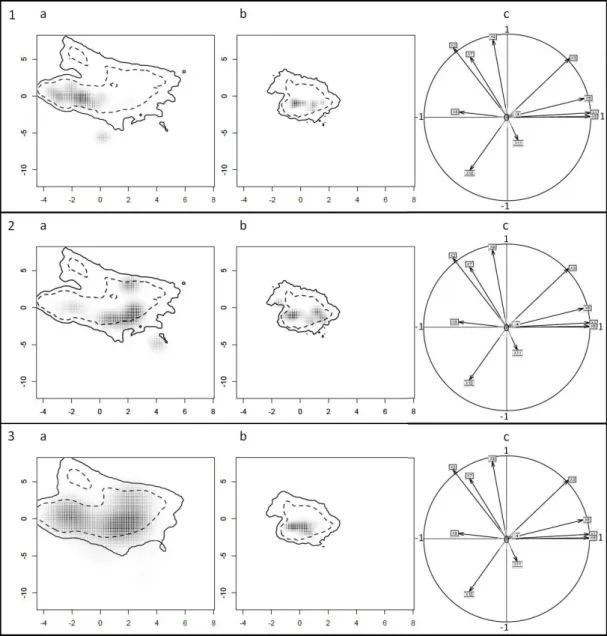
Figure 3.3 Kernel-smoothed output of PCA trained on data from native and non-native ranges, depicting bioclimatic niche of Native Northern lineage (panel 1, a), Introduced Northern Lineage (panel 1, b), Native Southern Lineage (panel 2, a), Introduced Southern Lineage (panel 2, b), undifferentiated Native niche (panel 3, a), undifferentiated Introduced niche (panel 3, b) and corresponding correlation circles (1 c, 2 c & 3 c). Solid and dashed contours represent 100% and 50% of background environmental data...104
Figure 3.4 Kernel-smoothed output of PCA trained on data from introduced range, depicting bioclimatic niche of Introduced Northern lineage (a), Introduced Southern Lineage (b) and correlation circle of the PCA (c). Solid and dashed contours represent 100% and 50% of background environmental data...106
Figure 4.1 Photograph showing the experimental setup, with reservoirs and refrigeration units at the base and experimental units within aquaria, divided by green Corex™ sheets...135
Figure 4.2 Photograph showing experimental unit, with the male guarding the nest, made from an upturned length of plastic guttering...137
Figure 4.3 Fitted mean clutch size by Pseudorasbora parva population, with standard errors...142
Figure 4.4 Fitted relationship of total fecundity (full duration of study) of
Pseudorasbora parva with Standard Length (SL), with standard
errors...143
Figure 4.5 Fitted number of clutches by Pseudorasbora parva population, with
standard errors...144
Figure 4.6 Slope coefficients, for proportion of Pseudorasbora parva eggs laid over time, by population and temperature treatments, with standard errors...146
Figure 4.7 Fitted relationship between Pseudorasbora parva clutch size (25-day aggregated data) and Standard Length (SL), with standard errors...147
Figure 4.8 Fitted clutch size over time, by Pseudorasbora parva population, with standard errors...148
Figure 4.9 Fitted Pseudorasbora parva clutch size over time, by temperature
treatment, with standard errors...148
Figure 4.10 Fitted relationship between Pseudorasbora parva fecundity (25-day aggregated data) and Standard Length (SL), with standard errors...149
16
Figure 4.11 Fitted relationship between Pseudorasbora parva fecundity and time, by temperature treatment, with standard errors...150
Figure 4.12 Fitted growth rates of fish progeny for all Pseudorasbora parva
populations, at all temperature treatments, with standard errors...151
Figure 5.1 Map displaying the six sampled Pseudorasbora parva population locations on the River Garonne: Portet-sur-Garonne (POR); Grenade (GRE); Bourret (BOU); Auvillar (AUV); Tonneins (TON); Couthures-sur-Garonne (COU) ...177
Figure 5.2 Photograph of Pseudorasbora parva sample, with digitised landmarks (LMs) indicated and numbered. Morphometrics calculated are: Preorbital distance (1-2); Head length (1-7); Eye diameter (2-4); Postorbital distance (4-7); Head depth (5-6); Body length (7-14); Pectoral fin to pelvic fin (8-10); Body depth (9-10); Pelvic fin to anal fin (10-11); Caudal peduncle length (11-13); Caudal peduncle depth (12-13)...179
Figure 5.3 Tank configuration of experimental dispersal systems, with dispersal location number in parentheses...180
Figure 5.4 First two linear discriminants from linear discriminant analysis of 11 measured morphometric traits, with colours and ellipses identifying the population groups: Portet-sur-Garonne (POR); Grenade (GRE); Bourret (BOU); Auvillar (AUV); Tonneins (TON); Couthures-sur-Garonne (COU)...183
Figure 5.5 LD1 (top) and LD2 (bottom) plotted against distance from Pseudorasbora
parva invasion front, with standard errors and linear regression lines...186
Figure 5.6 Activity (distance travelled in 15 minutes) plotted against distance from
Pseudorasbora parva invasion front, with standard errors and linear
regression line...187
Figure 5.7 Relative importance of parameters in full-averaged model, composed of all fitted models where ∆ AICc < 2. Models terms are: log(SL) (1); LD1 (2); PropFront (3); LD1:PropFront (4); Act_km (5); LD2 (6); Act_km:PropFront (7); LD2:PropFront (8); Act_km:LD1 (9); log(SL):PropFront (10); LD1:LD2 (11) ...188
Figure 5.8 Full model averaged parameter coefficient estimates (unfilled circles), with adjusted standard errors (heavier lines) and 95% confidence intervals (lighter lines). Parameters containing the variable ‘Act_km’ are plotted on a separate
17
axis, as the values are an order of magnitude greater than that of other parameters...188
18
RÉSUMÉ EXÉCUTIF EN FRANÇAIS
INTRODUCTION
Les invasions biologiques posent de sérieux problèmes pour la biodiversité et le fonctionnement des écosystèmes. La dispersion des espèces au delà de leur aire native est une des causes majeures du changement global. La globalisation du commerce et des transports a largement contribuée à la translocation et la dispersion des espèces non-natives, que ce soit de façon intentionnelle ou non (Perrings et al., 2005; Meyerson & Mooney 2007; Crowl et al.,2008). Les voies d’introduction d’espèces non-natives sont nombreuses et au delà des introductions intentionnelles, elles peuvent être la conséquence de la contamination des biens, des gens ou des animaux d’élevages par des pathogènes, de la dispersion naturelle des organismes ou des changements environnementaux majeurs (par ex. construction de ponts, de tunnels, de canaux…).
Les impacts écologiques générés par l’introduction d’espèces non-natives peuvent se manifester de différentes façons. Une espèce introduite peut rentrer en compétition avec les espèces natives pour une ressource limitée (territoires, nourritures…) et conduire à un déplacement des espèces natives, voir à une extinction locale ou régionale. Par ailleurs, les espèces non-natives peuvent agir comme nouveaux vecteurs de maladies émergentes ou amplificateurs de maladies locales. Les impacts des espèces non-natives peuvent se révéler à l’échelle des individus, mais aussi à l’échelle de l’écosystème dans sa globalité. Par exemple, certaines plantes invasives peuvent affecter les concentrations en carbone ou en azote du sol (Liao et al.,2008) et d’autres organismes non-natifs peuvent modifier complètement l’habitat physique en ayant un rôle « d’ingénieur » (Davis, 2009).
19
L’introduction d’espèces non-natives est responsable de pertes économiques majeures (équivalente à 5% du Produit Interieur Brut global) et conduit à des pertes de l’ordre de 20% de la production alimentaire globale (Nentwig 2007). Clavero & Garcia-Berthou (2005) ont par ailleurs démontrés en se basant sur la liste rouge IUCN que 54% des espèces listées comme étant en cours d’extinction (et pour lesquelles les causes étaient connues) étaient concernées par les invasions biologiques. Les invasions biologiques sont reconnues comme une cause majeure des problèmes environnementaux contemporains, comme en atteste le nombre florissant d’études sur le sujet (Hulme, 2009; Gurevitch et al.,2011).
Les impacts écologiques et économiques causés par l’introduction d’espèces peuvent rapidement augmentés avec le temps depuis la première introduction (Norton 2005). Le plus souvent, il devient très rapidement impossible d’éradiquer les populations non-natives établies sans mettre en oeuvre des politiques extrêmement longues et couteuses (Leung et al., 2002). Cela montre l’importance d’intervenir très tôt au cours du processus d’invasion afin de contrôler les potentielles conséquences négatives (Kolar & Lodge 2001). Etant donné le consensus général sur les risques économiques et écologiques associés aux invasions biologiques, ce n’est pas surprenant qu’un part importante des ressources humaines et financières soient investies vers des outils permettant d’améliore notre compréhension des facteur déterminants la probabilité pour une espèce de devenir invasives (Kolar & Lodge 2001; Copp et al., 2005b; 2009).
Prédire les régions à forts risques d’introduction d’espèces non-natives et d’invasions subséquentes est fondamental pour développer des politiques de gestions basées sur des actions préventives visant en particulier ces zones. Le goujon asiatique est un poisson d’eau douce (Cyprinidés, Pseudorasbora parva) originaire d’Asie et qui a été
20
introduit en Europe dans les années 1960 avant de proliférer et de devenir une espèce invasive (Gozlan et al., 2010; Gozlan, 2012). Cette espèce a étendue sont aire de distribution non-native à un taux d’environ cinq nouveaux pays par décennie pour couvrir à l’heure actuelle une région s’étendant de la Turquie à l’Est de l’Angleterre et le Pays de Galles. On le retrouve même en Afrique du Nord (Algérie et Maroc) et au Moyen Orient (Iran) (Gozlan et al., 2010; Gozlan 2012). Bien que de petite taille corporelle (souvent moins de 120 mm de long), son introduction a causé de très forts impacts du fait de sa capacité à rapidement former des populations de très grandes tailles (fortes densités dans le milieu, Britton & Brazier 2006; Britton et al., 2010; Britton & Gozlan 2013). Ceci est particulièrement le cas dans les milieux dégradés (Rosecchi et al., 2001), ce qui conduit entre autre à une compétition pour les ressources avec les espèces natives (Jackson & Britton 2013). En plus de ces effets directs, le goujon asiatique est porteur sain d’un agent infectieux émergent (Sphaerothecum destruens) qui est connu pour causer des mortalités importantes chez de nombreuses autres espèces de poissons, parmi lesquelles certains salmonidés à fortes valeurs commerciales (Gozlan et al., 2005; Spikmans et al., 2013; Ercan et al., 2015). Malgré le fait que cette espèce pose de sérieux risques écologiques et économiques et qu’elle ait été définie comme l’espèce de poissons d’eau douce la plus invasive en Europe (Gozlan et al., 2010), il n’y a pas eut de quantification de ses risques d’invasion à l’échelle globale. Ceci constitue un des manques de connaissances les plus criants pour cette espèce et cela pourrait fortement limiter les efforts pouvant être fait pour limiter davantage une dispersion future et les impacts en résultants.
Au cours de cette thèse, mon objectif général était de quantifier les risques d’invasion de Pseudorasbora parva à l’échelle globale en utilisant des approches corrélatives de
21
modélisation de la l’enveloppe climatique (Chapitre II). Ces approches corrélatives dépendent d’hypothèses de bases liées à la présence ou l’absence d’adaptation aux échelles locales et régionales. J’ai donc testé par la suite les évidences pour des adaptations de ce type au sein des principales lignées génétiques de P. parva et de certaines de ses populations en comparant d’une part les enveloppesles enveloppes climatiques modélisées entre les aires natives et non-natives (Chapitre III) et d’autre part en menant des expériences en laboratoires sur la réponse thermique de traits d’histoire de vie majeurs (Chapitre IV). L’analyse du risque d’invasion proposée dans le premier chapitre ne prend pas en compte un facteur clef des invasions ; à savoir la capacité de dispersion naturelle. La capacité de dispersion a souvent été montré comme étant sujet à la sélection naturelle lors des phénomènes d’invasions et l’adaptation de certains traits liés à la dispersion pourrait permettre à certaines espèces (ou populations) d’améliorer leur pouvoir de propagation. Par exemple, lors de l’invasion du crapaud buffle en Australie, il a été observé que le taux de dispersion dans le paysage a été multiplié par cinq au cours des 70 dernières années du fait de l’adaptation génétique de certains traits liés à la dispersion (la longueur des jambes) le long du front d’invasion (Phillips et al., 2010). Au cours du Chapitre V, j’ai donc quantifié et comparé la capacité de dispersion, l’activité et la morphologie générale (deux traits pouvant être liés à la capacité de dispersion) chez six populations de P.
parva le long d’un gradient d’invasion afin de tester si de telles adaptations existaient
chez cette espèce.
SYNTHESE DU CHAPITRE II
Pouvoir prédire les régions à fort risque d’introductions d’espèces non-natives est un enjeu fondamental pour mettre en place des actions de prévention efficaces et des mesures de gestion des risques appropriées. P. parva est rapidement devenu une
22
espèce très invasive depuis sont introduction en Europe dans les années 1960. En plus des impacts négatifs directs que cette espèce peut avoir sur les populations natives de poissons, P. parva peut transmettre une maladie infectieuse émergente qui peut provoquer la mort de nombreuses autres espèces. Afin de quantifier les risques d’invasion de cette espèce dans les régions ou l’espèce pourrait être introduite, j’ai développé des modèles dit « de niches » qui m’ont permis de construire un modèle d’ensemble prédisant l’adéquation de l’enveloppe climatique de chaque région étudiée et un proxy pour la probabilité d’introduction. Ces modèles ont montrés que
P. parva pourrait envahir de nombreuses régions actuellement non concernées par son
introduction. Cela inclue des régions dans plusieurs continents, avec en particulier la mise en évidence de points chauds d’adéquation climatique et de risque d’introduction. Ces modèles sont facilement adaptables pour de nombreuses autres espèces envahissantes et les cartes de risques en résultant peuvent être utilisées par les gestionnaires et les décideurs pour accroitre les surveillances dans les régions concernées et mettre en place des systèmes de « early-warming » permettant d’éviter des introductions et invasions futures.
SYNTHESE CHAPITRE III
Les adaptations intraspécifiques aux conditions locales et régionales peuvent affecter les prédictions d’adéquation de l’enveloppe climatique issues des modèles « de niche », que ce soit dans le contexte des invasions biologiques et plus largement dans le contexte du changement global. Ces adaptations sont souvent concordantes avec la structure génétique des populations. J’ai dans un premier temps testé l’effet de la structure génétique des populations sur le shift potentiel de l’enveloppe climatique en utilisant les invasions biologiques comme cadre général. J’ai utilisé une Analyse en Composante Principale pour quantifier les enveloppes bioclimatiques de deux lignées
23
génétiques distinctes chez P. parva à partir de 57 points d’échantillonnage dans son aire native et non native. A l’aide de tests de chevauchement de niche (Schoener’s D), d’équivalence et de similarité, j’ai comparé les enveloppes climatiques modélisées entre les deux lignées et les étendues spatiales.
La distribution native des deux lignées correspondait à deux enveloppes climatiques distinctes, mais cette ségrégation climatique disparaissait au sein de la zone
native. En fait, les enveloppes climatiques modélisées entre les aires natives et non-natives se chevauchaient assez peu. La perte de la différentiation en terme d’occupation de l’enveloppe climatique dans les zones non-natives suggère que la différentiation génétique entre les deux lignées observée au sein de l’aire native était due à une ségrégation physique et à la dérive génétique plutôt qu’à une isolation par l’environnement. Ceci suggère que la plasticité phénotypique, plutôt que l’adaptation climatique par sélection naturelle, est le mécanisme principal ayant permis à P. parva de coloniser de nouveaux environnements avec autant de succès. Les barrières physiques contraignant la distribution des espèces limitait la relation entre l’occurrence de l’espèce et les conditions climatiques telle que caractérisée par les modèles de niche traditionnels. Ces approches corrélatives pourrait donc sous-estimer le potentiel adaptatif des espèces, surtout pour celle ayant un fort potentiel plastique. Dans ces cas précis il est essentiel d’obtenir des données précises caractérisant les besoins environnementaux des espèces à l’aide d’approche contrôlées.
SYNTHESE DU CHAPITRE IV
La gestion des espèces non-native basée sur l’analyse des risques dépend de notre compréhension de leur potentiel d’invasion, qui est lui même largement déterminée
24
par l’expression des traits d’histoire de vie (THV) dans leur milieux d’accueil. Comprendre comment les THV varient avec les conditions environnementales permet de mieux prédire le potentiel invasif des espèces. Après un phénomène d’introduction, un prérequis pour que les individus fondateurs survivent (puis s’établissent) est que les conditions environnementales locales permettent l’expression de THV facilitant l’établissement (Moyle & Light 1996). Pour les poissons d’eau douce, ces conditions dépendent beaucoup du climat et –dans les habitats lentiques- en particulier de la température (Crozier & Hutchings 2014). Ainsi, là ou de nombreuses populations introduites d’espèces non-natives ce sont adaptées aux conditions climatiques du milieu d’accueil (e.g. régime de température, Kavanagh et al., 2010), cela indiquerait que la provenance des populations pourrait fortement influencer le potentiel invasif dans n’importe quelle autre localité secondaire d’introduction ou de translocation (e.g. Rey et al., 2012). Dans ce chapitre, j’ai réalisé une expérience en laboratoire afin de quantifier les réponses liées à la capacité reproductrice d’adultes et à la croissance de leurs rejetons à trois températures (15 °C, 20 °C and 25 °C) chez P. parva. Afin de tester l’adaptation locale, j’ai comparé la réponse thermique des adultes et de leur rejetons provenant de trois populations non-natives de deux pays et représentatives de deux climats très contrastés ; climat continental froid de Pologne et climat tempéré maritime du Royaume-Uni. Ces expériences n’ont pas permis de mettre en évidence de différentiation significative pour ce qui est de la réponse thermique entre les différentes populations, suggérant une absence d’adaptation au climat local. Nos résultats suggèrent que la taille du corps, pas la température, détermine le rendement reproducteur brut des femelles sur l’ensemble de la saison de reproduction, avec les individus les plus grands qui étaient les plus féconds. Cependant, la température affectait la stratégie reproductive temporelle, avec des rendements reproductifs prolongés et moins intenses à des températures basses (et au contraire plus rapides et
25
avec des pics plus élevés à des fortes températures). Le tôt de croissance précoce des rejetons était plus élevé à des températures élevées et en particulier significativement différent en les températures de 25 °C et de 15 °C. Ces résultats ont d’importantes implications pour la gestion des espèces de poissons introduites, particulièrement d’un point de vue de la saisonnalité des mesures d’interventions. Ceci suggère que les études futures combinent des facteurs liés à la température et à la disponibilité en nourriture pour développer nos connaissances relatives quant à la façon dont ces facteurs intéragissentpour influencer le succès d’invasion.
SYNTHESE DU CHAPITRE V
Le processus d’invasion biologique est caractérisé par un certain nombre d’étapes, chacune d’elle est liée à une barrière pouvant limier le succès d’invasion. Les caractéristiques (i.e. les traits) liées à la dispersion sont un des facteurs pouvant déterminer la capacité des espèces à franchir ces barrières à l’invasion. Il y a en effet de plus en plus d’évidence que les populations situées sur les fronts d’invasion sont phénotypiquement différentes par rapport à des populations établies depuis longtemps et une partie de ces différences impliquent des traits liés à la dispersion. La dispersion est souvent liée à des traits morphologiques, mais peut aussi être dépendants de traits comportementaux. Ces traits peuvent former des ensembles cohérents comme par exemple des « phénotypes dispersants » dont la prévalence devrait diminuer avec l’éloignement au front d’invasion. La présence de ces phénotypes sur les fronts d’invasions pourrait être un déterminant majeur du succès d’expansions et donc de l’invasibilité d’une espèce. Dans ce chapitre j’ai échantilloné six populations de P.
parva le long d’un gradient d’invasion (de 0 à 210 km depuis le front d’invation ) le
long de la Garonne en France. J’ai utilisé une approche expérimentale en mésocosme pour quantifier la propension à disperser, le niveau d’activité ainsi que la morphologie
26
générale de chaque population. J’ai testé si des covaritions existaient entre ces traits, si elles variaient entre les populations et par rapport à la distance au front d’invasion. Au cours de ces expériences, j’ai montré que le seul prédicteur significatif de la propension à disperser était la taille corporelle des poisson qui cependant ne variait pas entre les populations. Bien que nous ayons put mettre en évidence une cline morphologie le long du gradient d’invasion, nous n’avons trouvé aucun lien significatif entre ces variations morphologiques et la propension à disperser. Les différences morphologiques étaient principalement liées à la taille relative de la tête et au diamètre des yeux, ce qui pourrait indiquer un shift dans la diète ou le mode de vie le long du gradient d’invasion. Nos résultats ont montré que les individus les plus gros étaient ceux qui étaient le plus apte à disperser. Les individus les plus gros sont aussi les plus féconds, ce qui pourrait permettre à P. parva d’étendre rapidement son aire de répartition et à coloniser de nouveaux habitats plus rapidement qu’au hasard. Cependant, d’autres facteurs pourraient influencer la dispersion, comme par exemple la sociabilité et les effets densité-dépendances.
CONCLUSIONS
Cette thèse a permis de générer une carte mondiale des risques d’invasion de P.
parva, ce qui a démontré que l’aire potentielle d’invasion de cette espèce est
extrêmement grande, en particulier sur les continents Sud et Nord Américains. Bien que les résultats de cette thèse ne suggèrent pas que ces prédictions soient particulièrement affectées par les différentiations observées aux échelles des lignées ou des populations, j’ai pus démontré qu’un certain degré d’incertitudes dans ces prédictions persistait, principalement du fait que la distribution native ne prédisait pas correctement la distribution actuelle. Néanmoins, en combinant les données de distributions connues dans les aires natives en non-natives, ces incertitudes étaient
27
plus faibles qu’en utilisant uniquement les données disponibles dans l’aire native. L’absence d’évidence pour de l’adaptation locale (Chapitres III et IV) devraient être complémentés par des expériences impliquant des populations de l’aire native ainsi que des populations non-natives sélectionnées a priori. et qui présenteraient des différences quant à l’enveloppe climatique dans lesquelles elles vivent. Un examen plus approfondi des zones inoccupées de l’aire natives, correspondant à des conditions climatiques appropriées, pourrait nous aider à mieux comprendre les facteurs limitants importants pour P. parva (par ex. facteurs biotiques, facteurs abiotiques à l’échelle locale) et à identifier de nouveaux moyens de gérer les populations non-natives. Cette thèse a également permis de montrer de très fortes variations morphologiques liées à la distance au front d’invasion, ce qui suggère un fort degré de plasticité phénotypique par P. parva dans la zone envahie. Bien que ces variations n’étaient pas liées significativement à la dispersion des individus, cette plasticité pourrait avoir une influence sur le potentiel invasif de cette espèce. Davantage d’études devraient être menées car ces variations morphologiques pourraient être liées aux comportements de nutrition et ainsi avoir des effets sur la faune locale via un chevauchement trophique. De plus, cela indiquerait que ces mesures morphologiques pourraient être utilisées pour différencier les populations en cours d’expansion des populations plus âgées, ce qui pourrait être utile afin de proposer des plans de gestions et d’éradication pertinents.
28
CHAPTER I
29
BIOLOGICAL INVASIONS
Biological invasions pose a severe threat to biodiversity and ecosystem functioning. Dispersal of species beyond their native range underpins this pervasive driver of global change. Dispersal is a natural process and is critical to the global distribution of species, to the functioning of demographic processes (i.e. metapopulations theory) and is even a major driver of species evolution (Nentwig 2007). The advent of globalisation and the proliferation of international trade and travel have increasingly led to the anthropogenic removal of dispersal barriers with the rapid increase in the translocation of organisms, both intentionally and unintentionally (Perrings et al., 2005; Meyerson & Mooney 2007; Crowl et al., 2008). Species have been intentionally introduced for a variety of reasons, with many seen as assets due to their aesthetic properties (i.e. ornamental fish and plants), their desirability as pets, and their commercial value as a food or material (i.e. crops, livestock, trees for timber) (Pimentel et al., 2005; Pejchar & Mooney 2009). Introduction pathways are manifold and aside from intentional introductions, they may also occur as a result of the contamination of goods, vessels, livestock or people (e.g. parasites or disease), or individuals may themselves disperse naturally, but aided by changes to the environment (e.g. opening up of new waterways, construction of bridges and tunnels – Hulme et al., 2009).
It is not just human facilitated movements of biological organisms that pose the threat of invasions. Climate change has the potential to play a significant role in determining invasion success, both directly, by influencing survivorship of transportation and initial introduction (Hellmann et al., 2008; Pyke et al., 2008), and indirectly, by destabilising or disturbing ecosystems, making them more susceptible to invasion (Byers, 2002). Furthermore, climate change may lead to range expansions and/or
30
range shifts of organisms, particularly at range edges, where conditions were previously of marginal suitability and may now rapidly become suitable (Dukes & Mooney, 1999). Similarly, existing populations of seemingly benign introduced species may outperform native species and become invasive under novel climatic regimes (e.g. Stachowicz et al., 2002). Such changes in species distributions may lead to novel biotic interactions, with unpredictable outcomes, some of which may mean loss of biodiversity or ecosystem services (Schweiger et al., 2010).
Nonetheless, not all introduced non-native species go on to become invasive (Blackburn et al., 2011). Many introduced species fail to survive their initial introduction and, of those that do, many do not go on to become invasive (Jeschke & Strayer 2005). However, a subset of those species introduced go on to establish populations, spread rapidly and cause damage or harm to the native recipient ecosystems, human health or the economy (Williamson & Fitter 1996; Clavero & Garcia-Berthou 2005; Hejda et al.,2009), and these are termed ‘Invasive’. Although there is no single universal definition for the term “invasive species”, definitions typically include that it is an introduced species that poses a threat, or harm, to the environment, the economy or to human health (but see Copp et al., 2005a).
Biological invasion is a process operating at the global scale (McGeoch et al.,2010). More than 120,000 non-native plants, animals and microbes have invaded the US, UK, Australia, South Africa, India and Brazil, causing an estimated annual USD $314 billion worth of damage (Pimentel et al., 2001). The introduction of non-native species is thought to be responsible for the loss of more than 5% of global Gross National Product (GNP) and the loss of more than 20% of global food production (Nentwig 2007). Clavero & Garcia-Berthou (2005) analysed records of extinction in
31
the IUCN Red List database and found that 54% of the records, for which causes were noted, included the effects of invasive species. Recognition of the importance of the subject of biological invasions is increasing, reflected in the increase in published studies on the subject (Hulme, 2009; Gurevitch et al.,2011).
Both the impact and the associated costs can increase sharply in magnitude with time since initial introduction (Norton 2005). Often, it rapidly becomes unfeasible to eradicate established non-native populations, necessitating expensive long-term management (Leung et al., 2002). For example, since the discovery of the invasive zebra mussel, Dreissena polymorpha, in the North American Great Lakes in 1986 at low abundances (Hebert et al., 1989), it quickly spread (inhabiting waterways from Minnesota to Louisiana and from Oklahoma to West Virginia by the end of 1993; Johnson & Padilla, 1996). This invasion has caused pervasive changes to the Great Lakes ecosystem (Mills et al., 1994). Now the problem is sufficiently severe that there is little prospect for their eradication or control in open waters (Strayer 2009). This exemplifies why it is most practical to intervene early in the invasion process (Kolar & Lodge 2001), and is one of many cases that can be cited in support of the call for improved prediction and prevention (Gallien et al., 2010).
TACKLING THE PROBLEM
The importance of tackling the problem of harmful non-native species is recognized in a number of international agreements and policies. For instance the Convention on Biological Diversity (CBD) is a multilateral treaty, with 168 signatories, concerned with the conservation and sustainable use of biological diversity. Article 8(h) of the treaty requires that “Each Contracting Party shall, as far as possible and as
32
appropriate: Prevent the introduction of, control or eradicate those alien species which threaten ecosystems, habitats or species”. Another example is the European Union (EU) Regulation 1143/2014 on Invasive Alien Species (the IAS Regulation), which concerns the species included on the list of Alien Invasive Species of Union Concern. It requires that all EU member states put in place appropriate measures of prevention; early detection and rapid eradication, and management, to combat the problem (http://ec.europa.eu/environment/nature/invasivealien/index_en.htm).
Such measures, taken to protect humans, animals and the plants from pests, disease and contaminants are referred to as sanitary and phyto-sanitary measures. The World Trade Organisation (WTO) agreement on the application of sanitary and phyto-sanitary measures (SPS Agreement) entered into force on 1st January 1995. Specifically, it concerns any measure introduced by member states, to: “protect human or animal life from risks arising from additives, contaminants, toxins or disease-causing organisms in their food”; “protect human life from plant- or animal-carried diseases”; “protect animal or plant life from pests, diseases, or disease-causing organisms”; “prevent or limit other damage to a country from the entry, establishment or spread of pests” (https://www.wto.org/english/Tratop_e/sps_e/spsund_e.htm).
The SPS agreement establishes the use of systematic risk assessment and demands rational justification for any measures that may constitute barriers to trade, thus facilitating the minimisation of arbitrary or protectionist measures that may unfairly discriminate against certain regions or nations (Andersen et al., 2004). Justification should be via scientific risk assessment techniques detailed in the risk analysis standards set by the relevant international organizations, such as the World Health Organization (WHO), the Office International des Epizooties (OIE) and the Food and
33
Agriculture Organization (FAO), for human health, animal health and plant health, respectively (Branquart et al., 2016; Vanderhoeven et al., 2017).
RISK ANALYSIS
The risk analysis standards share a common general structure, incorporating the elements of hazard identification, risk assessment, risk management and risk communication (IPPC, 2007; CAC, 2011; OIE, 2011) and provide a framework against which to work to identify, quantify and mitigate the risks associated with the introduction of harmful non-native species, by allowing the targeting of often scarce resources towards those species or pathways that constitute the greatest risk, (Andersen et al., 2004; Roy et al., 2017).
Hazard identification refers to the identification of organisms capable, or potentially capable of causing harm (OIE, 2004). Risk assessment relates to the characterisation of the likelihood and magnitude of negative impacts associated with exposure to a hazard (Vanderhoeven et al., 2017). Risk management is a means of identifying, evaluating, selecting and implementing mitigation options, on the basis of risk assessments, whilst accounting for considerations such as efficacy, cost, practicality, acceptability and likelihood of reinvasion (Andersen et al., 2004; Booy et al., 2017). Risk communication is a transverse activity in the process of risk analysis and facilitates the gathering and dissemination of information that will improve both assessment and management of risk, e.g. through the education of the public and/ or industry on hazards associated with the release or escape of non-native species (Copp et al., 2016). Risk assessment is the foundation of the whole process of risk analysis and informs the development of appropriate risk mitigation measures, where
34
necessary. The risk assessment process itself consists of four key evaluation elements, which logically mirror the four well recognised phases of biological invasion: i) introduction, ii) establishment, iii) spread, iv) impact (Andersen et al., 2004).
Introduction
Evaluation of introduction usually consists of quantifying introduction likelihood and is an essential element for the development of effective management plans (Hulme et al., 2006; Roy et al., 2017). Where risk of establishment, spread and impact are high, identification and disruption of introduction pathways would be critical to averting the negative impacts. In many regions of the world there is a strong link between GDP and the number of introduced species (Hulme, 2009), and association with a particular trade or commodity can mean that data on the frequency and magnitude of shipments may be used as a proxy for introduction likelihood or, depending on the degree and consistency of the association, even the quantity of individuals introduced (Hulme et al., 2008). However, the means by which a particular species is introduced is not easily identified, unless the organism was intentionally imported directly and legally (Minchin, 2007). Even then, the means or pathway of initial introduction into the general region may be documented, but the means of subsequent movements within the region may be missing from the data (Hulme et al., 2008). This may be particularly pertinent in large contiguous areas made up of countries without hard borders/customs checks for trade (i.e. trade blocks). Introduction pathways are also not mutually exclusive for individual species. For instance, in a study of 986 introduced non-indigenous marine species in the Mediterranean, Zenetos et al. (2012) found that 11.6% (114 species) were potentially introduced via two or more pathways. In a more general study of 400 established alien taxa, using data from the
35
Global Invasive Species Database (www.issg.org/database), Hulme et al. (2008) found that less than two thirds (62. 5%) were associated with a single introduction pathway.
Establishment
Evaluation of establishment relates to estimating the likelihood of the introduced organism establishing self-sustaining populations in its new environment. Given the consensus on the magnitude of the problem posed by biological invasions, it is no surprise that identifying predictors of establishment success of introduced species has been of interest to researchers (Kolar & Lodge 2001; Lockwood et al., 2005; Hayes & Barry 2008; Bomford et al., 2009). In risk assessments, this can be evaluated in a number of ways, typically based on research-derived indicators of establishment success. These indicators fall into three broad categories: characteristics of introduction events, characteristics of the introduced organism, characteristics of the recipient environment (Hayes& Barry 2008; Rago et al., 2012).
Characteristics of introduction events
One of the most broadly applicable and seemingly universal general principles of establishment success for introduced non-native species is propagule pressure (Lockwood et al., 2005; Colautti et al., 2006). Propagule pressure, which indicates both the number of individuals introduced and the number of introduction events (see Britton & Gozlan 2013) is a strong predictor of the establishment and spread of introduced species (Levine 2000; Colautti et al.,2006; Copp et al., 2007), with greater establishment success associated with increased propagule pressure in a number of studies (Levine 2000; Kolar & Lodge 2001; Britton & Gozlan 2013). There are a
36
number of mechanisms by which propagule pressure may affect an introduced population’s establishment success. For instance, demographic stochasticity can be a critical factor in the persistence of small populations, as its strength increases as populations get smaller (Legendre et al., 1999). Further, introductions of smaller numbers of individuals tend to include lower genetic diversity and thus are more prone to reductions in mean fitness through genetic bottlenecks, genetic drift and inbreeding (i.e. inbreeding depression) (Frankham et al., 2004). Multiple introductions to the same location may counteract these issues, through the ‘rescue effect’, particularly where introductions come from multiple source populations (Sakai et al., 2001; Brook 2004; Tallmon et al., 2004). Such augmentation of genetic diversity through the introduction of individuals from a number of disparate sources may also increase adaptive potential in novel environments (Dlugosch & Parker 2008) and has been observed to enhance establishment success (Ahlroth et al.,2003), with greater numbers of sources possibly increasing success via the mechanism of heterosis (Drake 2006; Verhoeven et al., 2011). Nonetheless, altering abiotic conditions can affect the minimum propagule pressure required for successful establishment (Thomsen et al., 2006), so the role of propagule pressure can be context-dependant – regardless of how many individuals are introduced and with what frequency, if the conditions are not suitable, then they will not establish self-sustaining populations. For instance, many agricultural crops are planted in areas with climates that fail to support non-cultivated populations of them, despite high propagule pressure, yet some biological invasions originated from very low propagule pressure (Simberloff 2009). Nonetheless, propagule pressure has been used successfully in predictive models for assessing likelihood of invasion (Lambdon & Hulme 2006; Herborg et al., 2007; Herborg et al., 2009).
37
Characteristics of the introduced organism
Multiple studies have sought to identify life history traits indicative of invasiveness (Sakai et al.,2001), and have observed a number of characteristics common amongst known invaders: the ability to reproduce sexually and asexually, rapid growth and early maturity, association with humans, high fecundity, eurytopy, phenotypic plasticity, rapid dispersal, aggressive behaviour and competitiveness, polyphagy (Moyle 1986; Lodge 1993; Sakai et al.,2001; Blackburn et al.,2009; Chapple et al., 2012).
Whilst trait-based studies of invasiveness have found that certain traits that help achieve success at one stage of the invasion process may be a hindrance to success at another stage (Kolar & Lodge 2001; Ribeiro et al., 2007), a number of characteristics are generally considered as strong predictors of establishment success in novel environments. Such determinants of establishment success include traits associated with more rapid population growth, e.g. small body size, rapid growth and maturity, shorter life span and high fecundity (Duncan et al., 2001; Forsyth et al., 2004), as well as traits relating to ecological generalism, e.g. of habitat (Cassey 2002), of diet (Vall-Ilosera & Sol, 2009), or of climatic conditions (Bomford et al., 2009). These traits generally describe r-selected, or opportunistic life modes (Winemiller & Rose 1992).
Characteristics of the recipient environment
In simple terms, the ability of an organism to establish in, or colonize an area is constrained by factors that can be categorized into three broad groups: (i) physical barriers to dispersal; (ii) the spatial distribution of environmental conditions within which the species can survive, reproduce and maintain a population; and (iii) the
38
biotic element of the environment and associated interactions, including competitors, predators including parasites and pathogens, as well as the dynamics and availability of food resources (Guisan & Thuiller 2005; Soberón & Peterson 2005; Soberón 2007; Sillero 2011). This concept can be illustrated by a heuristic diagram that depicts each of the constraints and visually demonstrating how they can interact, or overlap, to identify the set of conditions and locations that are available and suitable (Fig. 1.1). The entirety of the area constrained by abiotic factors is referred to as the ‘fundamental niche’. The portion in the centre, where all three constraints interact, is typically referred to as the ‘realised niche’ and the portion constituting the intersection between the abiotic and biotic constraints is referred to as the ‘potential niche’ (Soberón & Peterson, 2005; Soberón, 2007).
Figure 1.1 Heuristic diagram, adapted from Soberón & Peterson (2005), depicting visual
representations of the three categories of constrains that determine a species distribution; Abiotic
constraints (A); Biotic constraints (B); Physical barriers to dispersal (P).