HAL Id: hal-01573161
https://hal.archives-ouvertes.fr/hal-01573161
Submitted on 8 Aug 2017HAL is a multi-disciplinary open access archive for the deposit and dissemination of sci-entific research documents, whether they are pub-lished or not. The documents may come from teaching and research institutions in France or abroad, or from public or private research centers.
L’archive ouverte pluridisciplinaire HAL, est destinée au dépôt et à la diffusion de documents scientifiques de niveau recherche, publiés ou non, émanant des établissements d’enseignement et de recherche français ou étrangers, des laboratoires publics ou privés.
Data on Displaced Populations Using Global Positioning
System (GPS)
Marion Borderon, Stefan Kienberger, Suresh Kumar, Sébastien Oliveau,
Tuhin K. Das
To cite this version:
Marion Borderon, Stefan Kienberger, Suresh Kumar, Sébastien Oliveau, Tuhin K. Das. Beyond the Lack of Data: How to Generate Spatial Data on Displaced Populations Using Global Positioning System (GPS): The Example of Populations Displaced due to Ganges Riverbank Erosion in Malda, West Bengal, India. GI_Forum Journal for Geographic Information Science, Austrian Academy of Sciences Press, 2017, 1, pp.360-368. �10.1553/giscience2017_01_s360�. �hal-01573161�
360
Beyond the Lack of Data: How to
Generate Spatial Data on
Displaced Populations Using
Global Positioning System (GPS)
Loggers
The Example of Populations Displaced due to Ganges Riverbank Erosion in Malda, West Bengal, India
GI_Forum 2017, Issue 1 Page: 360 - 368 Short Paper Corresponding Author: [email protected] DOI: 10.1553/giscience2017_01_s360
Marion Borderon1 , Stefan Kienberger2, Suresh Kumar3, Sébastien Oliveau4
and Tuhin K.5
1University of Vienna, Austria 2University of Salzburg, Austria
3Centre for Geoinformatics, New Delhi, India 4University of Aix-Marseille, France
5Jadavpur University, Kolkata
Abstract
This case study proposes an alternative spatial sampling design when there is no enumeration of the target population. Empirical studies and spatial quantitative assessments at a local scale, in the global South or in a sensitive context often face the limitations of baseline knowledge and secondary data, resulting in the challenge of choosing methods or models appropriate to the situation. Yet, to understand the vulnerability of population to disasters and improve their resilience require a clear picture of the situation. Various methods have already been proposed for sampling when data on apopulation are limited. While taking these methods and their limits into account, we presenta new approachto designa population sample by using Global Positioning Systems (GPS) loggers. GPS systems are now widely available and easy to use and are useful when it comes to collect accurate and consistent data. Astratified survey,combined with 4,095 questionnaires,was carried out in 2015 in Malda(West Bengal). The survey allowed us to capture the spatial pattern of the erosion-affected population and to better understand their vulnerability. The method therefore shows promise for use in case studies in environments where detailed geographic and human census data have eitherlimited availability orlittle relevance.
Keywords:
Global Positioning System, spatial survey sample, data-limited environment, vulnerability assessment
361
1
Introduction
The lower Ganges region in India, especially the district of West Bengal, is particularly vulnerable to climate change hazards, including slow-onset eventssuch asriverbank erosion (IPCC, 2014; Das and al., 2014). Riverbank erosion results in loss of productive land and other natural resources forthe riverine households, and threatens their livelihoods and food security. Indeed, riverbank erosion accounts for the largest losses in this region of the world (Penning-Rowsell et al. 2013; Makenro 2000). Damage from riverbank erosion occurs gradually and has long-term impacts that are irrecoverable naturally (Alametal., 2017). However, the lack of data, particularly geospatial information on the relocation pattern of displaced populations, presents a fundamental challenge in assessing the vulnerability of populations affected by riverbank erosion and in estimating their loss and damage.
At village level, few data are available. Each gram panchayatcollects information such asthe number of water points, schools or health centres, and proposes some estimate of the number of households, but no precise figure for the totalpopulation is available.1Detailedknowledge of the displaced population iseven more limited and not well documented. This limited knowledge ofthe populations and their distribution makes itimpossible to performclassical and representative random sampling of the particularpopulations of interest.
Indeed, the random probability sample is usually presentedas the gold standard to obtain a representative sample (Levy and Lemeshow, 2008). When all eligible respondents and households are known in a specific target geography, they can be countedand then randomly selected to construct a sampling frame (Kondo and al., 2014). For resource-challenged areas or contexts of rapid change, such as our case study area, an alternative that usesa stratified GPS survey is proposed. GPS systems allow more accurate and consistent data collection than estimating locations or area using paper maps or a compass and distance measurement (Martinez, 2013; DHS, 2013).
This paper presentsan original sampling method which makes it possible to carry out a spatial vulnerability assessment for apopulation in a resource-limited context.
2
Methods
Description of the area studied
In the district of Malda in West Bengal, the course of the Ganges upstream of the Farakkadamcontinues to change. Millions of rupees are spent every year on bank protection, but no rehabilitation programme for the erosion victims is in place. About 190km² of fertile
1The gram panchayat is the cornerstone of local self-government organization in India at the village or
small-town level (the panchayati raj system); each gram panchayat has a sarpanch as its elected head. In 2015, the authors managed to obtain some official data from the Gram Panchayat office of Panchanandapur I, Panchanandapur II and Bangitola.
362
land were eroded from the left bank of the river between 1931 and 1999 (Rudra, 2000). According to the Human Development Report provided by the government of West Bengal (2007), nearly 10,000 families in Malda have lost their land. These families have mostly resettled at sites in the same district. For some people, displacement and resettlement have occurred more than once as they havenot moved far from the river,even though the banks are being eroded. It is assumed that they take this risk because their occupations are linked to the river. Therefore,the rehabilitation policy forthis displaced population needs furtherinvestigation, across the various resettlement locations. A spatial overview is currently lacking. Theaim of the present study was to map precisely the spatial distribution of resettled people in order to facilitate appropriate recovery plans.2
We therefore decided to concentrate on the Malda region, and in particular on one of the most severely affected ‘Blocks’:KaliachakII. Impacted by the left-bank erosion of the Ganges upstream of the Farakkadam, this rural community development block comprises a population of 210,105 (Chandramouli, 2011), a proportion of whomhave been displaced due to the hazard. The block is divided into eight gram panchayats(GPs), comprises 41 gram sansads,3 and around 16,000 households. The study has focused on the three most affected GPs of this district. The affected GPs in this Block have been listedand a complete listing ofgram sansads has also been prepared, from the data of the gram panchayat offices of Panchanandapur I, Panchanandapur II and Bangitola.
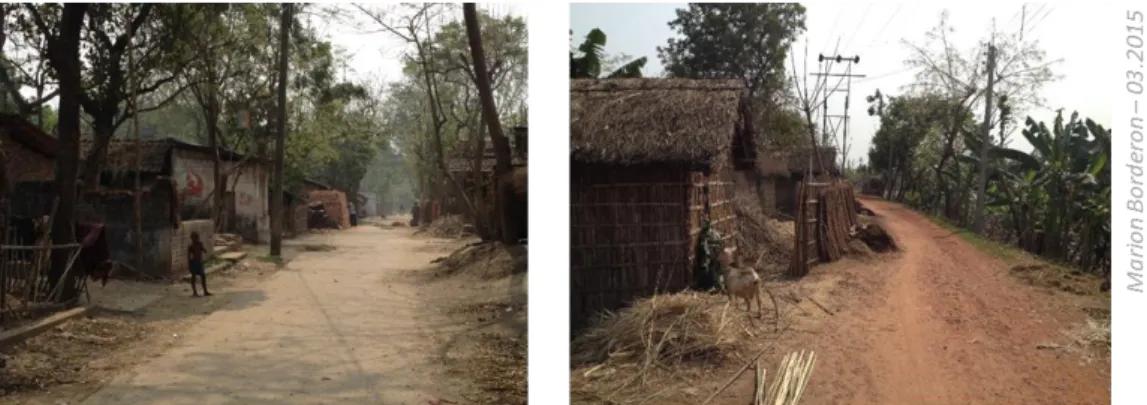
The gram sansadsweredivided into three categories, in which: (1) all the households are displaced people due to riverbank erosion; (2) the households are a mixture of displaced and displaced people; (3) all the households are displaced people. (In this context, non-displaced people means people not affected by the riverbank erosion.) This leads to different types of settlement (Figure 1).
For the GPs selected, it was decided to investigate exhaustively all the gram sansads. Carrying out the cross-sectional survey in all 41 gram sansadswas justified by the fact that displacement is often a collective process. Several households from the same village moved simultaneously and resettled together in a new place. To investigate too few would risk a high clustering effect and a biased picture of the spatial situation.
2The question of displaced households and relocation can be a highly sensitive issue. The local
staff who conducted the survey, the households investigated and the members of the project have been made aware that the data can only be used for scientific purposes: assessing the vulnerability of the displaced groups compared to the non-displaced groups. No other individuals or institutions may use these data for any purpose. Ethical clearance has been sought and obtained, and the data have been made anonymous.
363
Figure 1: Examples of three types of villages, Kaliachak II Block, Malda, West Bengal, India
Sampling Design
The objective was to provide the following missing data:
(i) type of village (with displaced households, non-displaced households, or with a mixture of both)
(ii) proportion of each group per village (iii) size of each household
364 (v) presence of children (or not)
(vi) information on displacement (or not) and its consequences.
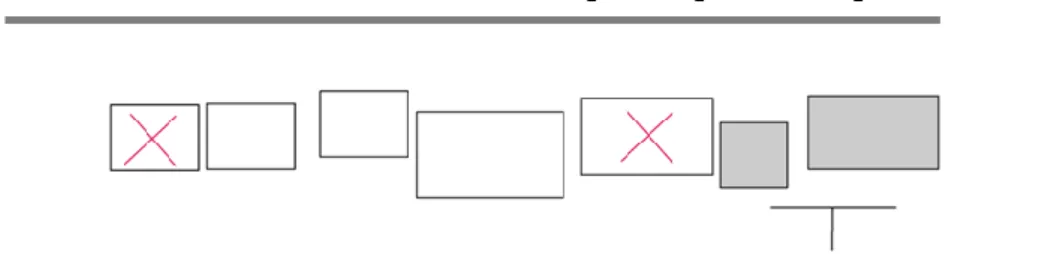
Taking into accountthe available budget and time limitations, we decided that the maximum number of households which could be investigated wasaround 4,000, that is around 25% of the total population studied. As we did nothave the number of households in each village, or an exhaustive list of the addresses for each household, a specific sampling technique was used to choose randomly the households that we would investigate. Each team of enumerators would interview one in four households in each village. A starting point in the village was chosen at random, from which the investigators visited each street to identify one household thenskip three,before starting again (see Figure 2). This method for selecting households was inspired by the ‘random walk’ method (Turner etal., 1996; Miliganetal., 2004). Each time a choice had to be made (for example to go right or left at the end of a street), a random procedure was repeated (similar to the game ‘pitch and toss’). Thus, a random direction was selected each time a bifurcation was encountered. This sampling technique is referred to as stratified random sampling. The advantage is that it guarantees that specific groups are represented in the sample(s), even proportionally, by selecting households from the strata list (the village list). The disadvantage is that at the end of the investigation of avillage, one, two or three houses can remain outside of the procedure (see Figure2).The sampling procedure is also complex and requires greater effort than a simple random technique.
Figure 2: Potential bias for sampling procedure: the threshold of one householdin four
3
Preliminary Results
The survey was carried out in February–March 2015, by a team of 10 trained interviewers under the supervision of a GPS coordinator. The teams were trained in the use of GPS loggers before the official launch of the survey. Additionally, the questionnaire was tested during the pre-test phase and slightly adjusted.
365
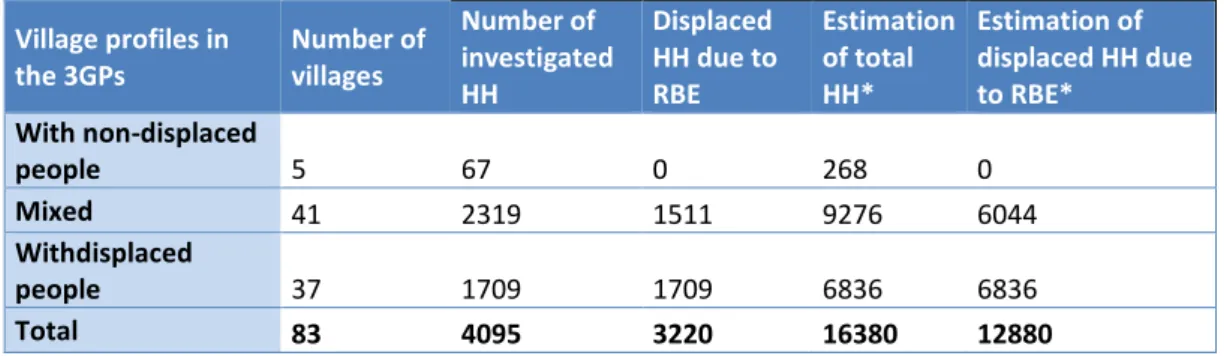
4,095questionnaires allowed us to overcome the difficulties of investigating hard-to-surveypopulations and to assess the spatial pattern of these displaced households in a data-limited context (Table 1).
Table 1: Estimate of the proportionof households (HH) displaced due to riverbank erosion (RBE) and non-displaced in the 83 localities (of the 41 gram sansads)
Village profiles in the 3GPs Number of villages Number of investigated HH Displaced HH due to RBE Estimation of total HH* Estimation of displaced HH due to RBE* With non-displaced people 5 67 0 268 0 Mixed 41 2319 1511 9276 6044 Withdisplaced people 37 1709 1709 6836 6836 Total 83 4095 3220 16380 12880
* 25% of the households in each village in the 3 GPs studied were investigated,chosen according to the spatially random procedure described above. The total number of households and the proportion of displaced households were estimated according to this proportion.
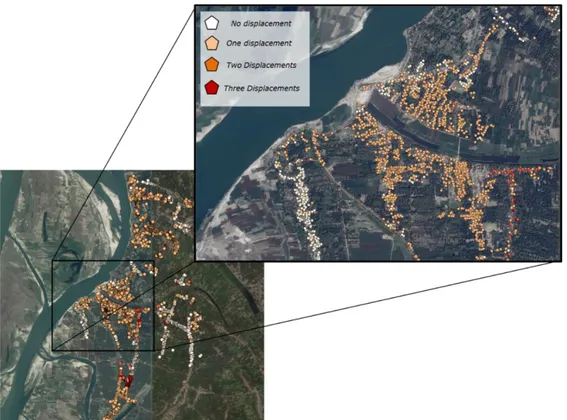
The use of GPS tracking provides a better understanding of the relocation patterns around the Ganges River and allows us to obtain a representative survey sample wherequantitative and spatial data were not previously available.An accuracy assessment cannot, however,be carried out as there is no reference dataset. Nevertheless, when the collected data are aggregated, they show consistency and fit with the current census data. The proportion and the location of the displaced and non-displaced people per village can be estimated. In Figure 3, the clustered aspects of the groups (non-affected (=not displaced), affected once so far (=one displacement), or affected several times (= several displacements)) is evidence for the clustered aspects of the relocation patterns.
366
Figure 3: Overview of the location of the displaced and non-displaced householdsinvestigated The households should be seen less as individualentities and more as belonging to a social community. (In this rural area, the community is linked to working activities; many work as day labourers, smallholders, fishermen, or in service-related activities, for example). The dates of the displacements are often the same between households, and they tend to resettle together. When they donotresettle inan existing village, they sometimes occupy land and use the name of their former village to designate their new location. Further analyses of our data have also pointed out the linkbetween the vulnerability of households to erosion and their occupation. When the livelihoods of the community are linked to river activities, their vulnerability to riverbank erosion is maximal.
4
Conclusion and outlook
A stratified random spatial sampling method was used to design a cross-sectional survey and thus to map precisely the pattern of disaster-affected and non-affected populations in a region where maps, and household or address lists are not available. In the district of Malda, West Bengal, this has significantly increased knowledge aboutthe relocation of populations affected by riverbank erosion.
367
This sampling strategy was designed to generate a representative sample of the studied population while reducing the potential for bias, and took into consideration the specific challenges of the study area. This strategy, or variations on it, is adaptable and should be considered and tested in other sensitive settings. The methodology is promising for use in developing nations with resource-challenged environments where detailed geographic and demographic data are less readily available, or when dealing with dynamic environmental and population changes.
Acknowledgements
This study received funding from the European Union Seventh Framework Programme under Grant Agreement Number 607960. The authors would like to thank their collaborators from the Planning and Development Unit, Jadavpur University, India, and the Centrefor Research on the Epidemiology of Disasters, Universitécatholique de Louvain, Belgium.
References
Alam, G. M., Alam, K., Mushtaq, S., & Clarke, M. L. (2017). Vulnerability to climatic change in riparian char and river-bank households in Bangladesh: implication for policy, livelihoods and social development. Ecological Indicators, 72, 23-32.
Chandramouli, C., (2011). Census of India 2011. Provisional Population Totals. New Delhi: Government of
India.
Das, T. K., Haldar, S. K., Gupta, I. D., & Sen, S. (2014). River Bank Erosion Induced Human Displacement and Its Consequences. Living Rev. Landscape Res., 8.
Development & Planning Department Government of West Bengal. (2007). District Human Development Report Malda, 228p.
http://wbplan.gov.in/htm/HumanDev/Human%20Development%20Malda.pdf DHS GPS manual (2013). Incorporating geographic information into demographic and health
surveys: A Field Guide to GPS Data Collection.
http://dhsprogram.com/publications/publication-dhsm9-dhs-questionnaires-and-manuals.cfm. Kondo, M. C., Bream, K. D., Barg, F. K., &Branas, C. C. (2014). A random spatial sampling method
in a rural developing nation. BMC public health, 14(1), 338.
Levy, P. S., &Lemeshow, S. (2008). Sampling of populations: methods and applications, 4th Edition.
John Wiley & Sons, 616p.
Makenro, M.B. (2000). World Disaster Report, 2001, International Federation of the Red Cross and Red Crescent Societies (IFRCS), Geneva.
Martínez, L. I. (2013). Improving the use of GPS, GIS and RS for setting up a master sampling frame, report for FAO, 32p.
Milligan P, Njie A, Bennett S. (2004). Comparison of two cluster sampling methods for health surveys in developing countries. International Journal of Epidemiology;33:469e76.
Pachauri, R. K., Meyer, L., Plattner, G. K., & Stocker, T. (2014). IPCC, 2014: Climate Change 2014:
Synthesis Report. Contribution of Working Groups I, II and III to the Fifth Assessment Report of the Intergovernmental Panel on Climate Change. IPCC.
368
Penning-Rowsell, E. C., Sultana, P., & Thompson, P. M. (2013). The ‘last resort’? Population movement in response to climate-related hazards in Bangladesh. Environmental science & policy, 27, S44-S59.
Rudra, K. (2000). Living on the edge: the experience along the bank of the Ganga in Malda district, West Bengal. Indian Journal of Geography & Environment, 5, 57-67.
Turner AG, Magnani RJ, Shuaib M. (1996). A not quite as quick but much cleaner alternative to the expanded programme on immunization (EPI) cluster survey design. International Journal of