Publisher’s version / Version de l'éditeur:
Vous avez des questions? Nous pouvons vous aider. Pour communiquer directement avec un auteur, consultez la première page de la revue dans laquelle son article a été publié afin de trouver ses coordonnées. Si vous n’arrivez pas à les repérer, communiquez avec nous à [email protected].
Questions? Contact the NRC Publications Archive team at
[email protected]. If you wish to email the authors directly, please see the first page of the publication for their contact information.
https://publications-cnrc.canada.ca/fra/droits
L’accès à ce site Web et l’utilisation de son contenu sont assujettis aux conditions présentées dans le site LISEZ CES CONDITIONS ATTENTIVEMENT AVANT D’UTILISER CE SITE WEB.
Technical Report (National Research Council of Canada. Ocean, Coastal and River Engineering), 2017-03
READ THESE TERMS AND CONDITIONS CAREFULLY BEFORE USING THIS WEBSITE.
https://nrc-publications.canada.ca/eng/copyright
NRC Publications Archive Record / Notice des Archives des publications du CNRC :
https://nrc-publications.canada.ca/eng/view/object/?id=82a99377-4525-444d-ab2d-52b3c3fc2cd9 https://publications-cnrc.canada.ca/fra/voir/objet/?id=82a99377-4525-444d-ab2d-52b3c3fc2cd9
For the publisher’s version, please access the DOI link below./ Pour consulter la version de l’éditeur, utilisez le lien DOI ci-dessous.
https://doi.org/10.4224/40000375
Access and use of this website and the material on it are subject to the Terms and Conditions set forth at
Residual waves and their possible damping time in the OEB Zaman, Hasanat; Akinturk, Ayhan
OCRE-TR-2017-007
Residual waves and their possible damping
time in the OEB
Technical Report – Unclassified OCRE-TR-2017-007 Document Version 10 Hasanat Zaman Ayhan Akinturk St. John’s, NL March 2017
National Research Council Conseil national de recherches
Canada Canada
Ocean, Coastal and River Génie océanique, côtier et fluvial Engineering
Residual waves and their possible damping time in the OEB
Technical Report – UNCLASSIFIED OCRE-TR-2017-007
Hasanat Zaman, Ayhan Akinturk March, 2017
Acknowledgements
The authors would like to acknowledge and thank the contributions of the various individuals as well as groups of individuals who contributed to the completion of this project. All personnel, who have contributed to this project from Ocean Coastal and River Engineering (OCRE) portfolio, deserve our sincere gratitude. Without their contributions, this project could not have been completed.
Executive Summary
After the termination of wave making, the characteristics and decays’ of the existing wave components in a 3D large scale Offshore Engineering wave Basin (OEB) at Ocean, Coastal and River Engineering (OCRE) portfolio of the National Research Council of Canada have been investigated experimentally. Measured experimental time series data are analysed to identify the time required to reach the surface undulation to a pre-set threshold of 0.5mm. This threshold is assumed to be the allowable undulation of the free surface in the OEB to generate next wave. In the present work regular and irregular waves are used. From a set of experimental wave data obtained from OEB, the settling time of the water surface can be calculated using a threshold. In the present analysis comparisons of the surface elevations are done for regular and irregular waves for two different waiting times such as 20 minutes and calculated waiting time [when waves are generated with free surface undulation is between 0 and 0.5mm].
In the analysis it is observed that the energy damping rate varies with the incident wave conditions, such as water depth, wave height and period. It is observed from the analysis of the experimental data that for most of the cases damping time is much faster than that of 20 minutes traditional waiting time in between two runs in the OEB. Again for very low frequency waves it is perceived that they need more than 20 minutes in reaching the accepted threshold level, 0.5mm.
Figures are produced to predict the waiting time for a given wave when the wave steepness is known beforehand.
Table of Contents
Acknowledgements ... i
Executive Summary ... i
Table of Contents ... iii
List of Figures ... iv List of Tables ... ix 1 Introduction ... 1 1.1 Background... 1 1.2 Project object ... 1 2 Experimental Facility ... 2
2.1 Offshore Engineering Basin (OEB) ... 2
2.1.1 Experimental setup ... 3
3 Instrumentation ... 4
3.1 Data Acquisition System (DAS) ... 4
3.1.1 Wave Probes (WP) ... 4
4 Test Matrix ... 5
4.1 Description of the tests ... 5
5 Analysis and Results ... 8
5.1 First run and identify the threshold point ... 8
5.2 Regular wave comparisons ... 11
5.2.1 Regular waves in deep water ... 11
5.2.2 Regular waves in shallow water ... 19
5.2.3 Repeating cases in deep water regular wave ... 31
5.2.4 Repeatability statistics for deep water regular waves ... 36
5.2.5 Repeating cases in shallow water regular wave ... 40
5.2.6 Repeatability statistics for shallow water regular waves ... 45
5.3 Relationship between wave steepness and OEB settling time ... 48
5.3.1 Deep water: Regular waves ... 48
5.3.2 Shallow water: Regular waves ... 49
5.4 Irregular wave comparisons... 50
5.4.1 Irregular waves in deep water ... 50
5.4.2 Deep water: Irregular waves ... 52
5.4.3 Irregular waves in shallow water ... 52
5.4.4 Shallow water: Irregular waves ... 55
6 Conclusion ... 56
7 Limitations ... 57
8 References ... 57
APPENDIX A - Regular Waves in Deep Water (Repeating Case included) ... 1
List of Figures
Figure 1 Offshore Engineering Basin (OEB) ... 2
Figure 2 Locations of the wave probes in the OEB shown in red circle ... 3
Figure 3 Show arbitrary surface elevation data and relevant time in reaching to undulation 0.5mm at a given location in the OEB. “0” after green boarder on the figures show the
time when wave was stopped. ... 9
Figure 4 Show amplitude spectrums for two arbitrary cases (a) settling quickly; (b) needs more time to settle ... 10 Figure 5 Comparisons of surface elevation at different probe location between Test 1 and Test 3 (Deep water: h=1.826m, T=1.4s, H=0.03m and H/L=0.01) Probes 10, 11, 12, 13 and 14 from top ... 12 Figure 6 Comparisons of surface elevation at different probe location between Test 2 and Test 3 (Deep water: h=1.826m, T=1.4s, H=0.03m and H/L=0.01) Probes 10, 11, 12, 13 and 14 from top ... 13 Figure 7 Comparisons of surface elevation at different probe location among Test 1, Test
2 and Test 3 (Deep water: h=1.826m, T=1.4s, H=0.03m and H/L=0.01) ... 14
Figure 8 Comparisons of surface elevation at different probe location among Test 4, Test
5 and Test 6 (Deep water: h=1.826m, T=1.4s, H=0.09m and H/L=0.03) ... 15
Figure 9 Comparisons of surface elevation at different probe location among Test 7, Test 8 and Test 9 (Deep water: h=1.826m, T=1.4s, H=0.15m and H/L=0.05) Probes 10, 11, 12, 13 and 14 from top ... 16 Figure 10 Comparisons of surface elevation at different probe location among Test 10,
Test 11 and Test 12 (Deep water: h=1.826m, T=1.4s, H=0.213m and H/L=0.07) ... 17
Figure 11 Comparisons of surface elevation at different probe location among Test 13,
Test 14 and Test 15 (Deep water: h=1.826m, T=1.40s, H=0.274m and H/L=0.09) ... 18
Figure 12 Comparisons of surface elevation at different probe location among Test 16, Test 17 and Test 18 (Shallow water: h=1.826m, T=4.583s, H=0.1826m, h/L=0.1 and H/L=0.01)... 20 Figure 13 Comparisons of surface elevation at different probe location among Test 19, Test 20 and Test 21 (Shallow water: h=1.826m, T=4.583s, H=0.1826m , h/L=0.1 and H/L=0.03)... 21 Figure 14 Comparisons of surface elevation at different probe location among Test 25, Test 26 and Test 27 (Shallow water: h=1.826m, T=2.623s, H=0.091m, h/L=0.2 and H/L=0.01)... 22 Figure 15 Comparisons of surface elevation at different probe location among Test 28, Test 29 and Test 30 (Shallow water: h=1.826m, T=2.623s, H=0.273m , h/L=0.2 and H/L=0.03)... 23 Figure 16 Comparisons of surface elevation at different probe location among Test 31, Test 32 and Test 33 (Shallow water: h=1.826m, T=2.623s, H=0.456m, h/L=0.2 and H/L=0.05)... 24 Figure 17 Comparisons of surface elevation at different probe location among Test 34, Test 35 and Test 36 (Shallow water: h=1.826m, T=2.623s, H=0.639m, h/L=0.2 and H/L=0.07)... 25
Figure 18 Comparisons of surface elevation at different probe location among Test 37, Test 38 and Test 39 (Shallow water: h=1.826m, T=2.623s, H=0.821m, h/L=0.2 and
H/L=0.09)... 26
Figure 19 Comparisons of surface elevation at different probe location among Test 40, Test 41 and Test 42 (Shallow water: h=1.826m, T=2.02s, H=0.061m, h/L=0.3 and H/L=0.01)... 27
Figure 20 Comparisons of surface elevation at different probe location among Test 43, Test 44 and Test 45 (Shallow water: h=1.826m, T=2.02s, H=0.1824m, h/L=0.3 and H/L=0.03)... 28
Figure 21 Comparisons of surface elevation at different probe location among Test 46, Test 47 and Test 48 (Shallow water: h=1.826m, T=2.02s, H=0.304m, h/L=0.3 and H/L=0.05)... 29
Figure 22 Comparisons of surface elevation at different probe location among Test 49, Test 50 and Test 51 (Shallow water: h=1.826m, T=2.02s, H=0.425m, h/L=0.3 and H/L=0.07)... 30
Figure 23 Test 5: (a) Comparisons of ten runs at Probe-10, (b) Comparisons of crests and (c) Comparisons of troughs ... 32
Figure 24 Test 5: (a) Comparisons of ten runs at Probe-11, (b) Comparisons of crests and (c) Comparisons of troughs ... 32
Figure 25 Test 4: (a) Comparisons of ten runs at Probe-11, (b) Comparisons of crests and (c) Comparisons of troughs ... 32
Figure 26 Test 5: (a) Comparisons of ten runs at Probe-12, (b) Comparisons of crests and (c) Comparisons of troughs ... 33
Figure 27 Test 5: (a) Comparisons of ten runs at Probe-13, (b) Comparisons of crests and (c) Comparisons of troughs ... 34
Figure 28 Test 5: (a) Comparisons of ten runs at Probe-14, (b) Comparisons of crests and (c) Comparisons of troughs ... 35
Figure 29 Sample time series for peaks and crests for deep water waves ... 36
Figure 30 Histograms of the variations for the crests and troughs ... 38
Figure 31 Test 17: (a) Comparisons of ten runs at Probe-10, (b) Comparisons of crests and (c) Comparisons of troughs ... 40
Figure 32 Test 17: (a) Comparisons of ten runs at Probe-11, (b) Comparisons of crests and (c) Comparisons of troughs ... 41
Figure 33 Test 17: (a) Comparisons of ten runs at Probe-12, (b) Comparisons of crests and (c) Comparisons of troughs ... 42
Figure 34 Test 17: (a) Comparisons of ten runs at Probe-13, (b) Comparisons of crests and (c) Comparisons of troughs ... 43
Figure 35 Test 17: (a) Comparisons of ten runs at Probe-14, (b) Comparisons of crests and (c) Comparisons of troughs ... 44
Figure 36 Sample time series for peaks and crests for shallow water waves ... 45
Figure 37 Histograms of the variations for the crests and troughs ... 47
Figure 38 Variations of settling time with wave steepness in deep water ... 49
Figure 39 Variations of settling time with wave steepness in shallow water ... 50
Figure 40 Comparisons of surface elevation at different probe location among Test 55, Test 56 and Test 57 (Deep water: h=1.826m, Tp=1.69s, H1/3=0.2154m) Probes 10, 11, 12, 13 and 14 ... 51
Figure 41 Variations of settling time with significant wave height and period in deep
water ... 52
Figure 42 Comparisons of surface elevation at different probe location among Test 58, Test 59 and Test 60 (Shallow water: h=1.826m, Tp=1.955s, H1/3=0.267m) Probes 10, 11, 12, 13 and 14 ... 53
Figure 43 Comparisons of surface elevation at different probe location among Test 61, Test 62 and Test 63 (Shallow water: h=1.826m, Tp=2.635s, H1/3=0.352m) Probes 10, 11, 12, 13 and 14 ... 54
Figure 44 Variations of settling time with significant wave height and period in shallow water ... 55
Figure 45 Test 4 run on calm water at Probe 10 ... 4
Figure 46 Test 5a (Test 5 with 4.3 minutes waiting time, RUN-1) at Probe 10 ... 5
Figure 47 Test 5a (Test 5 with 4.3 minutes waiting time, RUN-2) at Probe 10 ... 6
Figure 48 Test 5a (Test 5 with 4.3 minutes waiting time, RUN-3) at Probe 10 ... 7
Figure 49 Test 5a (Test 5 with 4.3 minutes waiting time, RUN-4) at Probe 10 ... 8
Figure 50 Test 5a (Test 5 with 4.3 minutes waiting time, RUN-5) at Probe 10 ... 9
Figure 51 Test 5a (Test 5 with 4.3 minutes waiting time, RUN-6) at Probe 10 ... 10
Figure 52 Test 5a (Test 5 with 4.3 minutes waiting time, RUN-7) at Probe 10 ... 11
Figure 53 Test 5a (Test 5 with 4.3 minutes waiting time, RUN-8) at Probe 10 ... 12
Figure 54 Test 5a (Test 5 with 4.3 minutes waiting time, RUN-9) at Probe 10 ... 13
Figure 55 Test 5a (Test 5 with 4.3 minutes waiting time, RUN-10) at Probe 10 ... 14
Figure 56 Test 6 with 4.3 minutes waiting time at Probe 10 ... 15
Figure 57 Test 4 run on calm water at Probe 11 ... 17
Figure 58 Test 5a (Test 5 with 4.3 minutes waiting time, RUN-1) at Probe 11 ... 18
Figure 59 Test 5a (Test 5 with 4.3 minutes waiting time, RUN-2) at Probe 11 ... 19
Figure 60 Test 5a (Test 5 with 4.3 minutes waiting time, RUN-3) at Probe 11 ... 20
Figure 61 Test 5a (Test 5 with 4.3 minutes waiting time, RUN-4) at Probe 11 ... 21
Figure 62 Test 5a (Test 5 with 4.3 minutes waiting time, RUN-5) at Probe 11 ... 22
Figure 63 Test 5a (Test 5 with 4.3 minutes waiting time, RUN-6) at Probe 11 ... 23
Figure 64 Test 5a (Test 5 with 4.3 minutes waiting time, RUN-7) at Probe 11 ... 24
Figure 65 Test 5a (Test 5 with 4.3 minutes waiting time, RUN-8) at Probe 11 ... 25
Figure 66 Test 5a (Test 5 with 4.3 minutes waiting time, RUN-9) at Probe 11 ... 26
Figure 67 Test 5a (Test 5 with 4.3 minutes waiting time, RUN-10) at Probe 11 ... 27
Figure 68 Test 6 with 4.3 minutes waiting time at Probe 11 ... 28
Figure 69 Test 4 run on calm water at Probe 12 ... 30
Figure 70 Test 5a (Test 5 with 4.3 minutes waiting time, RUN-1) at Probe 12 ... 31
Figure 71 Test 5a (Test 5 with 4.3 minutes waiting time, RUN-2) at Probe 12 ... 32
Figure 72 Test 5a (Test 5 with 4.3 minutes waiting time, RUN-3) at Probe 12 ... 33
Figure 73 Test 5a (Test 5 with 4.3 minutes waiting time, RUN-4) at Probe 12 ... 34
Figure 74 Test 5a (Test 5 with 4.3 minutes waiting time, RUN-5) at Probe 12 ... 35
Figure 75 Test 5a (Test 5 with 4.3 minutes waiting time, RUN-6) at Probe 12 ... 36
Figure 76 Test 5a (Test 5 with 4.3 minutes waiting time, RUN-7) at Probe 12 ... 37
Figure 77 Test 5a (Test 5 with 4.3 minutes waiting time, RUN-8) at Probe 12 ... 38
Figure 78 Test 5a (Test 5 with 4.3 minutes waiting time, RUN-9) at Probe 12 ... 39
Figure 79 Test 5a (Test 5 with 4.3 minutes waiting time, RUN-10) at Probe 12 ... 40
Figure 80 Test 6 with 4.3 minutes waiting time at Probe 12 ... 41
Figure 82 Test 5a (Test 5 with 4.3 minutes waiting time, RUN-1) at Probe 13 ... 44
Figure 83 Test 5a (Test 5 with 4.3 minutes waiting time, RUN-10) at Probe 2 ... 45
Figure 84 Test 5a (Test 5 with 4.3 minutes waiting time, RUN-3) at Probe 13 ... 46
Figure 85 Test 5a (Test 5 with 4.3 minutes waiting time, RUN-4) at Probe 13 ... 47
Figure 86 Test 5a (Test 5 with 4.3 minutes waiting time, RUN-5) at Probe 13 ... 48
Figure 87 Test 5a (Test 5 with 4.3 minutes waiting time, RUN-6) at Probe 13 ... 49
Figure 88 Test 5a (Test 5 with 4.3 minutes waiting time, RUN-7) at Probe 13 ... 50
Figure 89 Test 5a (Test 5 with 4.3 minutes waiting time, RUN-8) at Probe 13 ... 51
Figure 90 Test 5a (Test 5 with 4.3 minutes waiting time, RUN-9) at Probe 13 ... 52
Figure 91 Test 5a (Test 5 with 4.3 minutes waiting time, RUN-10) at Probe 13 ... 53
Figure 92 Test 6 with 4.3 minutes waiting time at Probe 13 ... 54
Figure 93 Test 4 run on calm water at Probe 14 ... 56
Figure 94 Test 5a (Test 5 with 4.3 minutes waiting time, RUN-1) at Probe 14 ... 57
Figure 95 Test 5a (Test 5 with 4.3 minutes waiting time, RUN-2) at Probe 14 ... 58
Figure 96 Test 5a (Test 5 with 4.3 minutes waiting time, RUN-3) at Probe 14 ... 59
Figure 97 Test 5a (Test 5 with 4.3 minutes waiting time, RUN-4) at Probe 14 ... 60
Figure 98 Test 5a (Test 5 with 4.3 minutes waiting time, RUN-5) at Probe 14 ... 61
Figure 99 Test 5a (Test 5 with 4.3 minutes waiting time, RUN-6) at Probe 14 ... 62
Figure 100 Test 5a (Test 5 with 4.3 minutes waiting time, RUN-7) at Probe 14 ... 63
Figure 101 Test 5a (Test 5 with 4.3 minutes waiting time, RUN-8) at Probe 14 ... 64
Figure 102 Test 5a (Test 5 with 4.3 minutes waiting time, RUN-9) at Probe 14 ... 65
Figure 103 Test 5a (Test 5 with 4.3 minutes waiting time, RUN-10) at Probe 14 ... 66
Figure 104 Test 6 with 4.3 minutes waiting time at Probe 14 ... 67
Figure 105 Test 16 run on calm water at Probe 10 ... 4
Figure 106 Test 17a (Test 17 with 5.52 minutes waiting time, RUN-1) at Probe 10 ... 5
Figure 107 Test 17a (Test 17 with 5.52 minutes waiting time, RUN-2) at Probe 10 ... 6
Figure 108 Test 17a (Test 17 with 5.52 minutes waiting time, RUN-3) at Probe 10 ... 7
Figure 109 Test 17a (Test 17 with 5.52 minutes waiting time, RUN-4) at Probe 10 ... 8
Figure 110 Test 17a (Test 17 with 5.52 minutes waiting time, RUN-5) at Probe 10 ... 9
Figure 111 Test 17a (Test 17 with 5.52 minutes waiting time, RUN-6) at Probe 10 ... 10
Figure 112 Test 17a (Test 17 with 5.52 minutes waiting time, RUN-7) at Probe 10 ... 11
Figure 113 Test 17a (Test 17 with 5.52 minutes waiting time, RUN-8) at Probe 10 ... 12
Figure 114 Test 17a (Test 17 with 5.52 minutes waiting time, RUN-9) at Probe 10 ... 13
Figure 115 Test 17a (Test 17 with 5.52 minutes waiting time, RUN-10) at Probe 10 ... 14
Figure 116 Test 18 with 5.52 minutes waiting time at Probe 10 ... 15
Figure 117 Test 16 run on calm water at Probe 11 ... 17
Figure 118 Test 17a (Test 17 with 5.52 minutes waiting time, RUN-1) at Probe 11 ... 18
Figure 119 Test 17a (Test 17 with 5.52 minutes waiting time, RUN-2) at Probe 11 ... 19
Figure 120 Test 17a (Test 17 with 5.52 minutes waiting time, RUN-3) at Probe 11 ... 20
Figure 121 Test 17a (Test 17 with 5.52 minutes waiting time, RUN-4) at Probe 11 ... 21
Figure 122 Test 17a (Test 17 with 5.52 minutes waiting time, RUN-5) at Probe 11 ... 22
Figure 123 Test 17a (Test 17 with 5.52 minutes waiting time, RUN-6) at Probe 11 ... 23
Figure 124 Test 17a (Test 17 with 5.52 minutes waiting time, RUN-7) at Probe 11 ... 24
Figure 125 Test 17a (Test 17 with 5.52 minutes waiting time, RUN-8) at Probe 11 ... 25
Figure 126 Test 17a (Test 17 with 5.52 minutes waiting time, RUN-9) at Probe 11 ... 26
Figure 127 Test 17a (Test 17 with 5.52 minutes waiting time, RUN-10) at Probe 11 ... 27
Figure 129 Test 16 run on calm water at Probe 12 ... 30
Figure 130 Test 17a (Test 17 with 5.52 minutes waiting time, RUN-1) at Probe 12 ... 31
Figure 131 Test 17a (Test 17 with 5.52 minutes waiting time, RUN-2) at Probe 12 ... 32
Figure 132 Test 17a (Test 17 with 5.52 minutes waiting time, RUN-3) at Probe 12 ... 33
Figure 133 Test 17a (Test 17 with 5.52 minutes waiting time, RUN-4) at Probe 12 ... 34
Figure 134 Test 17a (Test 17 with 5.52 minutes waiting time, RUN-5) at Probe 12 ... 35
Figure 135 Test 17a (Test 17 with 5.52 minutes waiting time, RUN-6) at Probe 12 ... 36
Figure 136 Test 17a (Test 17 with 5.52 minutes waiting time, RUN-7) at Probe 12 ... 37
Figure 137 Test 17a (Test 17 with 5.52 minutes waiting time, RUN-8) at Probe 12 ... 38
Figure 138 Test 17a (Test 17 with 5.52 minutes waiting time, RUN-9) at Probe 12 ... 39
Figure 139 Test 17a (Test 17 with 5.52 minutes waiting time, RUN-10) at Probe 12 ... 40
Figure 140 Test 18 with 5.52 minutes waiting time at Probe 12 ... 41
Figure 141 Test 16 run on calm water at Probe 13 ... 43
Figure 142 Test 17a (Test 17 with 5.52 minutes waiting time, RUN-1) at Probe 13 ... 44
Figure 143 Test 17a (Test 17 with 5.52 minutes waiting time, RUN-2) at Probe 13 ... 45
Figure 144 Test 17a (Test 17 with 5.52 minutes waiting time, RUN-3) at Probe 13 ... 46
Figure 145 Test 17a (Test 17 with 5.52 minutes waiting time, RUN-4) at Probe 13 ... 47
Figure 146 Test 17a (Test 17 with 5.52 minutes waiting time, RUN-5) at Probe 13 ... 48
Figure 147 Test 17a (Test 17 with 5.52 minutes waiting time, RUN-6) at Probe 13 ... 49
Figure 148 Test 17a (Test 17 with 5.52 minutes waiting time, RUN-7) at Probe 13 ... 50
Figure 149 Test 17a (Test 17 with 5.52 minutes waiting time, RUN-8) at Probe 13 ... 51
Figure 150 Test 17a (Test 17 with 5.52 minutes waiting time, RUN-9) at Probe 13 ... 52
Figure 151 Test 17a (Test 17 with 5.52 minutes waiting time, RUN-10) at Probe 13 ... 53
Figure 152 Test 18 with 5.52 minutes waiting time at Probe 13 ... 54
Figure 153 Test 16 run on calm water at Probe 14 ... 56
Figure 154 Test 17a (Test 17 with 5.52 minutes waiting time, RUN-1) at Probe 14 ... 57
Figure 155 Test 17a (Test 17 with 5.52 minutes waiting time, RUN-2) at Probe 14 ... 58
Figure 156 Test 17a (Test 17 with 5.52 minutes waiting time, RUN-3) at Probe 14 ... 59
Figure 157 Test 17a (Test 17 with 5.52 minutes waiting time, RUN-4) at Probe 14 ... 60
Figure 158 Test 17a (Test 17 with 5.52 minutes waiting time, RUN-5) at Probe 14 ... 61
Figure 159 Test 17a (Test 17 with 5.52 minutes waiting time, RUN-6) at Probe 14 ... 62
Figure 160 Test 17a (Test 17 with 5.52 minutes waiting time, RUN-7) at Probe 14 ... 63
Figure 161 Test 17a (Test 17 with 5.52 minutes waiting time, RUN-8) at Probe 14 ... 64
Figure 162 Test 17a (Test 17 with 5.52 minutes waiting time, RUN-9) at Probe 14 ... 65
Figure 163 Test 17a (Test 17 with 5.52 minutes waiting time, RUN-10) at Probe 14 ... 66
List of Tables
Table 1 Locations of the wave probes in the OEB ... 4
Table 2 Test Matrix ... 5
Table 3 Basic statistics for the first run (Wait time ≥ 20 minutes) ... 37
Table 4 Differences of means of Runs 2 to 10 compared to the mean of the baseline run (1st Run) ... 39
Table 5 Basic statistics for the first run (Wait time ≥ 20 minutes) ... 46
Table 6 Differences of means of Runs 2 to 10 compared to the mean of the baseline run (1st Run) ... 48
Table 5 Basic statistics for Probe-10 ... 3
Table 6 Basic statistics for Probe-11 ... 16
Table 7 Basic statistics for Probe-12 ... 29
Table 8 Basic statistics for Probe-13 ... 42
Table 9 Basic statistics for Probe-14 ... 55
Table 10 Basic statistics for Probe-10 ... 3
Table 11 Basic statistics for Probe-11 ... 16
Table 12 Basic statistics for Probe-12 ... 29
Table 13 Basic statistics for Probe-13 ... 42
1 Introduction
1.1 Background
The optimization of the waiting time is very important to increase the utilization of the OEB and thus can accommodate more projects to earn more revenue.
After the termination of wave making, the characteristics and decaying of the existing wave components in a 3D large scale Offshore Engineering wave Basin (OEB) at Ocean, Coastal and River Engineering (OCRE) portfolio of the National Research Council of Canada have been investigated experimentally. Experiments were carried out for regular and irregular waves on deep and shallow water depth. For a test case we first ran a wave say for 3 minutes, then wave making was stopped but data was captured for a prolonged time (20 minutes or more) until the free surface reaching to a level of 0.5mm. From this data the time requires (waiting time) for the surface elevation to reach to a pre-set undulation level was computed. The same wave as above generated again for 3 minutes, then the wave making was stopped and wait until the “waiting time” that obtained from the first run data set. The basin is now ready for the third run. Right after the waiting time, the same above wave was generated again for the third time for 3 minutes.
In the analysis it is observed that the energy damping rate varies with the incident wave condition but seems much faster than that of 20 minutes traditional waiting time in between two runs in the OEB. The energies for basin’s natural frequency components and other free waves were found to be very small compare to the incident primary wave energies (Zaman et al, 2015).
1.2 Project object
The primary objectives of the project are to confirm the followings:
To identify the residual surface undulation for regular and irregular waves over time after the termination of the wave making.
To confirm the wave damping or settling time of OEB as time progresses using an appropriate threshold value.
To produce data, graphs, etc to be used for better planning and operation of OEB.
2 Experimental
Facility
2.1 Offshore Engineering Basin (OEB)
The Offshore Engineering Basin (OEB) facility is a reinforced concrete structure 75 m long, 32 m wide with a wall height of 4 m. Water levels may be varied from 0.1 m to 2.8 m. Waves are generated using 168 individually computer controlled, hydraulically activated, wet back wave maker segments fitted around the perimeter of the compartment in an ‘L’ configuration. Each segment is 2 m high by 0.5 m wide. The wave makers can operate in 3 modes of articulation: flapper, piston or a combination of both modes. These modes optimize segment motion for generating waves in deep, shallow and intermediate water depths, respectively. The maximum wave height is 1.0 m in regular waves and the maximum significant wave height in irregular waves is 0.50 m. Depending on the water depth and wave height, wavelengths up to 23 m can be generated. Passive absorption is accomplished using expanded metal sheets of varying porosities and spacing.
The facility also has extensive video coverage and is serviced over its entire
working area by a 5 ton lift capacity crane. Figure 1 shows a picture of the Offshore
Engineering Basin, in which the set down tests were performed. For modeling the constant current, static loading in the form of a dead-weight was applied at the center of the projected area of the model. The applied static load was equivalent to one knot constant current loading.
2.1.1 Experimental setup
Figure 2 shows the locations of the wave probes in the OEB. In this report data obtained from the wave probes 10, 11, 12, 13 and 14 in the OEB for different test cases were analysed. Locations of these five probes are shown by the red circle in Figure 2. Wave makers on the west side (right boundary of Figure 2) was used to run the waves.
Figure 2 Locations of the wave probes in the OEB shown in red circle (From left: Probe 14 to Probe 10)
0 4 8 12 16 20 24 -64 -60 -56 -52 -48 -44 -40 -36 -32 -28 -24 -20 -16 -12 -8 -4 0 Model Center Wave Probes Probes 2 Blanking wall BW# 22 BW# 21 BW# 7 Model Center
3 Instrumentation
In the following sections, the instrumentation used in the tests is presented. 3.1 Data Acquisition System (DAS)
The data acquisition system for the tow out tests was configured at model scale to sample at 50 Hz for all the sensors unless otherwise stated. The DAS consisted of three different acquisition computers for data collection. Synchronization was achieved through a dedicated synchronization signal sent to all of the acquisition computers. Analogue data was measured and converted to digital form via integrated A/D converters onboard the signal conditioner units. Calibration curves for the channels are given in whenever possible.
3.1.1 Wave Probes (WP)
Five capacitance type wave probes were used in the experiments shown in Figure 2. The locations of these five probes in the OEB are shown in Table 1.
Table 1 Locations of the wave probes in the OEB
Probes Longitudinal distance (m) Transverse distance (m)
WP 10 -21.138 13.314
WP 11 -21.714 13.314
WP 12 -22.418 13.314
WP 13 -23.250 13.314
4 Test
Matrix
4.1 Description of the tests
This section describes wave parameters and the actual tests performed. Tests
specifications are given in Table 2. Both regular and irregular waves were tested in
the experiment.
Table 2 Test Matrix
Test
Regular waves
Wave Parameters Wave run and data acquisition Wave type Depth, h (m) Hs(m) L(m) Tp(s) H/L h/L Run time(m) Data acquisition(m) Waiting time (WT) Test 01 Deep 1.826 0.03 3.05 1.40 1% 0.6 3 23 WT calculation.
Test 02 Deep 1.826 0.03 3.05 1.40 1% 0.6 3 3+WT (2.92 ) Wait until Calctd WT
Test 03 Deep 1.826 0.03 3.05 1.40 1% 0.6 3 23 Repeating the RUN
Test 04 Deep 1.826 0.09 3.05 1.40 3% 0.6 3 23 WT calculation.
Test 05 Deep 1.826 0.09 3.05 1.40 3% 0.6 3 3+WT (4.30 ) Wait until Calctd WT
Test 06 Deep 1.826 0.09 3.05 1.40 3% 0.6 3 23 Repeating the RUN
Test 07 Deep 1.826 0.15 3.05 1.40 5% 0.6 3 23 WT calculation.
Test 08 Deep 1.826 0.15 3.05 1.40 5% 0.6 3 3+WT (6.6 ) Wait until Calctd WT
Test 09 Deep 1.826 0.15 3.05 1.40 5% 0.6 3 23 Repeating the RUN
Test 10 Deep 1.826 0.213 3.05 1.40 7% 0.6 3 23 WT calculation.
Test 11 Deep 1.826 0.213 3.05 1.40 7% 0.6 3 3+WT (8 ) Wait until Calctd WT
Test 12 Deep 1.826 0.213 3.05 1.40 7% 0.6 3 23 Repeating the RUN
Test 13 Deep 1.826 0.274 3.05 1.40 9% 0.6 3 23 WT calculation.
Test 14 Deep 1.826 0.274 3.05 1.40 9% 0.6 3 3+WT (11 ) Wait until Calctd WT
Test 15 Deep 1.826 0.274 3.05 1.40 9% 0.6 3 23 Repeating the RUN Compare Test 13 and Test 15
Test 16 Shallow 1.826 0.1826 18.26 4.583 1% 0.1 3 23 WT calculation.
Test 17 Shallow 1.826 0.1826 18.26 4.583 1% 0.1 3 3+WT (5.52 ) Wait until Calctd WT
Test 18 Shallow 1.826 0.1826 18.26 4.583 1% 0.1 3 23 Repeating the RUN
[ Natural Frequency of OEB (34.6s) synchronized ]
Test 19 Shallow 1.826 0.5478 18.26 4.583 3% 0.1 3 120 WT calculation.
Test 20 Shallow 1.826 0.5478 18.26 4.583 3% 0.1 3 3+WT (24.21 ) Wait until Calctd WT
Test 21 Shallow 1.826 0.5478 18.26 4.583 3% 0.1 3 120 Repeating the RUN
Test 25 Shallow 1.826 0.091 9.13 2.623 1% 0.2 3 23 WT calculation.
Test 26 Shallow 1.826 0.091 9.13 2.623 1% 0.2 3 3+WT (5.37 ) Wait until Calctd WT
Test 27 Shallow 1.826 0.091 9.13 2.623 1% 0.2 3 23 Repeating the RUN
Test 28 Shallow 1.826 0.273 9.13 2.623 3% 0.2 3 23 WT calculation.
Test 29 Shallow 1.826 0.273 9.13 2.623 3% 0.2 3 3+WT ( 9.2) Wait until Calctd WT
Test 30 Shallow 1.826 0.273 9.13 2.623 3% 0.2 3 23 Repeating the RUN
Test 31 Shallow 1.826 0.456 9.13 2.623 5% 0.2 3 40 WT calculation.
Test 32 Shallow 1.826 0.456 9.13 2.623 5% 0.2 3 3+WT ( 16.44) Wait until Calctd WT
Test 33 Shallow 1.826 0.456 9.13 2.623 5% 0.2 3 40 Repeating the RUN
Test 34 Shallow 1.826 0.639 9.13 2.623 7% 0.2 3 60 WT calculation.
Test 35 Shallow 1.826 0.639 9.13 2.623 7% 0.2 3 3+WT ( 24.5) Wait until Calctd WT
Test 36 Shallow 1.826 0.639 9.13 2.623 7% 0.2 3 60 Repeating the RUN
Test 37 Shallow 1.826 0.821 9.13 2.623 9% 0.2 3 60 WT calculation.
Test 38 Shallow 1.826 0.821 9.13 2.623 9% 0.2 3 3+WT (25.92 ) Wait until Calctd WT
Test 39 Shallow 1.826 0.821 9.13 2.623 9% 0.2 3 60 Repeating the RUN
Test 40 Shallow 1.826 0.0608 6.08 2.02 1% 0.3 3 23 WT calculation.
Test 41 Shallow 1.826 0.0608 6.08 2.02 1% 0.3 3 3+WT (5.88 ) Wait until Calctd WT
Test 42 Shallow 1.826 0.0608 6.08 2.02 1% 0.3 3 23 Repeating the RUN
Test 43 Shallow 1.826 0.1824 6.08 2.02 3% 0.3 3 23 WT calculation.
Calctd WT
Test 45 Shallow 1.826 0.1824 6.08 2.02 3% 0.3 3 23 Repeating the RUN
Test 46 Shallow 1.826 0.304 6.08 2.02 5% 0.3 3 23 WT calculation.
Test 47 Shallow 1.826 0.304 6.08 2.02 5% 0.3 3 3+WT (9.88 ) Wait until Calctd WT
Test 48 Shallow 1.826 0304 6.08 2.02 5% 0.3 3 23 Repeating the RUN
Test 49 Shallow 1.826 0.425 6.08 2.02 7% 0.3 3 23 WT calculation.
Test 50 Shallow 1.826 0.425 6.08 2.02 7% 0.3 3 3+WT ( 16.08) Wait until Calctd WT
Test 51 Shallow 1.826 0.425 6.08 2.02 7% 0.3 3 23 Repeating the RUN
Test 52 Shallow 1.826 0.547 6.08 2.02 9% 0.3 3 23 WT calculation.
Test 53 Shallow 1.826 0.547 6.08 2.02 9% 0.3 3 3+WT (25.53 ) Wait until Calctd WT
Test 54 Shallow 1.826 0.547 6.08 2.02 9% 0.3 3 23 Repeating the RUN Repeating 10 times each wave to understand any energy buildup
Test 05a Deep 1.826 0.09 3.05 1.40 3% 0.6 3 3+WT (5.25 ) Wait until Calctd WT
Test 14a Deep 1.826 0.274 3.05 1.40 9% 0.6 3 3+WT (11 ) Wait until Calctd WT
Test 17a Shallow 1.826 0.1826 18.26 4.583 1% 0.1 3 3+WT (6.5 ) Wait until Calctd WT
Test 29a Shallow 1.826 0.273 9.13 2.623 3% 0.2 3 3+WT ( 14) Wait until Calctd WT
Irregular waves (JONSWAP); Gamma=3.3
Test 55 Deep 1.826 0.2154 1.69 25 21 Wait time calculation.
Test 56 Deep 1.826 0.2154 1.69 25 25 + WT (9.5) Calculated wait time
Test 57 Deep 1.826 0.2154 1.69 25 21 Repeating the RUN
Test 58 Shallow 1.826 0.267 1.955 25 21 Wait time calculation.
Test 59 Shallow 1.826 0.267 1.955 25 25 + WT (11.5 )
Calculated wait time
Test 60 Shallow 1.826 0.267 1.955 25 21 Repeating the RUN
Test 61 Shallow 1.826 0.352 2.635 25 35 Wait time calculation.
Test 62 Shallow 1.826 0.352 2.635 25 50 + WT () Calculated wait time
Test 63 Shallow 1.826 0.352 2.635 25 65 Repeating the RUN
5 Analysis and Results
Comparisons of the results are carried out for all cases shown above. Initially the surface elevations of the waves are compared.
First run: Waves were generated on the calm water for 3 minutes then the wave making was stopped but the wave data were kept collected for 23 minutes, altogether 3 minutes waves and 20 minutes undulation after the wave making was stopped. This 23 minutes surface undulation data were analyzed to find the time (waiting time) that required the surface undulation in the wave basin to reach a preset threshold (0.5mm) after the wave making was stopped.
Second run: The same wave as above generated again for 3 minutes, then the wave making was stopped and waited until the “waiting time” that obtained from the first run data set. The basin is now ready for the third run.
Third run: Right after the waiting time in the second run, the same above wave was generated again for the third time for 3 minutes.
Comparisons of the surface elevations for the First, Second and the Third run were made to see the differences in amplitudes to identify the waiting time in between two consecutive runs. The optimization of the waiting time in between two runs is very important to increase the usage time of the OEB and thus accommodate more projects to earn more revenue.
5.1 First run and identify the threshold point
The waiting time in between two runs in this project is defined as the time requires reaching the available surface undulation in the OEB to 0.5mm after the wave making is stopped. The following figures show few examples of some arbitrary cases. In Figure 3 the blue, black and green circles, respectively show the time necessary to reach 0.5mm surface undulation for running standard deviation of 60s, 120s and 180s. Figure 4 shows waves attenuation in the tank over time after the wave making is stopped.
Figure 3 Show arbitrary surface elevation data and relevant time in reaching to undulation 0.5mm at a given location in the OEB. “0” after green boarder on the figures show the time when wave was stopped.
18 16 14 12 10 8 6 4 2 0 M a gn it ud e ( m m ) 3.0 2.5 2.0 1.5 1.0 0.5 0.0 Hz 2 4 6 8 10 12 14 Time (mins) 60 50 40 30 20 10 0 Ma g n itu d e (mm) 3.0 2.5 2.0 1.5 1.0 0.5 0.0 Hz 2 4 6 8 10 12 14 16 18 Time (mins)
Figure 4 Show amplitude spectrums for two arbitrary cases (a) settling quickly; (b) needs more time to settle
a
5.2 Regular wave comparisons
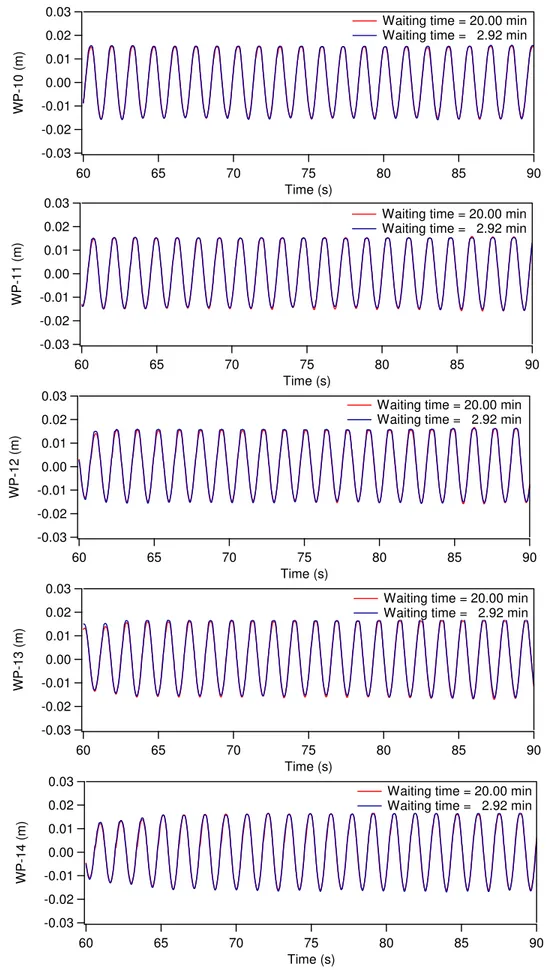
Figures 5 and 6 show the comparisons of the measured surface elevations between Test 1 (First run) and Test 2 (Second run) and, between Test 2 and Test 3 (Third run) at probe locations 10, 11, 11, 13 and 14.
Figures 7 to 19 show the comparisons of the surface elevations at the selected five locations for the same wave ran three times with particular needs. In the regular waves both deep and shallow water waves were considered.
5.2.1 Regular waves in deep water
The following section shows the tests results for the deep water regular wave cases. Experiments were carried out for various deep water regular waves with varying wave heights and steepness. Figure 5 shows comparison of the surface elevation between Test 1 and Test 3 and Figure 6 shows similar comparisons between Test 2 and Test 3. From the figures it is observed that variations in amplitudes are very minimal.
Figures 7 to 11show comparisons of the surface elevations for various test cases of regular deep water waves. In each group the comparisons match very well.
-0.03 -0.02 -0.01 0.00 0.01 0.02 W P -10 (m ) 90 85 80 75 70 65 60 Time (s)
Waiting time = 20.00 min Waiting time = 2.92 min
-0.03 -0.02 -0.01 0.00 0.01 0.02 0.03 W P -11 (m ) 90 85 80 75 70 65 60 Time (s)
Waiting time = 20.00 min Waiting time = 2.92 min
-0.03 -0.02 -0.01 0.00 0.01 0.02 0.03 W P -12 (m ) 90 85 80 75 70 65 60 Time (s)
Waiting time = 20.00 min Waiting time = 2.92 min
-0.03 -0.02 -0.01 0.00 0.01 0.02 0.03 W P -13 (m ) 90 85 80 75 70 65 60 Time (s)
Waiting time = 20.00 min Waiting time = 2.92 min
-0.03 -0.02 -0.01 0.00 0.01 0.02 0.03 W P -14 (m ) 90 85 80 75 70 65 60 Time (s)
Waiting time = 20.00 min Waiting time = 2.92 min
Figure 5 Comparisons of surface elevation at different probe location between Test 1 and Test 3 (Deep water: h=1.826m, T=1.4s, H=0.03m and H/L=0.01)
-0.03 -0.02 -0.01 0.00 0.01 0.02 0.03 W P -10 (m ) 90 85 80 75 70 65 60 Time (s)
Waiting time = 20.00 min Waiting time = 2.92 min
-0.03 -0.02 -0.01 0.00 0.01 0.02 0.03 W P -11 (m ) 90 85 80 75 70 65 60 Time (s)
Waiting time = 20.00 min Waiting time = 2.92 min
-0.03 -0.02 -0.01 0.00 0.01 0.02 0.03 W P -12 (m ) 90 85 80 75 70 65 60 Time (s)
Waiting time = 20.00 min Waiting time = 2.92 min
-0.03 -0.02 -0.01 0.00 0.01 0.02 0.03 W P -13 (m ) 90 85 80 75 70 65 60 Time (s)
Waiting time = 20.00 min Waiting time = 2.92 min
-0.03 -0.02 -0.01 0.00 0.01 0.02 0.03 W P -14 (m ) 90 85 80 75 70 65 60 Time (s)
Waiting time = 20.00 min Waiting time = 2.92 min
Figure 6 Comparisons of surface elevation at different probe location between Test 2 and Test 3 (Deep water: h=1.826m, T=1.4s, H=0.03m and H/L=0.01)
0.02 0.00 -0.02 W P -10 (m ) 80 79 78 77 76 75 Time (s)
Second run after 20.00 min Third run after 2.92 min
0.04 0.02 0.00 -0.02 W P -11 (m ) 80 79 78 77 76 75 Time (s) First run
Second run after 20.00 min Third run after 2.92 min
0.04 0.02 0.00 -0.02 W P -12 (m ) 80 79 78 77 76 75 Time (s) First run
Second run after 20.00 min Third run after 2.92 min
0.04 0.02 0.00 -0.02 W P -13 (m ) 80 79 78 77 76 75 Time (s) First run
Second run after 20.00 min Third run after 2.92 min
0.04 0.02 0.00 -0.02 W P -14 (m ) 80 79 78 77 76 75 Time (s) First run
Second run after 20.00 min Third run after 2.92 min
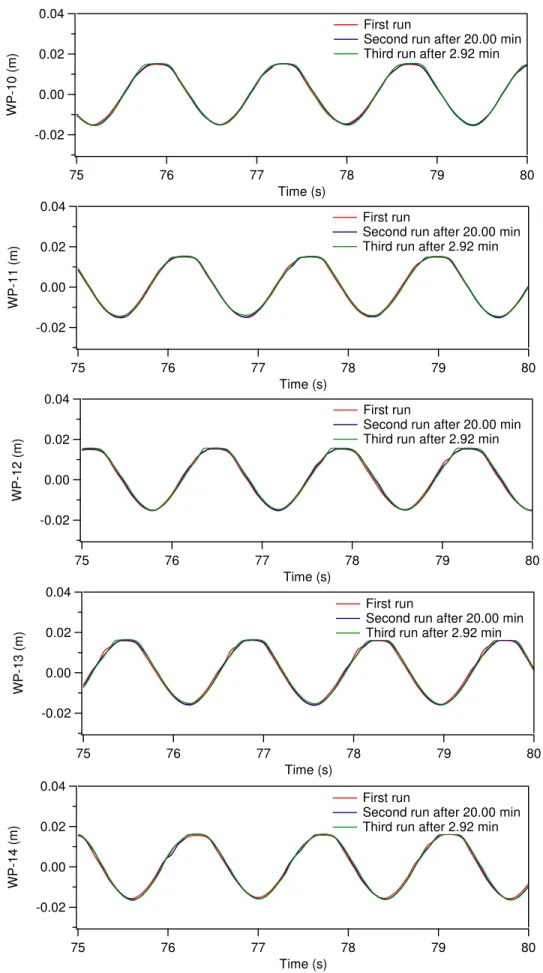
Figure 7 Comparisons of surface elevation at different probe location among Test 1, Test 2 and Test 3 (Deep water: h=1.826m, T=1.4s, H=0.03m and H/L=0.01)
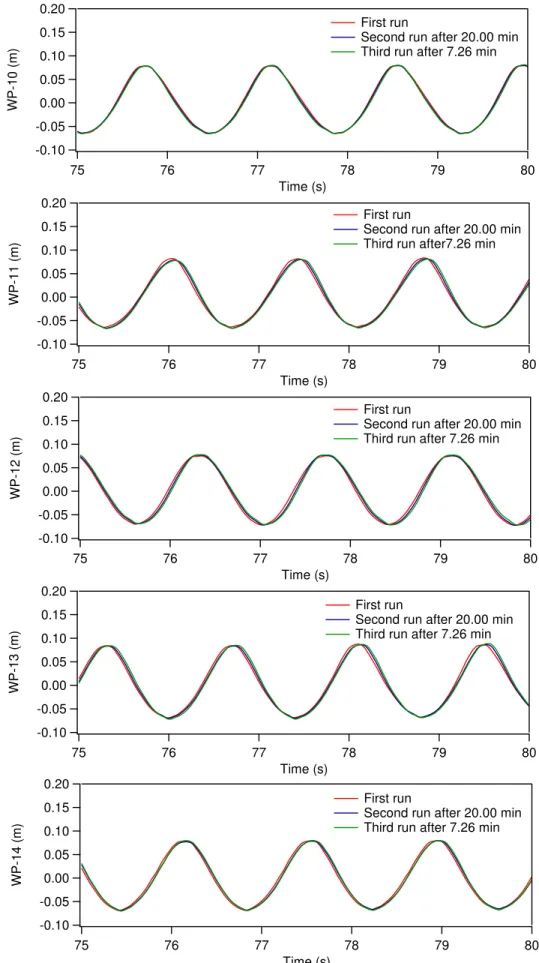
Figure 8 Comparisons of surface elevation at different probe location among Test 4, Test 5 and Test 6 (Deep water: h=1.826m, T=1.4s, H=0.09m and H/L=0.03)
Probes 10, 11, 12, 13 and 14 from top
0.15 0.10 0.05 0.00 -0.05 -0.10 W P -10 (m ) 80 79 78 77 76 75 Time (s) First run
Second run after 20.00 min Third run after 4.30 min
0.15 0.10 0.05 0.00 -0.05 -0.10 W P -11 (m ) 80 79 78 77 76 75 Time (s) First run
Second run after 20.00 min Third run after 4.30 min
0.15 0.10 0.05 0.00 -0.05 -0.10 W P -12 (m ) 80 79 78 77 76 75 Time (s) First run
Second run after 20.00 min Third run after 4.30 min
0.15 0.10 0.05 0.00 -0.05 -0.10 W P -13 (m ) 80 79 78 77 76 75 Time (s) First run
Second run after 20.00 min Third run after 4.30 min
0.15 0.10 0.05 0.00 -0.05 -0.10 W P -14 (m ) 80 79 78 77 76 75 Time (s) First run
Second run after 20.00 min Third run after 4.30 min
0.15 0.10 0.05 0.00 -0.05 -0.10 W P -10 (m ) 80 79 78 77 76 75 Time (s)
Second run after 20.00 min Third run after 7.26 min
0.20 0.15 0.10 0.05 0.00 -0.05 -0.10 W P -11 (m ) 80 79 78 77 76 75 Time (s) First run
Second run after 20.00 min Third run after7.26 min
0.20 0.15 0.10 0.05 0.00 -0.05 -0.10 W P -12 (m ) 80 79 78 77 76 75 Time (s) First run
Second run after 20.00 min Third run after 7.26 min
0.20 0.15 0.10 0.05 0.00 -0.05 -0.10 W P -13 (m ) 80 79 78 77 76 75 Time (s) First run
Second run after 20.00 min Third run after 7.26 min
0.20 0.15 0.10 0.05 0.00 -0.05 -0.10 W P -14 (m ) 80 79 78 77 76 75 Time (s) First run
Second run after 20.00 min Third run after 7.26 min
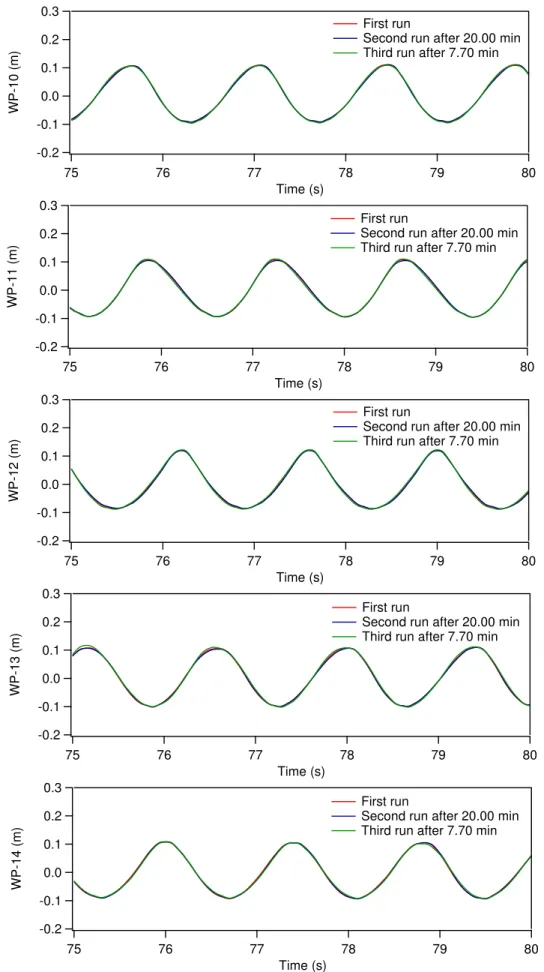
Figure 9 Comparisons of surface elevation at different probe location among Test 7, Test 8 and Test 9 (Deep water: h=1.826m, T=1.4s, H=0.15m and H/L=0.05) Probes
0.3 0.2 0.1 0.0 -0.1 -0.2 W P -10 (m ) 80 79 78 77 76 75 Time (s) First run
Second run after 20.00 min Third run after 7.70 min
0.3 0.2 0.1 0.0 -0.1 -0.2 W P -11 (m ) 80 79 78 77 76 75 Time (s) First run
Second run after 20.00 min Third run after 7.70 min
0.3 0.2 0.1 0.0 -0.1 -0.2 W P -12 (m ) 80 79 78 77 76 75 Time (s) First run
Second run after 20.00 min Third run after 7.70 min
0.3 0.2 0.1 0.0 -0.1 -0.2 W P -13 (m ) 80 79 78 77 76 75 Time (s) First run
Second run after 20.00 min Third run after 7.70 min
0.3 0.2 0.1 0.0 -0.1 -0.2 W P -14 (m ) 80 79 78 77 76 75 Time (s) First run
Second run after 20.00 min Third run after 7.70 min
Figure 10 Comparisons of surface elevation at different probe location among Test 10, Test 11 and Test 12 (Deep water: h=1.826m, T=1.4s, H=0.213m and H/L=0.07)
0.3 0.2 0.1 0.0 -0.1 -0.2 W P -10 (m ) 80 79 78 77 76 75 Time (s)
Second run after 20.00 min Third run after 11.00 min
0.4 0.3 0.2 0.1 0.0 -0.1 -0.2 W P -11 (m ) 80 79 78 77 76 75 Time (s) First run
Second run after 20.00 min Third run after 11.00 min
0.4 0.3 0.2 0.1 0.0 -0.1 -0.2 W P -12 (m ) 80 79 78 77 76 75 Time (s) First run
Second run after 20.00 min Third run after 11.00 min
0.4 0.3 0.2 0.1 0.0 -0.1 -0.2 W P -13 (m ) 80 79 78 77 76 75 Time (s) First run
Second run after 20.00 min Third run after 11.00 min
0.4 0.3 0.2 0.1 0.0 -0.1 -0.2 W P -14 (m ) 80 79 78 77 76 75 Time (s) First run
Second run after 20.00 min Third run after 11.00 min
Figure 11 Comparisons of surface elevation at different probe location among Test 13, Test 14 and Test 15 (Deep water: h=1.826m, T=1.40s, H=0.274m and H/L=0.09)
5.2.2 Regular waves in shallow water
The following section shows the tests results for the shallow water regular wave cases. Experiments were carried out for various shallow water regular waves with varying wave heights and steepness. Figures 12 to 22 show comparisons of the surface elevations for various test cases in shallow water. In each group the comparisons match exceptionally well.
0.2 0.1 0.0 -0.1 -0.2 W P -10 (m ) 95 90 85 80 75 Time (s)
Second run after 20.00 min Third run after 5.52 min
0.3 0.2 0.1 0.0 -0.1 -0.2 W P -11 (m ) 95 90 85 80 75 Time (s) First run
Second run after 20.00 min Third run after 5.52 min
0.3 0.2 0.1 0.0 -0.1 -0.2 W P -12 (m ) 95 90 85 80 75 Time (s) First run
Second run after 20.00 min Third run after 5.52 min
0.3 0.2 0.1 0.0 -0.1 -0.2 W P -13 (m ) 95 90 85 80 75 Time (s) First run
Second run after 20.00 min Third run after 5.52 min
0.3 0.2 0.1 0.0 -0.1 -0.2 W P -14 (m ) 95 90 85 80 75 Time (s) First run
Second run after 20.00 min Third run after 5.52 min
Figure 12 Comparisons of surface elevation at different probe location among Test 16, Test 17 and Test 18 (Shallow water: h=1.826m, T=4.583s, H=0.1826m, h/L=0.1 and H/L=0.01)
Figure 13 Comparisons of surface elevation at different probe location among Test 19, Test 20 and Test 21 (Shallow water: h=1.826m, T=4.583s, H=0.1826m , h/L=0.1 and H/L=0.03)
Probes 10, 11, 12, 13 and 14 from top
0.8 0.6 0.4 0.2 0.0 -0.2 W P -10 (m ) 95 90 85 80 75 Time (s) First run
Second run after 30.00 min Third run after 24.21 min
0.8 0.6 0.4 0.2 0.0 -0.2 W P -11 (m ) 95 90 85 80 75 Time (s) First run
Second run after 30.00 min Third run after 24.21 min
0.8 0.6 0.4 0.2 0.0 -0.2 W P -12 (m ) 95 90 85 80 75 Time (s) First run
Second run after 30.00 min Third run after 24.21 min
0.8 0.6 0.4 0.2 0.0 -0.2 W P -13 (m ) 95 90 85 80 75 Time (s) First run
Second run after 30.00 min Third run after 24.21 min
0.8 0.6 0.4 0.2 0.0 -0.2 W P -14 (m ) 95 90 85 80 75 Time (s) First run
Second run after 30.00 min Third run after24.21 min
-0.2 -0.1 0.0 0.1 WP -1 0 (m ) 95 90 85 80 75 Time (s) First run
Second run after 20.00 min Third run after 5.37 min
-0.2 -0.1 0.0 0.1 0.2 WP -1 1 (m ) 95 90 85 80 75 Time (s) First run
Second run after 20.00 min Third run after 5.37 min
-0.2 -0.1 0.0 0.1 0.2 WP -1 2 (m ) 95 90 85 80 75 Time (s) First run
Second run after 20.00 min Third run after 5.37 min
-0.2 -0.1 0.0 0.1 0.2 WP -1 3 (m ) 95 90 85 80 75 Time (s) First run
Second run after 20.00 min Third run after 5.37 min
-0.2 -0.1 0.0 0.1 0.2 WP -1 4 (m ) 95 90 85 80 75 Time (s) First run
Second run after 20.00 min Third run after 5.37 min
Figure 14 Comparisons of surface elevation at different probe location among Test 25, Test 26 and Test 27 (Shallow water: h=1.826m, T=2.623s, H=0.091m, h/L=0.2 and H/L=0.01)
0.4 0.3 0.2 0.1 0.0 -0.1 -0.2 WP -1 0 (m ) 95 90 85 80 75 Time (s) First run
Second run after 20.00 min Third run after 9.20 min
0.4 0.3 0.2 0.1 0.0 -0.1 -0.2 WP -1 1 (m ) 95 90 85 80 75 Time (s) First run
Second run after 20.00 min Third run after 9.20 min
0.4 0.3 0.2 0.1 0.0 -0.1 -0.2 WP -1 2 (m ) 95 90 85 80 75 Time (s) First run
Second run after 20.00 min Third run after 9.20 min
0.4 0.3 0.2 0.1 0.0 -0.1 -0.2 WP -1 3 (m ) 95 90 85 80 75 Time (s) First run
Second run after 20.00 min Third run after 9.20 min
0.4 0.3 0.2 0.1 0.0 -0.1 -0.2 WP -1 4 (m ) 95 90 85 80 75 Time (s) First run
Second run after 20.00 min Third run after 9.20 min
Figure 15 Comparisons of surface elevation at different probe location among Test 28, Test 29 and Test 30 (Shallow water: h=1.826m, T=2.623s, H=0.273m , h/L=0.2 and H/L=0.03)
0.4 0.2 0.0 -0.2 WP -1 0 (m ) 95 90 85 80 75 Time (s) First run
Second run after 20.00 min Third run after 16.44 min
0.6 0.4 0.2 0.0 -0.2 WP -1 1 (m ) 95 90 85 80 75 Time (s) First run
Second run after 20.00 min Third run after 16.44 min
0.6 0.4 0.2 0.0 -0.2 WP -1 2 (m ) 95 90 85 80 75 Time (s) First run
Second run after 20.00 min Third run after 16.44 min
0.6 0.4 0.2 0.0 -0.2 WP -1 3 (m ) 95 90 85 80 75 Time (s) First run
Second run after 20.00 min Third run after 16.44 min
0.6 0.4 0.2 0.0 -0.2 WP -1 4 (m ) 95 90 85 80 75 Time (s) First run
Second run after 20.00 min Third run after 16.44 min
Figure 16 Comparisons of surface elevation at different probe location among Test 31, Test 32 and Test 33 (Shallow water: h=1.826m, T=2.623s, H=0.456m, h/L=0.2 and H/L=0.05)
Figure 17 Comparisons of surface elevation at different probe location among Test 34, Test 35 and Test 36 (Shallow water: h=1.826m, T=2.623s, H=0.639m, h/L=0.2 and H/L=0.07)
Probes 10, 11, 12, 13 and 14 from top 0.6 0.4 0.2 0.0 -0.2 -0.4 WP -1 0 (m ) 60 58 56 54 52 50 Time (s) First run
Second run after 60.00 min Third run after 24.50 min
0.8 0.6 0.4 0.2 0.0 -0.2 -0.4 WP -1 1 (m ) 60 58 56 54 52 50 Time (s) First run
Second run after 60.00 min Third run after 24.50 min
0.8 0.6 0.4 0.2 0.0 -0.2 -0.4 WP -1 2 (m ) 60 58 56 54 52 50 Time (s) First run
Second run after 60.00 min Third run after 24.50 min
0.8 0.6 0.4 0.2 0.0 -0.2 -0.4 WP -1 3 (m ) 60 58 56 54 52 50 Time (s) First run
Second run after 60.00 min Third run after 24.50 min
0.8 0.6 0.4 0.2 0.0 -0.2 -0.4 WP -1 4 (m ) 60 58 56 54 52 50 Time (s) First run
Second run after 60.00 min Third run after 24.50 min
Figure 18 Comparisons of surface elevation at different probe location among Test 37, Test 38 and Test 39 (Shallow water: h=1.826m, T=2.623s, H=0.821m, h/L=0.2 and H/L=0.09)
Probes 10, 11, 12, 13 and 14 from top 0.8 0.6 0.4 0.2 0.0 -0.2 -0.4 W P-10 ( m ) 60 58 56 54 52 50 Time (s)
Second run after 60.00 min Third run after 25.92 min
1.0 0.8 0.6 0.4 0.2 0.0 -0.2 -0.4 WP -1 1 (m ) 60 58 56 54 52 50 Time (s) First run
Second run after 60.00 min Third run after 25.92 min
1.0 0.8 0.6 0.4 0.2 0.0 -0.2 -0.4 WP -1 2 (m ) 60 58 56 54 52 50 Time (s) First run
Second run after 60.00 min Third run after 25.92 min
1.0 0.8 0.6 0.4 0.2 0.0 -0.2 -0.4 WP -1 3 (m ) 60 58 56 54 52 50 Time (s) First run
Second run after 60.00 min Third run after 25.92 min
1.0 0.8 0.6 0.4 0.2 0.0 -0.2 -0.4 WP -1 4 (m ) 60 58 56 54 52 50 Time (s) First run
Second run after 60.00 min Third run after 25.92 min
-0.10 -0.05 0.00 0.05 0.10 WP -1 4 (m ) 95 90 85 80 75 Time (s) First run
Second run after 20.00 min Third run after 5.88 min
-0.10 -0.05 0.00 0.05 0.10 WP -1 1 (m ) 95 90 85 80 75 Time (s) First run
Second run after 20.00 min Third run after 5.88 min
-0.10 -0.05 0.00 0.05 0.10 WP -1 2 (m ) 95 90 85 80 75 Time (s) First run
Second run after 20.00 min Third run after 5.88 min
-0.10 -0.05 0.00 0.05 0.10 WP -1 3 (m ) 95 90 85 80 75 Time (s) First run
Second run after 20.00 min Third run after 5.88 min
-0.10 -0.05 0.00 0.05 0.10 WP -1 4 (m ) 95 90 85 80 75 Time (s) First run
Second run after 20.00 min Third run after 5.88 min
Figure 19 Comparisons of surface elevation at different probe location among Test 40, Test 41 and Test 42 (Shallow water: h=1.826m, T=2.02s, H=0.061m, h/L=0.3 and H/L=0.01)
0.2 0.1 0.0 -0.1 -0.2 WP -1 0 (m ) 95 90 85 80 75 Time (s) First run
Second run after 20.00 min Third run after 6.62 min
0.3 0.2 0.1 0.0 -0.1 -0.2 WP -1 1 (m ) 95 90 85 80 75 Time (s) First run
Second run after 20.00 min Third run after 6.62 min
0.3 0.2 0.1 0.0 -0.1 -0.2 WP -1 2 (m ) 95 90 85 80 75 Time (s) First run
Second run after 20.00 min Third run after 6.62 min
0.3 0.2 0.1 0.0 -0.1 -0.2 WP -1 3 (m ) 95 90 85 80 75 Time (s) First run
Second run after 20.00 min Third run after 6.62 min
0.3 0.2 0.1 0.0 -0.1 -0.2 WP -1 4 (m ) 95 90 85 80 75 Time (s) First run
Second run after 20.00 min Third run after 6.62 min
Figure 20 Comparisons of surface elevation at different probe location among Test 43, Test 44 and Test 45 (Shallow water: h=1.826m, T=2.02s, H=0.1824m, h/L=0.3 and H/L=0.03)
0.4 0.3 0.2 0.1 0.0 -0.1 -0.2 WP -1 0 (m ) 95 90 85 80 75 Time (s) First run
Second run after 20.00 min Third run after 9.88 min
0.4 0.3 0.2 0.1 0.0 -0.1 -0.2 WP -1 1 (m ) 95 90 85 80 75 Time (s) First run
Second run after 20.00 min Third run after 9.88 min
0.4 0.3 0.2 0.1 0.0 -0.1 -0.2 WP -1 2 (m ) 95 90 85 80 75 Time (s) First run
Second run after 20.00 min Third run after 9.88 min
0.4 0.3 0.2 0.1 0.0 -0.1 -0.2 WP -1 3 (m ) 95 90 85 80 75 Time (s) First run
Second run after 20.00 min Third run after 9.88 min
0.4 0.3 0.2 0.1 0.0 -0.1 -0.2 WP -1 4 (m ) 95 90 85 80 75 Time (s) First run
Second run after 20.00 min Third run after 9.88 min
Figure 21 Comparisons of surface elevation at different probe location among Test 46, Test 47 and Test 48 (Shallow water: h=1.826m, T=2.02s, H=0.304m, h/L=0.3 and H/L=0.05)
0.4 0.2 0.0 -0.2 WP -1 0 (m ) 95 90 85 80 75 Time (s) First run
Second run after 20.00 min Third run after 16.08 min
0.6 0.4 0.2 0.0 -0.2 WP -1 1 (m ) 95 90 85 80 75 Time (s) First run
Second run after 20.00 min Third run after 16.08 min
0.6 0.4 0.2 0.0 -0.2 WP -1 2 (m ) 95 90 85 80 75 Time (s) First run
Second run after 20.00 min Third run after 16.08 min
0.6 0.4 0.2 0.0 -0.2 WP -1 3 (m ) 95 90 85 80 75 Time (s) First run
Second run after 20.00 min Third run after 16.08 min
0.6 0.4 0.2 0.0 -0.2 WP -1 4 (m ) 95 90 85 80 75 Time (s) First run
Second run after 20.00 min Third run after 16.08 min
Figure 22 Comparisons of surface elevation at different probe location among Test 49, Test 50 and Test 51 (Shallow water: h=1.826m, T=2.02s, H=0.425m, h/L=0.3 and H/L=0.07)
5.2.3 Repeating cases in deep water regular wave
Test 5 with 4.3 minutes waiting time, was ran for ten times in a row to understand the repeating consequences of a single wave on the residual wave concentration in the tank. Figures 23 to 27 show the comparisons of the crests and troughs for ten repeating Runs of Test 5 at Probe 10, 11, 12, 13 and 14 locations. From the First Run (Test 4), the waiting time was identified as 4.30 minutes from a 23 minutes
measured data. For 2nd to 10th run only 4.3 minutes waiting time was used.
0.20 0.15 0.10 0.05 0.00 -0.05 -0.10 WP-10 (m ) 70 69 68 67 66 65 Time (s) Waiting time = 20.0min
All waiting time = 4.29 min
Ist run
2nd run 3rd run 4th run 5th run 6th run 7th run 8th run 9th run 10th run
0.055 0.050 0.045 0.040 0.035 0.030 WP-10 ( m ) 67.60 67.55 67.50 67.45 67.40 67.35 67.30 Time (s) Ist run
2nd run 3rd run 4th run 5th run 6th run 7th run 8th run 9th run 10th run
-0.055 -0.050 -0.045 -0.040 -0.035 -0.030 WP-10 (m ) 68.30 68.25 68.20 68.15 68.10 68.05 68.00 67.95 Time (s) Ist run
2nd run 3rd run 4th run 5th run 6th run 7th run 8th run 9th run 10th run
Figure 23 Test 5: (a) Comparisons of ten runs at Probe-10, (b) Comparisons of crests and (c) Comparisons of troughs
a
b
Figure 24 Test 5: (a) Comparisons of ten runs at Probe-10, (b) Comparisons of crests and (c) Comparisons of troughs
0.20 0.15 0.10 0.05 0.00 -0.05 -0.10 WP-11 ( m ) 70 69 68 67 66 65 Time (s) Ist run
2nd run 3rd run 4th run 5th run 6th run 7th run 8th run 9th run 10th run Waiting time = 20.0min
All waiting time = 4.29 min
0.055 0.050 0.045 0.040 0.035 0.030 WP-11 (m ) 67.90 67.85 67.80 67.75 67.70 67.65 67.60 67.55 Time (s) Ist run
2nd run 3rd run 4th run 5th run 6th run 7th run 8th run 9th run 10th run
-0.055 -0.050 -0.045 -0.040 -0.035 -0.030 WP-11 ( m ) 68.60 68.55 68.50 68.45 68.40 68.35 68.30 68.25 Time (s) Ist run
2nd run 3rd run 4th run 5th run 6th run 7th run 8th run 9th run 10th run a
b
c
Figure 25 Test 5: (a) Comparisons of ten runs at Probe-11, (b) Comparisons of crests and (c) Comparisons of troughs
0.20 0.15 0.10 0.05 0.00 -0.05 -0.10 WP-12 (m ) 70 69 68 67 66 65 Time (s)
Waiting time = 20.0min Waiting time = 4.29 min Ist run
2nd run 3rd run 4th run 5th run 6th run 7th run 8th run 9th run 10th run Waiting time = 20.0min
All waiting time = 4.29 min
0.055 0.050 0.045 0.040 0.035 0.030 WP-12 ( m ) 69.6 69.5 69.4 69.3 Time (s) Ist run
2nd run 3rd run 4th run 5th run 6th run 7th run 8th run 9th run 10th run
-0.055 -0.050 -0.045 -0.040 -0.035 -0.030 WP-12 ( m ) 68.9 68.8 68.7 68.6 Time (s) Ist run
2nd run 3rd run 4th run 5th run 6th run 7th run 8th run 9th run 10th run
Figure 27 Test 5: (a) Comparisons of ten runs at Probe-12, (b) Comparisons of crests and (c) Comparisons of troughs
a
b
0.20 0.15 0.10 0.05 0.00 -0.05 -0.10 WP-13 (m ) 70 69 68 67 66 65 Time (s) Ist run
2nd run 3rd run 4th run 5th run 6th run 7th run 8th run 9th run 10th run Waiting time = 20.0min
All waiting time = 4.29 min
0.055 0.050 0.045 0.040 0.035 0.030 WP-13 ( m ) 68.6 68.5 68.4 68.3 Time (s) Ist run
2nd run 3rd run 4th run 5th run 6th run 7th run 8th run 9th run 10th run
-0.055 -0.050 -0.045 -0.040 -0.035 -0.030 WP-13 (m ) 67.90 67.85 67.80 67.75 67.70 67.65 67.60 67.55 Time (s) Ist run
2nd run 3rd run 4th run 5th run 6th run 7th run 8th run 9th run 10th run
Figure 28 Test 5: (a) Comparisons of ten runs at Probe-13, (b) Comparisons of crests and (c) Comparisons of troughs
It is observed from the comparisons that 2nd and 3rd Runs are in well match with
First Run at all five probe locations. Then for 4th to 7th Runs both crests and
troughs increases minimally but decreases again from 8th to 10th runs. It is
observed that at most probe locations both crest and troughs are within 3 to 4% of the First Run.
0.20 0.15 0.10 0.05 0.00 -0.05 -0.10 WP-14 ( m ) 70 69 68 67 66 65 Time (s) Waiting time = 20.0min
All waiting time = 4.29 min
Ist run
2nd run 3rd run 4th run 5th run 6th run 7th run 8th run 9th run 10th run
0.055 0.050 0.045 0.040 0.035 0.030 WP-14 (m ) 68.0 67.9 67.8 67.7 Time (s) Ist run
2nd run 3rd run 4th run 5th run 6th run 7th run 8th run 9th run 10th run
-0.055 -0.050 -0.045 -0.040 -0.035 -0.030 WP-14 ( m ) 68.7 68.6 68.5 68.4 Time (s) Ist run
2nd run 3rd run 4th run 5th run 6th run 7th run 8th run 9th run 10th run
Figure 29 Test 5: (a) Comparisons of ten runs at Probe-14, (b) Comparisons of crests and (c) Comparisons of troughs
5.2.4 Repeatability statistics for deep water regular waves
As a follow up to the previous section, in this section the variations in wave crests and troughs within a given test are investigated. Even for the first test, i.e. the run after waiting for a minimum of 20 minutes or more, not every (regular) wave
generated is identical. Detailed results are presented in Appendix A. Figure 30
shows a sample time series from such a test, which corresponds to 1st Run
(Test_04), Probe 10. In Table 3, basics statistics are given for all the wave probes.
Test_04 is conducted after a minimum of 20 minutes waiting period. The range of variations in the table varies between 0.72 to 1.43 cm for crests and between 0.62 and 0.95 cm for troughs for the tests conducted. This is a baseline variation in the
regular waves generated. Hence, based on Table 3 and Figure 31, a baseline
variation of approximately 1 cm is expected in a given regular wave run. Therefore, the variations observed in the peaks and troughs of the waves with less prior wait times compared to the baseline, i.e. Test_04, deemed acceptable.
Table 3 Basic statistics for the first run (Wait time • 20 minutes) Wait time Test Name Probe Name Mean, m Minimum, m Maximum, m Std_dev, m Range, m Statisti cs for the crests 20 min 1 st Run WP‐10 0.052 0.0444 0.0587 0.0037 0.0143 WP‐11 0.0446 0.0385 0.0508 0.0037 0.0123 WP‐12 0.0476 0.044 0.0512 0.0017 0.0072 WP‐13 0.0465 0.0423 0.0515 0.0023 0.0092 WP‐14 0.0427 0.0366 0.0494 0.004 0.0128 Statisti cs for the troughs 20 min 1 st Run WP‐10 ‐0.0461 ‐0.0508 ‐0.0414 0.0028 0.0095 WP‐11 ‐0.0419 ‐0.0452 ‐0.0389 0.0016 0.0063 WP‐12 ‐0.0458 ‐0.0483 ‐0.0421 0.0013 0.0062 WP‐13 ‐0.0415 ‐0.045 ‐0.0383 0.0015 0.0066 WP‐14 ‐0.0461 ‐0.0508 ‐0.0414 0.0028 0.0095 Crests Troughs Probe 10 Probe 11
Probe 12
Probe 13
Probe 14
Figure 31 Histograms of the variations for the crests and troughs
Table 4 gives the differences of means of Runs 2 to 10, with less wait times,
compared to the mean of the baseline run (1st Run) in mm. Based on the results
compares well with variations of within the baseline run, which is reported in
Table 3 above.
Table 4 Differences of means of Runs 2 to 10 compared to the mean of the baseline run (1st Run)
Differences of means compared to the mean of the baseline run in mm In Crests In Troughs 1st run (Baseline) 0 0 2nd Run ‐1.9 0.9 3rd Run ‐1.5 0.1 4th Run ‐0.4 0.1 5th Run 0.3 ‐0.5 6th Run 0.8 0.2 7th Run 2.4 ‐0.8 8th Run 1.8 ‐1.8 9th Run 0.3 ‐0.8 10th Run ‐1.2 ‐0.5 Average 0.0 ‐0.2 Minimum ‐1.9 ‐1.8 Maximum 2.4 1.1 Standard dev. 1.0 0.6
5.2.5 Repeating cases in shallow water regular wave
Test 17 with 5.52 minutes waiting time, was ran for ten times to perceive the repeating impacts of a single wave on the variations of the residual wave components in the tank. Figures 28 to 32 show the comparisons of the crests and troughs for ten repeating Runs of Test 17 at Probe 10, 11, 12, 13 and 14 locations. From the First Run (Test 16), the waiting time was identified as 5.52 minutes
from a 23 minutes measured data. For 2nd to 10th run only 5.52 minutes waiting
0.4 0.3 0.2 0.1 0.0 -0.1 -0.2 WP-10 ( m ) 85 80 75 70 65 Time (s) Waiting time = 20.0min
All waiting time = 5.52 min
Ist run
2nd run 3rd run 4th run 5th run 6th run 7th run 8th run 9th run 10th run
0.140 0.135 0.130 0.125 0.120 WP-10 (m ) 78.2 78.1 78.0 77.9 77.8 77.7 Time (s) Ist run
2nd run 3rd run 4th run 5th run 6th run 7th run 8th run 9th run 10th run
-0.100 -0.095 -0.090 -0.085 -0.080 WP-10 (m ) 80.8 80.6 80.4 80.2 80.0 Time (s) Ist run
2nd run 3rd run 4th run 5th run 6th run 7th run 8th run 9th run 10th run
Figure 32 Test 17: (a) Comparisons of ten runs at Probe-10, (b) Comparisons of crests and (c) Comparisons of troughs
time was used. 0.4 0.3 0.2 0.1 0.0 -0.1 -0.2 WP-11 (m ) 85 80 75 70 65 Time (s) Ist run
2nd run 3rd run 4th run 5th run 6th run 7th run 8th run 9th run 10th run Waiting time = 20.0min
All waiting time = 5.52 min
0.140 0.135 0.130 0.125 0.120 WP-11 ( m ) 78.4 78.3 78.2 78.1 78.0 77.9 Time (s) Ist run
2nd run 3rd run 4th run 5th run 6th run 7th run 8th run 9th run 10th run
-0.100 -0.095 -0.090 -0.085 -0.080 WP-11 (m ) 81.0 80.8 80.6 80.4 80.2 80.0 Time (s) Ist run
2nd run 3rd run 4th run 5th run 6th run 7th run 8th run 9th run 10th run
Figure 33 Test 17: (a) Comparisons of ten runs at Probe-11, (b) Comparisons of crests and (c) Comparisons of troughs
0.4 0.3 0.2 0.1 0.0 -0.1 -0.2 WP-12 ( m ) 85 80 75 70 65 Time (s) Waiting time = 20.0min
All waiting time = 5.52 min
Ist run
2nd run 3rd run 4th run 5th run 6th run 7th run 8th run 9th run 10th run
-0.100 -0.095 -0.090 -0.085 -0.080 WP-12 (m ) 81.0 80.8 80.6 80.4 80.2 Time (s) Ist run
2nd run 3rd run 4th run 5th run 6th run 7th run 8th run 9th run 10th run
Figure 34 Test 17: (a) Comparisons of ten runs at Probe-12, (b) Comparisons of crests and (c) Comparisons of troughs
0.140 0.135 0.130 0.125 0.120 WP-12 ( m ) 78.6 78.5 78.4 78.3 78.2 78.1 Time (s) Ist run
2nd run 3rd run 4th run 5th run 6th run 7th run 8th run 9th run 10th run
0.4 0.3 0.2 0.1 0.0 -0.1 -0.2 WP-13 ( m ) 85 80 75 70 65 Time (s) Waiting time = 20.0min
All waiting time = 5.52 min
Ist run
2nd run 3rd run 4th run 5th run 6th run 7th run 8th run 9th run 10th run
-0.100 -0.095 -0.090 -0.085 -0.080 WP-13 (m ) 81.2 81.0 80.8 80.6 80.4 Time (s) Ist run
2nd run 3rd run 4th run 5th run 6th run 7th run 8th run 9th run 10th run
Figure 35 Test 17: (a) Comparisons of ten runs at Probe-13, (b) Comparisons of crests and (c) Comparisons of troughs
0.140 0.135 0.130 0.125 0.120 WP-13 ( m ) 78.8 78.7 78.6 78.5 78.4 78.3 Time (s) Ist run
2nd run 3rd run 4th run 5th run 6th run 7th run 8th run 9th run 10th run
It is perceived from the comparisons that surface elevations of all nine Runs are closely placed with the surface elevation of the First Run at all five probe locations. It is observed that at most probe locations both crest and troughs are within 1 to 2% (0.0025/0.1826*100) of the First Run.
0.4 0.3 0.2 0.1 0.0 -0.1 -0.2 WP-14 (m ) 85 80 75 70 65 Time (s) Waiting time = 20.0min
All waiting time = 5.52 min
Ist run
2nd run 3rd run 4th run 5th run 6th run 7th run 8th run 9th run 10th run
-0.100 -0.095 -0.090 -0.085 -0.080 WP-14 (m ) 81.6 81.4 81.2 81.0 80.8 Time (s) Ist run
2nd run 3rd run 4th run 5th run 6th run 7th run 8th run 9th run 10th run
Figure 36 Test 17: (a) Comparisons of ten runs at Probe-14, (b) Comparisons of crests and (c) Comparisons of troughs
0.140 0.135 0.130 0.125 0.120 WP-14 ( m ) 79.2 79.1 79.0 78.9 78.8 78.7 Time (s) Ist run
2nd run 3rd run 4th run 5th run 6th run 7th run 8th run 9th run 10th run
5.2.6 Repeatability statistics for shallow water regular waves
As a follow up to the previous section, in this section the variations in wave crests and troughs within a given test are investigated for the shallow water case.
Detailed results are presented in “APPENDIX B – Regular Waves in Shallow ”.
Figure 37 shows a sample time series from such a test, which corresponds to 1st
Run (Test_16), Probe 10. In Table 5, basics statistics are given for all the wave
probes for baseline run, i.e. 1st Run. Test_16 is conducted after a minimum of 20
minutes prior waiting period. The range of variations in the table varies between 0.9 to 1.55 cm for crests and between 0.51 and 1.01cm for troughs for the tests conducted. This is a baseline variation in the regular waves generated in shallow
water. Based on Table 5 and Figure 38, a baseline variation of approximately 1 cm
is expected in a given regular wave run in shallow water. Therefore, given the
results in “APPENDIX B – Regular Waves in Shallow ”, the variations observed in
the peaks and troughs of the waves with less prior wait times compared to the
baseline, i.e. 1st Run, deemed acceptable.