Preprint typeset using LATEX style AASTeX6 v. 1.0
THE RELATION BETWEEN GLOBULAR CLUSTER SYSTEMS AND SUPERMASSIVE BLACK HOLES IN SPIRAL GALAXIES. THE CASE STUDY OF NGC 4258.
Rosa A. Gonz´alez-L´opezlira1,2, Luis Lomel´ı-N´u˜nez1, Karla ´Alamo-Mart´ınez3, Yasna ´
Ordenes-Brice˜no3, Laurent Loinard1, Iskren Y. Georgiev4, Roberto P. Mu˜noz3, Thomas H. Puzia3, Gustavo Bruzual A.1, Stephen Gwyn5
1 Instituto de Radioastronomia y Astrofisica, UNAM, Campus Morelia, Michoacan, Mexico, C.P. 58089
2 Argelander Institut f¨ur Astronomie, Universit¨at Bonn, Auf dem H¨ugel 71, D-53121 Bonn, Germany
3 Instituto de Astrof´ısica, Pontificia Universidad Cat´olica de Chile, Av. Vicu˜na Mackenna 4860, 7820436 Macul, Santiago, Chile
4 Max-Planck Institut f¨ur Astronomie, K¨onigstuhl 17, D-69117 Heidelberg, Germany and
5 Herzberg Institute of Astrophysics, National Research Council of Canada, Victoria, BC V9E 2E7, Canada
ABSTRACT
We aim to explore the relationship between globular cluster total number, NGC, and
central black hole mass, M•, in spiral galaxies, and compare it with that recently
ported for ellipticals. We present results for the Sbc galaxy NGC 4258, from Canada France Hawaii Telescope data. Thanks to water masers with Keplerian rotation in a circumnuclear disk, NGC 4258 has the most precisely measured extragalactic distance and supermassive black hole mass to date. The globular cluster (GC) candidate
se-lection is based on the (u∗ − i0) vs. (i0 − K
s) diagram, which is a superb tool to
distinguish GCs from foreground stars, background galaxies, and young stellar clus-ters, and hence can provide the best number counts of GCs from photometry alone, virtually free of contamination, even if the galaxy is not completely edge-on. The mean optical and optical-near infrared colors of the clusters are consistent with those of the Milky Way and M 31, after extinction is taken into account. We directly identify 39 GC candidates; after completeness correction, GC luminosity function extrapolation
and correction for spatial coverage, we calculate a total NGC = 144 ± 31+38−36 (random
and systematic uncertainties, respectively). We have thus increased to 6 the sample
of spiral galaxies with measurements of both M• and NGC. NGC 4258 has a specific
frequency SN = 0.4 ± 0.1 (random uncertainty), and is consistent within 2σ with the
NGC vs. M• correlation followed by elliptical galaxies. The Milky Way continues to be
the only spiral that deviates significantly from the relation.
Keywords: black hole physics — galaxies: spiral — galaxies: formation — galaxies: evolution — galaxies: star clusters: general — globular clusters: general — galaxies: individual (NGC 4258)
1. INTRODUCTION
It is virtually certain that all massive galaxies contain central black holes. In spheroidal systems, the
e.g., Kormendy 1993; Kormendy & Richstone 1995; Magorrian et al. 1998; Kormendy & Gebhardt 2001; Marconi & Hunt 2003;G¨ultekin et al. 2009), mass (e.g., Dressler 1989;Magorrian et al. 1998;
Laor 2001; McLure & Dunlop 2002;Marconi & Hunt 2003;H¨aring & Rix 2004), and stellar velocity
dispersion (the M•–σ∗ relation, e.g., Ferrarese & Merritt 2000;Gebhardt et al. 2000; Tremaine et al.
2002;G¨ultekin et al. 2009). Spitler & Forbes(2009) also find a relation between black hole mass and dark matter halo mass, as inferred from globular cluster system total mass. Such correlations could be the result of central black hole and spheroid evolution. Exploring the limits and deviations from these correlations can help illuminate the different evolutionary processes that influence the growth
of galaxies and their black holes (e.g., McConnell et al. 2011).
It is unclear whether spiral galaxies fall on these relations. At least in the case of the M•–σ∗
and M•–Mbulge relations, although they exist for spirals, they appear to have larger scatter than for
ellipticals. Also, some barred spirals and pseudobulges can be up to one order of magnitude offset in
the M•–σ∗ diagram, with black holes that are too small for the velocity dispersion of the bulge (e.g.,
Hu 2008; Greene et al. 2008; Gadotti & Kauffmann 2009; Greene et al. 2010). The scatter could be caused by measurement uncertainties, but it could also be intrinsic, e.g., if black hole growth is stochastic to some extent, depending on inward gas flow and galaxy-to-galaxy differences in gas
accretion rates. Graham (2012a,b) suggests that the M•–Lbulge and M•–Mbulge relations might be
broken or curved for galaxies with MB > −20.5 mag, even if they have real bulges. L¨asker et al.
(2016) also find hints that a galaxy’s low mass may be more of a determinant than the absence of a
classical bulge.
Interestingly, Burkert & Tremaine (2010) and, with more data, Harris & Harris (2011); Harris et
al.(2014) have shown that the central black hole mass of elliptical galaxies increases almost exactly
proportionally to the total number of their globular clusters, NGC. The correlation can be expressed
The most likely link between NGC and M•is the galaxy potential well/binding energy (M∗σ2∗, where
M∗ is the bulge stellar mass), with which both quantities are correlated (e.g., Snyder et al. 2011;
Rhode 2012). However, given the extremely disparate scales of both components, the tightness of
the correlation is intriguing and has been intensely explored. Kormendy & Ho (2013) review the
status of these endeavors. For example, Harris et al. (2013) find that NGC ∝ (Reσe)1.3, with Re the
effective radius of the galaxy light profile (bulge+disk) and σe the velocity dispersion at the half-light
radius. On the other hand, while Sadoun & Colin(2012) show that the correlation between M• and
the velocity dispersion of globular cluster systems as a whole is tighter for red than for blue GCs in a
sample of 12 galaxies, Pota et al.(2013) do not find a significantly smaller scatter in the correlation
for either one of the blue and red subsystems in an enlarged sample of 21 galaxies with better M•
measurements. Regarding NGC, Rhode (2012) finds that the number of blue GCs correlates better
with M•. Also, for the few spirals in her sample,Rhode(2012) gets a better correlation of NGC with
bulge light than with total light; however, the correlation of NGC is much tighter with total galaxy
stellar mass than with bulge mass. de Souza et al.(2015) perform an exhaustive analysis of the NGC
vs. M• relation from the point of view of Bayesian statistics; they conclude that black hole mass is
a good predictor of total number of GCs.
The NGC vs. M• correlation could be rooted in the initial conditions of galaxy formation or in the
process of galaxy assembly, and the scaling relations between different galaxy components could give clues about which origin is more likely.
Precisely because of the 10 orders of magnitude that separate the spatial scales of supermassive black holes (SMBHs) and globular cluster systems, a direct causal link has been often quickly dismissed with the argument that bigger galaxies should have more of everything. Nontheless, possible causal
relations have been proposed. Harris et al. (2014) offer a review of them, namely: star (and hence
cannibalization of GCs (e.g., Capuzzo-Dolcetta & Donnarumma 2001; Capuzzo-Dolcetta & Vicari 2005; Capuzzo-Dolcetta & Mastrobuono-Battisti 2009; Gnedin et al. 2014), especially efficient if all
GCs contain intermediate mass BHs (Jalali et al. 2012). Another mechanism for the establishment
of scaling relations would be the statistical convergence process of galaxy characteristics through
hierarchical galaxy formation (Peng 2007; Jahnke & Macci`o 2011).
Besides the issue of its origin, a well understood NGC – M• correlation could be useful as a tool to
estimate masses of inactive black holes, that would otherwise be hard to measure.
Before the present work, there were only 5 spiral galaxies with precise measurements of both NGC
and M•: the Milky Way (MW, Sbc), M 104 (Sa), M 81 (Sab), M 31 (Sb) and NGC 253 (Sc). All of
them, with the notable exception of the MW, fall right on the NGC− M• correlation for ellipticals.
Our Galaxy has a black hole that is about 1 order of magnitude lighter than expected from its NGC.
Spirals have both less massive black holes and less rich GC systems than ellipticals and lenticulars, and hence have been studied much less frequently than early type galaxies. Concerning in particular GCs, internal extinction and potential confusion with stars and star clusters in their galactic disks have in general further limited studies in spirals to galaxies seen edge-on.
In what follows, we present new measurements and analysis of the globular cluster system of the Sbc galaxy NGC 4258 (M 106). Thanks to water masers in a disk orbiting its nucleus, its absolute
distance has been derived directly by geometric means (Herrnstein et al. 1999). NGC 4258 hence has
the most precisely measured extragalactic distance and SMBH mass to date, i.e., 7.60±0.17±0.15
Mpc (formal fitting and systematic errors, respectively) and (4.00±0.09)×107M (Humphreys et al.
2013). In spite of being the archaetypical megamaser galaxy, however, NGC 4258 has a classical
bulge, unlike most other megamaser galaxies (L¨asker et al. 2014,2016); it also falls on the M•–Lbulge
and M•–Mbulge for ellipticals (Sani et al. 2011; L¨asker et al. 2016). With an inclination to the line
application of the (u∗ − i0) vs. (i0− K
s) diagram technique (u∗i0Ks hereafter; Mu˜noz et al. 2014) to
a spiral galaxy. We will show that with this procedure one can get the best total number counts of GCs from photometry alone that are virtually free of contamination from foreground stars and
background galaxies, without the need to obtain radial velocity measurements. In addition, the u∗i0Ks
plot can easily weed out young star clusters in a spiral disk. We will quantify the efficiency of the
u∗i0Ks diagram to produce a clean sample of GC candidates (GCCs) in a disk galaxy.
2. DATA
All data for the present work were obtained with the Canada-France-Hawaii-Telescope (CFHT).
The optical images of NGC 4258 are all archival, and were acquired with MegaCam (Boulade et al.
2003). MegaCam has 36 2048×4612 CCD42-90 detectors operating at -120◦ C, and sensitive from
3700 to 9000 ˚A; read-out-noise and gain are, respectively, < 5 e− pixel−1 and ∼ 1.62 e− ADU−1. The
detectors are arranged in a 9×4 mosaic with 1300 small gaps between CCD columns, and 8000 large
gaps between CCD rows. The field-of-view (FOV) of MegaCam is 0.◦96 × 0.◦94, with a plate scale of
0.00186 pixel−1.
Images were originally secured through programs 08BH55, 09AH42, 09AH98, 09BH95 (P.I. E.
Magnier, u∗-band); 09AC04 (P.I. R. L¨asker, u∗ and i0 filters); 10AT01 (P.I. C. Ngeow, g0, r0, and i0
bands), and 11AC08 (P.I. G. Harris, g0 and i0 data).
Before archiving, MegaCam images are “detrended”, i.e., corrected for the instrumental response
(bad pixel removal, overscan and bias corrections, and flat-fielding, plus defringing for the i0 and z0
bands) with the Elixir software (Magnier & Cuillandre 2004). Elixir also provides a global astrometric
calibration with an accuracy of 0.005 – 1.000, and a photometric calibration with a uniform zero point
whose internal accuracy is better than 1% for the entire image.
the MegaPipe pipeline (Gwyn 2008). MegaPipe groups the images by passband; resamples them to correct the geometric distortion of the MegaCam focal plane; recalibrates the astrometry to achieve
internal and external accuracies of 0.0004 and 0.0015, respectively; recalibrates the photometry, mainly
to account for modifications made to the Elixir pipeline in different epochs, with an output accuracy of 0.03 mag; and finally stacks them.
The Ks-band images of NGC 4258 were acquired on 2013 March 27 UT, through proposal 13AC98
(P.I. R. Gonz´alez-L´opezlira), with the Wide-field InfraRed Camera (WIRCam; Puget et al. 2004).
WIRCam has four 2048×2048 HAWAII2-RG HgCdTe detectors, cooled cryogenically to ∼ 80◦ K, and
sensitive at 0.9-2.4 µm; read-out-noise and gain are, respectively, 30 e− pixel−1 and 3.7 e− ADU−1.
The detectors are organized in a 2×2 mosaic with 4500 interchip gaps. The FOV of the WIRCam is
∼ 210× 210, with a plate scale of 0.00307 pixel−1.
We obtained 10×20 s individual Ks exposures of NGC 4258. The telescope pointing was dithered
in an approximately circular pattern with a radius ∼ 1.06. Because of the galaxy large diameter
compared to WIRCam’s FOV (R25 = 9.03;de Vaucouleurs et al. 1991), separate 10×20 s sky frames
were taken 2.◦1 away, with the same circular pattern, using the following target(T)-sky(S) sequence:
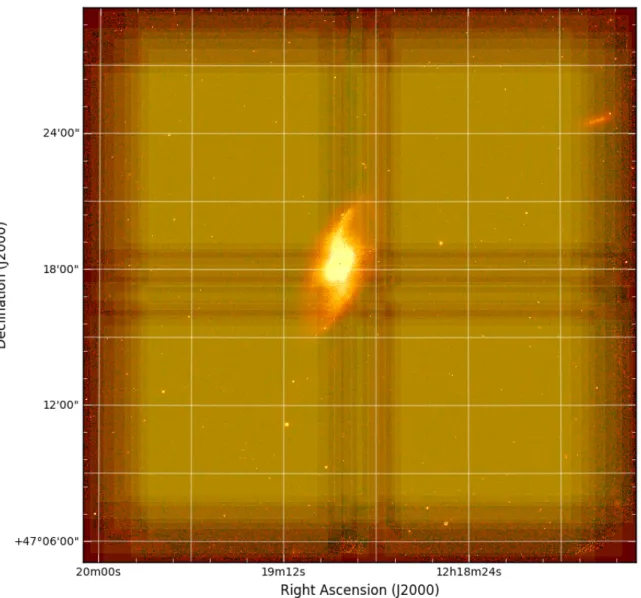
STTSSTTSS...TTS. Figure 1 displays the sky-coverage map for the galaxy overlaid on our final Ks
-band mosaic; number of overlapping exposures increases with color intensity, up to a maximum of 10.
In the case of WIRCam images, detrending is performed by the I’iwi pipeline.1 Detrending includes
saturated pixel flagging; non-linearity correction; bias (reference pixel) and dark current subtraction; flat-fielding, and bad pixel masking. I’iwi also gives a global astrometric calibration with an accuracy
of 0.005 – 0.008; the photometric zero point however, is different for each of the WIRCam detectors at
Figure 1. NGC 4258 coverage map on our final Ks-band image. Number of overlapping exposures increases
with color intensity, up to 10. This figure was made with the Kapteyn software package (Terlouw & Vogelaar 2015).
the end of the I’iwi processing.
To produce the final Ks-band mosaic of NGC 4258, individual images were sky-subtracted and
combined with the WIRwolf pipeline (Gwyn 2014). Like MegaPipe, WIRwolf resamples the individual
images; recalibrates their astrometry to a typical internal accuracy of 0.001; provides a uniform zero
point for the four detectors; and stacks them.
Both MegaPrime and WIRwolf output images with photometry in the AB system (Oke 1974), with
Table 1. NGC 4258 Observation Log
Filter λacen FWHMb Exposure Camera Pixel size Program Date
s 00 UT u∗ 3793 ˚A 654 ˚A 13360 Megacam 0.186 08BH55 2008 December 22, 23 09AC04 2009 February 18 09AH42 2009 March 27, 30 09AH98 2009 April 19 09BH95 2009 December 11
g0 4872 ˚A 1434 ˚A 10400 Megacam 0.186 10AT01 2010 June 11, 12; July 7, 8 11AC08 2011 March 1
r0 6276 ˚A 1219 ˚A 3500 Megacam 0.186 10AT01 2010 June 16; July 8, 12 i0 7615 ˚A 1571 ˚A 8080 Megacam 0.186 09AC04 2009 February 26
10AT01 2010 June 10, 12, 13, 15; July 8,12 Ks 2.15 µm 0.33 µm 200 WIRCam 0.307 13AC98 2013 March 27
Note—aThe central wavelength between the two points defining FWMH (http://svo2.cab.inta-csic.es/ svo/theory/fps3/index.php?id=CFHT/).
b Ibid.
will be limited by the Ks-band image of NGC 4258.
Table 1 gives a summary of the NGC 4258 observations.
3. DETECTION AND PHOTOMETRY
Source detection and photometric measurements in all the stacked images were carried out with
SExtractor (Bertin & Arnouts 1996) and PSFEx (Bertin 2011). PSFEx employs point sources
can then apply in a second pass to obtain PSF magnitudes of sources. We used versions 2.8.6 (first pass) and 2.19.4 (second pass) of SExtractor, and PSFEx version 3.9.1.
Although PSFEx can select automatically sources (PSF stars) to build the model PSF, instead we chose adequate stars manually, carefully discarding saturated, extended, and spurious sources. The selection is based on the brightness vs. compactness parameter space, as measured by SExtractor
parameters MAG AUTO and FLUX RADIUS,2 respectively. The plot is shown in Figure 2 for all
passbands, with PSF stars highlighted as red dots. The selection criteria, as well as the number of detected (in both the first, SEx 1, and second, SEx 2, runs of SExtractor) and chosen points at each
wavelength, are listed in Table 2. In order for PSFEx to work, one needs to have VIGNET as an
output parameter in a previous run of SExtractor. VIGNET(width,height) specifies the size in pixels of the region around each PSF star that will be considered; one also needs to instruct SExtractor to perform photometry in a circular aperture with a diameter PHOT APERTURES of the same size. These size and aperture must be enough to include most of the stellar flux, but as small as possible to minimize the risk of contamination from other objects. The VIGNET (and hence aperture) sizes
are likewise shown in Table 2.
The spatial variations of the PSF were modeled with polynomials of degree 4 for the optical
mo-saics, and of degree 2 for the smaller Ks image. When running with a PSF model, SExtractor can
measure PSF magnitudes (MAG PSF) and produce another, very useful, estimator of shape, called SPREAD MODEL. The SPREAD MODEL value for each object results from the comparison
be-2 FLUX RADIUS estimates the radius of the circle centered on the light barycenter that encloses about half of the to-tal flux. 2×FLUX RADIUS equals the FWHM for a Gaussian profile, but for seeing-limited images 2×FLUX RADIUS ∼ 1.05 – 1.1 FWHM; for profiles with a significant fraction of flux in the wings, the difference can be much larger (http://www.astromatic.net/forum/showthread.php?tid=516). MAG AUTO is a Kron-like (Kron 1980) elliptical aperture magnitude (http://terapix.iap.fr/article.php?id_article=628). The radius, ellipticity, and position angle of the aperture are defined from the first and second moments of the object’s light profile (Bertin & Arnouts 1996).
Table 2. PSFEx Parameters
FLUX RADIUS MAG AUTO N sources
Filter VIGNET Min Max Min Max Total PSF stars
pixel × pixel pixel mag SEx 1/ SEx 2
u∗ 20 × 20 2.35 2.60 17.0 22.5 132183/132276 915 g0 20 × 20 2.35 2.60 18.5 22.5 233053/232304 1247 r0 20 × 20 2.40 2.70 17.0 22.0 122867/122867 1855 i0 20 × 20 1.80 2.20 18.0 22.0 218200/218142 2173
Ks 15 × 15 1.45 1.70 16.0 19.5 9276/9272 145
tween its best fitting PSF, and the convolution of such PSF with an exponential disk with scale
length FWHMPSF/16., where FWHMPSF is the full width at half max of the same PSF (Desai et al.
2012).
4. COMPLETENESS
Completeness tests were only performed on the Ks-band data; this is the smallest and shallowest
image and in fact sets our object detection limit. In order to determine the GC detection completeness as a function of magnitude, ∼ 320,000 artificial point sources were generated based on the PSF model,
in the interval 17 mag < mKs < 23 mag, and with a uniform, or box-shaped, magnitude distribution.
Due to the WIRCam pixel size, 0.00307 or & 11 pc at the distance of NGC 4258, GCCs are unresolved
in the Ks-band image.
The artificial objects were added only ∼1000 at a time (we call this one simulation), in order to
prevent creating artificial crowding. The Ks-band image of NGC 4258 was divided into square bins
FLUX_RADIUS (arcsec) FLUX_RADIUS (arcsec) MAG_AUTO (mag) 0.19 0.28 0.37 0.47 0.56 0.65 0.75 0.19 0.28 0.37 0.47 0.56 0.65 0.75 0.19 0.28 0.37 0.47 0.56 0.65 0.75 0.19 0.28 0.37 0.47 0.56 0.65 0.75 0.15 0.31 0.46 0.61 0.77 0.92
Figure 2. PSF star selection. Plots of MAG AUTO vs. FLUX RADIUS for the u∗ (top left), g0 (top right), r0 (middle left), i0 (middle right), and Ks (bottom left) bands. Point sources are located in the vertical
columns of dots; saturated sources lie in the plume at roughly constant MAG AUTO; the cloud at faint magnitudes contains both extended and spurious sources, like cosmic rays. Selected PSF stars are shown as red dots.
added sources were random, but assigned avoiding overlapping with other artificial objects or with real sources identified by the SExtractor segmentation map. To reach 320,000 artificial sources for the whole image, we carried out 160 simulation pairs, i.e., we produced 320 images, each one with ∼ 1000 added sources, but there were only 160 different sets of positions. The artificial objects in a simulation pair had the same positions, but their magnitudes were different in each of the two members of the pair.
SExtractor was then run on each one of the 320 simulated images, with the same parameters used
for the original Ks-band image of NGC 4258, and the recovered artificial sources were identified by
cross-matching the positions of all detections with the known input coordinates of the added objects.
Aside from non-detections, objects with SExtractor output parameter FLAGS 6= 0 were eliminated.3
The requirement FLAGS=0 excludes artificial objects falling on top of other artificial or real sources, and hence discards preferentially added objects in crowded regions. The criterion FLAGS=0 was
also applied in the selection of true sources (see Section 5).
Given that NGC 4258 is a spiral galaxy, and not edge-on, it was of particular interest to quantify the effect of the disk on source detection. Since the detection magnitude limit is affected by object crowding and background brightness level, we estimated completeness in four different regions within
1.7 R25of NGC 4258, roughly at the edge of our Ks-band image (R25= 9.03 or 20.5 kpc;de Vaucouleurs
et al. 1991).4
We explored an ellipse with semimajor axis = 0.5 R25, and three elliptical annuli, respectively, from
0.5 to 1.0 R25, from 1.0 to 1.4 R25, and between 1.4 and 1.7 R25. All 4 regions have the axis ratio
and position angle (P.A.) of the observed disk of NGC 4258, i.e., 0.39 and 150◦, respectively (de
3Different values of FLAGS indicate various problems with the photometry. For instance, sources with close bright neighbors have FLAGS = 1; blended objects, FLAGS = 2; saturated sources, FLAGS = 4.
4 Assuming R
25 = 13.4 kpc for the Milky Way (Goodwin et al. 1998), ∼ 85% of its GCs lie within 1.7 R25 (http://physwww.physics.mcmaster.ca/~harris/mwgc.dat).
Vaucouleurs et al. 1991). In order to estimate completeness in these four regions with statistically equivalent samples, we made sure that the added sources were inversely proportional to their area. Hence, the number of simulations considered for each region was different, respectively, 320, 106, 83,
and 97.5 On average, ∼ 13,300 artificial sources were added to each one of the three annuli. We will
discuss the central ellipse separately below.
In the case of a box-shaped magnitude distribution, the fraction of recovered sources as a function
of magnitude is well described by the Pritchet function (e.g., McLaughlin et al. 1994):
f (m) = 1 2 " 1 − αcutoff(m − mlim) p1 + α2 cutoff(m − mlim)2 # ; (1)
mlim is the magnitude at which completeness is 50%, and αcutoff determines the steepness of the
cutoff.
The fraction of recovered to added sources as a function of output PSF magnitude, in bins 0.25
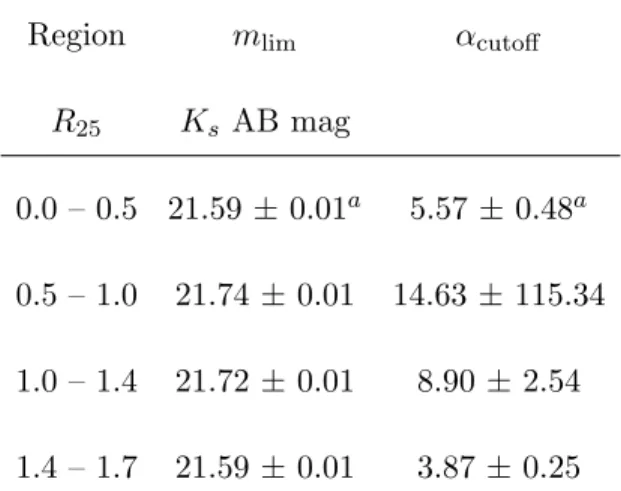
mag wide, was fit with equation 1 separately for each region. The values of the fit parameters mlim
and αcutoff are shown in Table 3.
In Figure 3we display the added and recovered sources, in the left and center panels, respectively.
The right panel shows the fractions of recovered to added objects vs. Ks mag, as well as the fits to
them (solid lines) with eq.1.
There are some results of this completeness test that stand out: (1) the similarity between the
detection magnitude limit in the Ks band data and the mlim values in all the annuli beyond 0.5
R25; (2) the brighter mlim of the ring with the largest galactocentric distance (1.4 to 1.7 R25, yellow
points), compared with those of the two intermediate annuli (0.5 to 1.4 R25, blue and green), and
5 The outermost annulus spills over the borders of the image, and hence does not have the area of a complete elliptical ring.
Table 3. Completeness Fit Parameters
Region mlim αcutoff
R25 Ks AB mag
0.0 – 0.5 21.59 ± 0.01a 5.57 ± 0.48a 0.5 – 1.0 21.74 ± 0.01 14.63 ± 115.34 1.0 – 1.4 21.72 ± 0.01 8.90 ± 2.54 1.4 – 1.7 21.59 ± 0.01 3.87 ± 0.25 Note— aErrors calculated by Monte Carlo
resampling, with dispersion estimated from the rms of the fit.
Figure 3. Completeness tests. Left: added sources. Center: recovered sources. Right: fits (solid lines) to recovered fractions (dots) with eq. 1. Colors (red, blue, green, yellow) refer to centermost ellipse, and inner, middle, and external annuli, respectively. Blue dotted lines indicate the 90% and 50% completeness values.
(3) the fact that there is a region close to the center where the condition to avoid overlap with real sources prevented the addition of artificial objects.
the lack of a large low surface brightness envelope around the galaxy. In ellipticals, an envelope of
completely unresolved stars results in a radial gradient of S/N that is reflected in a mlimthat likewise
changes with radius.
Thus, compared to the usual case of ellipticals, the brighter mlim in the annulus furthest away from
the galaxy is counterintuitive. However, the brighter mlim of the annulus between 1.4 and 1.7 R25 is
a consequence of it being too close to the top and bottom edges of the image, where fewer frames contribute to the final mosaic and hence the signal-to-noise ratio is slightly smaller. We confirmed
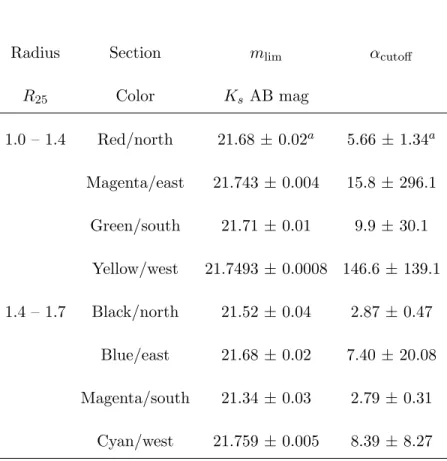
this by dividing the two most external rings in four sections, as shown in the left panel of Figure 4.
The central and right panels of Figure4show the fit with eq. 1to the fraction of recovered to added
sources vs. Ks magnitude for the four sections, respectively, of the inner and outermost rings; the
parameters of the fits are listed in Table4.
Figure 4. Completeness tests for middle and external annuli by sections. Left: Added sources to rings be-tween 1.0 and 1.4 R25(counterclockwise, from top, red/north, magenta/east, green/south, and yellow/west),
and from 1.4 to 1.7 R25 (black/north, blue/east, magenta/south, cyan/west). Center: fits (solid lines) to
recovered fractions (dots) in middle annulus with eq. 1. Right: fits to recovered fractions in external ring.
Table 4. Completeness Fit Parameters of Middle and External Annuli by Section
Radius Section mlim αcutoff
R25 Color Ks AB mag 1.0 – 1.4 Red/north 21.68 ± 0.02a 5.66 ± 1.34a Magenta/east 21.743 ± 0.004 15.8 ± 296.1 Green/south 21.71 ± 0.01 9.9 ± 30.1 Yellow/west 21.7493 ± 0.0008 146.6 ± 139.1 1.4 – 1.7 Black/north 21.52 ± 0.04 2.87 ± 0.47 Blue/east 21.68 ± 0.02 7.40 ± 20.08 Magenta/south 21.34 ± 0.03 2.79 ± 0.31 Cyan/west 21.759 ± 0.005 8.39 ± 8.27 Note— aErrors calculated by Monte Carlo resampling, with
dispersion estimated from the rms of the fit.
1.4 R25, for the outermost annulus there is a significant difference between the top/north and
bot-tom/south sections, on the one hand, and the left/east and right/west sections, on the other. This is consistent with our interpretation that the source detection limit in the ring between 1.4 and 1.7
R25 is brighter because fewer sub-integrations contribute to the final mosaic at the edges.
On the other hand, the inability to add sources in the brightest areas of the bulge and arms implies that they are strongly affected by confusion, due to partially resolved stars and star clusters. Indeed,
we are not reporting the detection of any real sources there (see Figure 10), precisely because no
objects have been found in those areas that are not blended or close to bright neighbors. We are aware that we have very likely missed GCCs in the brightest regions close to the center. On this
same issue, it is truly remarkable that the galactic disk between ∼ 0.5 and 1 R25 is not having a very
significant effect, neither on the addition of artificial sources nor on their recovery, compared with
regions farther away from the center of the galaxy. An inspection of Figure 3reveals that confusion
should not be hampering our GCC detection beyond ∼ 0.4R25. Given the very small completeness
corrections that we have derived beyond 0.5 R25 (and that we will duly apply in Section 7.2), the
most important result of the completeness simulations is precisely this realization.
5. THE u∗i0Ks DIAGRAM
Color-color diagrams are routinely used as efficient tools for the classification and selection of sources
in astrophysical surveys. In particular, for GCs, examples include (r0 - i0) vs. (g0 - i0) with CFHT data
(Pota et al. 2015); (F438W - F606W) vs. (F606W - F814W) with Hubble Space Telescope (HST)
filters (Fedotov et al. 2011), and (U − B) vs. (V − I) with Very Large Telescope (VLT) images
(Georgiev et al. 2006).
Recently,Mu˜noz et al.(2014) have shown that the combination of optical and near infrared (NIR)
data into the (u∗- i0) vs. (i0- Ks) color-color diagram provides the most powerful photometric only
method for the selection of a clean sample of GC candidates. The u∗i0Ks diagram in fact makes use
of the whole spectral range between the ultraviolet (UV) and NIR atmospheric cutoffs, at 3200 ˚A and
2.2 µm, respectively. Thus, it samples simultaneously the main-sequence turnoff, and the red giant
and horizontal branches of the stellar populations in GCs. In the u∗i0Ks plane, the nearly simple
stellar populations (SSPs) of GCs occupy a region that is well separated from, respectively, the loci of the composite stellar populations of background galaxies, and of foreground stars in our own Galaxy.
As demonstrated also by Mu˜noz et al. (2014), the separation of these 3 distinct regions (i.e., GCs,
galaxies, and MW stars) from the point of view of stellar populations is completely consistent with the shape parameters of the objects that inhabit them. In the case of Virgo data acquired with the
CFHT6, sources in the galaxy region are clearly extended, those in the star band are pointlike, and many GCCs are marginally resolved.
Figure 5 presents the u∗i0Ks plot for our NGC 4258 data (small solid black dots). Sources were
selected by cross-matching detections by RA, DEC in our u∗, i0, and Ks catalogs, with a tolerance of
100. The data were corrected for Galactic extinction with theSchlafly & Finkbeiner(2011) values given
for the Sloan Digital Sky Survey (SDSS) filters by the NASA Extragalactic Database:7 Au = 0.069;
Ag = 0.054; Ar = 0.037; Ai = 0.028; AKs = 0.005. Only data with SExtractor FLAGS=0 in all
filters, and an error MAGERR PSF < 0.2 mag in MAG PSF in the i0-band were included. Also,
since we are interested in GCs, whose luminosity function (GCLF) is practically universal, we only kept those objects within ± 3σ of the expected LF turnover (LFTO) magnitude in every filter; we
assumed σ = 1.2 mag which, according toJord´an et al.(2007), is appropriate given the absolute total
dereddened B mag of NGC 4258 (-20.87 mag; de Vaucouleurs et al. 1991). Values of the turnover in
the optical were derived by combining the absolute TO magnitude in the g band, Mg0 = −7.2 mag,
for the same galaxy luminosity (Jord´an et al. 2007), with the (AB) colors given in the MegaCam
filter system by Bruzual & Charlot (2003, hereafter BC03) models for an SSP with Z = 0.0004, an
age of 12 Gyr, and a Chabrier initial mass function (IMF; Chabrier 2003). The TO in the V -band
would be M0
V = −7.4 mag. The TO magnitude in the Ks-band was taken from Wang et al. (2014).8
TO absolute magnitudes, observed TO magnitudes at the distance of NGC 4258, and magnitude
ranges of the GCLF are shown in Table 5.
In Figure 5, the green long-dashed line separates the cloud of background galaxies from the band
6 Next Generation Virgo Survey (NGVS;Ferrarese et al. 2012) and NGVS-IR (Mu˜noz et al. 2014).
7The NASA/IPA Extragalactic Database (NED) is operated by the Jet Propulsion Laboratory, California Institute of Technology, under contract with the National Aeronautics and Space Administration.
8 Wang et al.(2014) determine a TO magnitude K
s0 = 14.534+0.142−0.146 mag for the M 31 GC system, with a Vega zero point. We apply to this value the distance modulus of Andromeda, and the transformation between Vega and WIRCam AB magnitudes (see Section7.1).
Table 5. Turnover magnitudes and GCLF ranges
Filter M0 m0TO m0TO± 3σ
mag mag mag
u∗ -6.34 23.06 19.46 < m0u∗< 26.66 g0 -7.20 22.20 18.60 < m0g0 < 25.8 r0 -7.69 21.71 18.11 < m0r0 < 25.31
i0 -7.92 21.48 17.88 < m0i0 < 25.08 Ks -8.1 21.3 17.7 < m0Ks< 24.9
of foreground stars in the MW: objects above the line are mostly extended, sources below it are preferentially point sources, as we will show in the next subsection. The orange contour highlights the region that contains GCCs. This region was traced based on the area with the highest density of
spectroscopically confirmed GCs in the u∗i0Ks diagram of M 87 (Mu˜noz et al. 2014; Powalka et al.
2016); there are more than 2000 such sources in the GC system of M 87, and hence the GCC locus
is clearly delimited. Inside the region in our plot for NGC 4258, we indicate the location of BC03 model SSPs. Each cluster of triangles represents an age sequence with a single metallicity, from Z = 0.0004 to Z = 0.05. Within each age sequence, from bluer to redder colors, models go from 8 to 12 Gyr. For illustration purposes, zero age main sequences (ZAMS) with Z = 0.008 and Z = 0.02 are shown; they sketch the locus of field stars in the MW.
Because we are interested in the GC systems of nearby spiral galaxies that are not completely
edge-on, it was important to investigate the locus in the u∗i0Ks plane of young stellar cluster candidates
ages, from blue to red in (i0 -Ks), between 107 and 108 yr (pink triangles). They are reasonably far
away from models of old stellar populations of all metallicities. Moreover, we would like to emphasize the direction of the reddening vector in this parameter space. Although extinction could make a GC look older or more metal rich if detected through the disk of its parent galaxy, reddening would not
be able to make a YSC in the disk of the galaxy look like an old GC. This is a property of the u∗i0Ks
diagram that makes it an ideal tool to study GC systems in spiral galaxies.
AV=1
Figure 5. u∗i0Ks color–color diagram of NGC 4258. Black dots: sources with MAGERR PSF < 0.2 mag in
the i0-band. Clusters of triangles inside the orange ellipse are age sequences, from 8 to 12 Gyr, of old SSPs with a single metallicity, i.e., blue: Z = 0.0004; dark green: Z = 0.004; cyan: Z = 0.008; olive: Z = 0.02; purple: Z = 0.05. Data points inside the orange ellipse are GCCs. Pink triangles inside the blue ellipse are an age sequence, from 107 to 108 yr, for an SSPs with solar metallicity; data points there are YSCCs. The cyan and red lines sketch the loci of ZAMSs with Z = 0.008 and Z = 0.02, respectively.
Regarding the shape of the sources on the u∗i0Ks plot, Figure 6 shows four different gauges of
compactness in the i0-band: FWHM (top left); SPREAD MODEL (top right); FLUX RADIUS
(bottom left); CLASS STAR9 (bottom right). Their values are coded as indicated by the color bars,
and all of them show a correlation between locus in the color-color diagram and light concentration. Objects in the background galaxy cloud (mostly reddish-brown) are more extended than those in the Galactic star band (mostly blue), and many GCCs at the distance of NGC 4258 appear marginally
resolved (cyan). Typical GC have effective radii between one and 20 pc (van den Bergh 1995;Jord´an
et al. 2005;Puzia et al. 2014, e.g.); one MegaCam pixel = 6.9 pc at the adopted distance to NGC 4258,
and the PSF FWHM of the i0 data is 0.0060 or 22 pc. In Figure 6 one can see that point sources and
marginally resolved objects have FWHM . 0.008; SPREAD MODEL < 0.015; FLUX RADIUS . 0.005;
CLASS STAR &0.4. Although not discrete, the transition value of SPREAD MODEL between point sources and extended objects lies between ∼ 0.003 and 0.005, consistent with those reported
by, respectively, Desai et al. (2012) and Annunziatella et al. (2013). Separation by compactness is
most efficient for FWHM and SPREAD MODEL, i.e., these parameters provide the best contrast between point sources, marginally resolved, and extended sources.
5.2. Other diagrams
For comparison, we show in Figure 7 color-color diagrams for the sources in the NGC 4258 field,
with other combinations of CFHT filters. These are analogous to those used in works by Georgiev
et al. (2006), Fedotov et al. (2011), and Pota et al. (2015). The three diagrams have many more
points than our u∗i0Ks diagram, since all available archival optical data are much deeper than our
Ks image.
9 The SExtractor dimensionless index CLASS STAR is assigned by a neural network, based on the comparison between the source and the PSF. It goes from 0 for extended objects to 1 for a perfect point source (Bertin & Arnouts 1996;Hammer et al. 2010).
1 0 1 2 3 4 5 6 ( u ∗− i 0)0 2 1 0 1 2 3 4 ( i 0 − Ks ) 0 0.60 0.64 0.68 0.72 0.76 0.80 0.84 0.88 0.92 FWHM (arcsec) 1 0 1 2 3 4 5 6 ( u ∗− i 0)0 2 1 0 1 2 3 4 ( i 0 − Ks ) 0 0.00 0.25 0.50 0.75 1.00 1.25 1.50 1.75 2.00 100 × SP REA D M ODE L 1 0 1 2 3 4 5 6 ( u ∗− i 0)0 2 1 0 1 2 3 4 ( i 0 − Ks ) 0 0.435 0.450 0.465 0.480 0.495 0.510 0.525 0.540 0.555
FLUX RADIUS (arcsec)
1 0 1 2 3 4 5 6 ( u ∗− i 0)0 2 1 0 1 2 3 4 ( i 0 − Ks ) 0 0.0 0.1 0.2 0.3 0.4 0.5 0.6 0.7 0.8 0.9 1.0 CLASS STAR Figure 6 . Morphology v ariation s across the u ∗ i 0 K s diagram of NGC 4258. F ou r differen t indicators of shap e in the i 0 -band, with v alues co d e d as indicated b y color bars: FWHM (top lef t); SPREAD MODEL (top right ); FLUX RADIUS (b ottom left ); CLASS ST AR (b ottom right ). Marginally resolv ed sources sp ort shades of cy an in all indeces.
The plots display models of young and old SSPs, as well as ZAMS, with the same ages and
metal-licities as in Figure 5. With the aid of the old SSP models, we have outlined with orange ellipses
the expected loci of GCCs. In all cases, the contamination by background galaxies and foreground
Galactic stars inside the ellipse is much more severe than with the u∗i0Ks diagram. The mixture
of source types in the ellipse is quite evident in Figure 8, where the shape estimators FWHM and
SPREAD MODEL in the i0-band are color-coded as previously, only for the same objects already
included in Figures 5 and 6 . Both outside and within the ellipses, all ranges of light concentration
can be found, rendering it questionable to select GCCs based on compactness and color-color diagram locus alone.
6. GCC FINAL SAMPLE
So far, with the aim of determining a sample of GC candidates for NGC 4258 we have imposed
several restrictions: objects must have MAGERR AUTO < 0.2 mag in the i0-band; lie within ± 3σ
of the expected GCLF turnover magnitude in every filter, assuming σ = 1.2 mag; and be inside the
selection region outlined in orange in the u∗i0Ks color-color diagram (Figure 5).
In order to select the most likely candidates, we also rely on the shape parameters explored in the previous sections. We find that the FWHM and SPREAD MODEL parameters calculated by SEx-tractor are particularly efficient in separating compact and marginally resolved sources in the selection
region from more extended ones (see Figure 6). Hence, we keep sources with SPREAD MODEL 6
0.017, and FWHM 6 0.0084 (less than 4.5 MegaCam pixels) in the i0-band.
Given the distance to NGC 4258 (7.6 Mpc) and the angular resolution of the MegaCam data (one
MegaCam pixel = 0.00186 ' 6.9 pc), we have likewise been able to calculate the half-light radii, re, in
the i0-band (FWHM = 0.006 ' 22 pc), of all the sources inside the selection region (outlined in orange
0.0 0.5 1.0 1.5 2.0 ( g 0− i 0)0 0.2 0.0 0.2 0.4 0.6 0.8 ( r 0 − i 0 ) 0 0.0 0.5 1.0 1.5 2.0 ( g 0− i 0)0 0.0 0.5 1.0 1.5 2.0 u ( ∗ − g 0 ) 0 0.0 0.2 0.4 0.6 ( r 0− i 0)0 0.0 0.5 1.0 1.5 2.0 u ( ∗ − g 0 ) 0 Figure 7 . Alternativ e color-color diagrams. L eft: (r 0 -i 0 ) vs. (g 0 -i 0 ); midd le: (u ∗ -g 0 ) vs. (g 0 -i 0 ); right: (u ∗ -g 0 ) vs. (r 0 -i 0 ). Sym b ols for mo del SSPs and ZAMS as in Figu re 5 .
0.0
0.5
1.0
1.5
2.0
(
g
0−i
0)
00.2
0.0
0.2
0.4
0.6
0.8
(
r
0 −i
0)
0 0.60 0.64 0.68 0.72 0.76 0.80 0.84 0.88 0.92 FWHM (arcsec)0.0
0.5
1.0
1.5
2.0
(
g
0−i
0)
00.2
0.0
0.2
0.4
0.6
0.8
(
r
0 −i
0)
0 0.00 0.25 0.50 0.75 1.00 1.25 1.50 1.75 2.00 100 x SPREAD MODEL0.0
0.5
1.0
1.5
2.0
(
g
0−i
0)
00.0
0.5
1.0
1.5
2.0
(
u
∗ −g
0)
0 0.60 0.64 0.68 0.72 0.76 0.80 0.84 0.88 0.92 FWHM (arcsec)0.0
0.5
1.0
1.5
2.0
(
g
0−i
0)
00.0
0.5
1.0
1.5
2.0
(
u
∗ −g
0)
0 0.00 0.25 0.50 0.75 1.00 1.25 1.50 1.75 2.00 100 x SPREAD MODEL0.0
0.2
0.4
0.6
(
r
0−i
0)
00.0
0.5
1.0
1.5
2.0
(
u
∗ −g
0)
0 0.60 0.64 0.68 0.72 0.76 0.80 0.84 0.88 0.92 FWHM (arcsec)0.0
0.2
0.4
0.6
(
r
0−i
0)
00.0
0.5
1.0
1.5
2.0
(
u
∗ −g
0)
0 0.00 0.25 0.50 0.75 1.00 1.25 1.50 1.75 2.00 100 x SPREAD MODELFigure 8. Morphology variations in the i0-band across alternative color-color diagrams of NGC 4258. Top: (r0 - i0) vs. (g0 - i0); middle: (u∗ - g0) vs. (g0 - i0); bottom: (u∗ - g0) vs. (r0 - i0). Left column: FWHM; right column: SPREAD MODEL. Orange ellipses highlight loci of GCCs; values of shape estimators coded as in Figure 6.
the program ishape (Larsen 1999) in the BAOLAB10 software package. ishape measures the size
of a compact source by comparing its observed light profile with a suite of model clusters, generated by convolving different analytical profiles with the image PSF. For data with S/N & 30, ishape
can measure reff reliably down to ∼ 0.1 the PSF FWHM, or ∼ 2.2 pc at the distance of NGC 4258.
Objects smaller than this are effectively unresolved (Larsen 1999;Harris et al. 2009). We constructed
a spatially variable PSF from 172 isolated stars, and we fitted all the sources with King profiles (King
1962, 1966) with fixed (KINGx) concentration indices (C ≡ rtidal/rcore) of 30 and 100, and with the
concentration index left as a free parameter (KINGn) as well. For each object, the model providing
the fit to the data with the smallest χ2 residuals was then used to derive the effective radius. This
was done by applying the conversion factors between reff and FWHM given in the ishape manual.
For each source, Table 7lists its measured re, the type and C index of the best-fitting King profile,
the SNR of the data, and the χ2 of the fit.
All objects left after the cuts in SPREAD MODEL and FWHM have re 6 5.9 pc. Finally, we
eliminate four additional objects. One has colors, other than (u∗ - i0) and (i0- Ks), that are redder
than the reddest BC03 model SSPS defining GCC selection regions in alternative color-color diagrams
(see Section 5.2 and Figure 7); it is likely affected by dust. For three other ones, the re fit did not
converge; one seems to be the nucleus of the dwarf galaxy SDSS J121909.07+470523.1, located to the south of NGC 4258.
Our definitive sample comprises 39 objects, all confirmed by visual inspection. Their locations in
the u∗i0Ksdiagram are shown by the yellow points in Figure9; the rest of the objects in the selection
region are displayed in gray.
The spatial distribution is shown in Figure 10. The members of the sample are displayed as green
circles on the i0-band image of NGC 4258. The dark blue ellipse outlines the region within 0.37 R25,
where source confusion is highest. The cyan circle indicates R25. Slightly over 90% of the GCCs lie
within R25. We note that one object outside R25, to the northwest of NGC 4258, is projected close
to its companion NGC 4248, an irregular non-magellanic galaxy (de Vaucouleurs et al. 1991) with
1.0
1.5
2.0
2.5
3.0
3.5
(
u
∗
−
i
0
)
0.5
0.0
0.5
1.0
(
i
0
−
K
s
)
Figure 9. Location of the GCC final sample in the u∗i0Kscolor-color diagram. Objects in the final selection
are shown as yellow dots. Gray dots: all 58 objects in the orange delimited selection region in Figure5.
of the GCCs in the sample are given, respectively, in Table6 and Table 7.11
6.1. Decontamination
In order to estimate the possible number of contaminants (foreground stars and background galax-ies) in our sample, we use as control field CFHT observations within the Extended Groth Strip (EGS). The EGS is one of the deep fields that have been observed repeatedly in the last two decades in all the regions of the electromagnetic spectrum accessible with current technology. The original motivation to observe these fields, of which the first one was the famous Hubble Deep Field (HDF,
Williams et al. 1996), is the study of the distant universe. Therefore, they are preferably at high Galactic latitudes, in order to reduce the contribution from sources in the Milky Way, and they avoid
12h18m00.00s
30.00s
19m00.00s
30.00s
20m00.00s
RA (J2000)
+47°06'00.0"
12'00.0"
18'00.0"
24'00.0"
30'00.0"
Dec (J2000)
Figure 10. Spatial distribution of the GCC sample in NGC 4258. The GCCs are shown as green filled circles. Dark blue ellipse: boundary of area where source confusion is highest, with major axis = 0.37R25;
solid cyan line: R25.
lines of sight with known nearby galaxies.
The EGS is a 1.◦1 by 0.◦15 region located at RA = 14h19m17.84s, DEC= +52d49m26.49s (J2000),
in the constellation Ursa Major. Observations of the EGS are coordinated by the All-Wavelength
EGS International Survey (AEGIS; Davis et al. 2007) project. In particular, the EGS is one of the
four deep fields observed by CFHT within its Legacy Survey (CFHTLS; Gwyn 2012), and the one
closest to NGC 4258 in angular distance (19.◦9). The D3 field of the CFHTLS consists of observations
within the EGS centered at RA = 14h19m27.00s, DEC= +52d40m56s, 1 square degree in the bands
T able 6 . Colors of Globular Cluster Candidat e s Name RA J2000 DEC J2000 g 0 0 ∆ g 0 0 K s, 0 ∆ K s, 0 (u ∗ − i0 ) 0 ∆ (u ∗ − i0 ) 0 (g 0 − r 0 ) 0 ∆ (g 0 − r 0 ) 0 (g 0 − i0 ) 0 ∆ (g 0 − i0 ) 0 (i0 − K s ) 0 ∆ (i0 − K s ) 0 deg deg mag mag mag mag mag mag mag mag mag mag mag mag 184.46 96 47.4370 21.686 0.006 21.08 0.16 1.690 0.009 0.443 0.009 0.646 0.007 -0.04 0.16 184.54 94 47.2056 19.909 0.002 19.25 0.02 1.710 0.003 0.470 0.003 0.675 0.003 -0.02 0.02 184.58 67 47.0948 19.165 0.002 18.14 0.02 1.771 0.002 0.582 0.002 0.883 0.002 0.14 0.02 184.60 45 47.4107 20.455 0.003 19.16 0.02 1.983 0.005 0.640 0.004 0.956 0.004 0.34 0.02 184.64 79 47.4146 19.809 0.002 19.15 0.02 1.688 0.004 0.488 0.003 0.692 0.003 -0.03 0.02 184.64 97 47.3963 21.410 0.006 20.65 0.08 1.712 0.009 0.505 0.008 0.752 0.007 0.00 0.08 184.65 93 47.4305 21.320 0.006 20.54 0.07 1.882 0.009 0.556 0.008 0.766 0.007 0.01 0.07 184.66 68 47.3809 22.075 0.007 21.11 0.12 1.992 0.013 0.591 0.011 0.830 0.009 0.14 0.12 184.66 77 47.1852 21.102 0.004 20.44 0.06 1.805 0.007 0.449 0.007 0.664 0.006 -0.00 0.06 184.67 15 47.3255 20.653 0.003 19.94 0.04 1.746 0.005 0.467 0.005 0.656 0.004 0.06 0.04 able 6 is published in its en tiret y in the mac hine-readable format. A p ortion is sho wn here for guidance regarding its form and con ten t.
T able 7 . i 0 -Band Shap e P arameters of Globular Cluster Candidates Name RA J2000 DEC J2000 100 × (SPREAD MODEL) i 0 FWHM i 0 CLASS ST AR i 0 FLUX RADIUS i 0 re ,i 0 Shap e C index SNR χ 2 deg deg arcsec a rcse c p c GLL J121752+472613 184.46 96 47.4370 0.88 0.72 0.90 0.43 5.27 +3 .97 − 4 .13 KINGn 11.4 33.60 0.24 GLL J121811+471220 184.54 94 47.2056 0.84 0.72 0.79 0.46 < 2.2 K INGn 289.2 168.20 2.83 GLL J121820+470541 184.58 67 47.0948 0.05 0.62 0.99 0.39 1.35 +4 .80 − 1 .32 KINGn 0.0 337.30 0.67 GLL J121825+472438 184.60 45 47.4107 0.92 0.72 0.80 0.49 < 2.2 K INGn 635.0 142.20 2.84 GLL J121835+472452 184.64 79 47.4146 1.20 0.76 0.62 0.50 2.31 +0 .41 − 1 .70 KINGn 86.2 191.90 6.50 GLL J121835+472346 184.64 97 47.3963 0.82 0.71 0.56 0.44 2.64 +0 .19 − 0 .20 KINGx 30.0 46.90 0.37 GLL J121838+472549 184.65 93 47.4305 0.78 0.72 0.95 0.44 2.78 +0 .24 − 0 .13 KINGx 30.0 51.80 0.47 GLL J121840+472251 184.66 68 47.3809 0.77 0.73 0.98 0.42 5.24 +1 .81 − 4 .34 KINGn 12.0 28.80 0.27 GLL J121840+471106 184.6677 47.1852 0.88 0 .7 0 0.82 0.47 < 2.2 K INGn 720.9 63.50 0.56 GLL J121841+471931 184.6715 47.3255 0.90 0 .7 2 0.62 0.59 < 2.2 KINGx 100.0 81.20 1.06 Note —T able 7 is published in its en tiret y in the mac hine-readable format. A p ortion is sho wn here for guidance regarding its form and con ten t.
this direction are Au = 0.037, Ai = 0.015 and AK = 0.003 (Schlafly & Finkbeiner 2011). All final
mosaics are available in the CFHT archive,12 and have a pixel scale of 0.00186. The exposure times of
the EGS D3 CFHTLS mosaics at u∗, i0, and Ks are, respectively, 19800 s, 64440 s, and 17500 s.
We remind the reader that all our analysis is limited by the Ks-band image of NGC 4258, given
its FOV and shallowness. Figure 11 presents the comparison between the shape parameters of the
objects in the u∗i0Ks diagrams of NGC 4258 and the Groth Strip, respectively. To produce this
diagram, we only include sources in an area of the EGS equal to the effective FOV of the Ks-band
mosaic of NGC 4258 (612.1 arcmin2, excluding unexposed borders), that are brighter at K
s than the
limiting magnitude of the spiral galaxy data (21.7 mag). The selection region in the u∗i0Ks
color-color diagram is highlighted with the gray contour. The scarcity of unresolved (blue) and marginally resolved (cyan) sources within the contour in the EGS is remarkable. If we only used one parameter at a time, FLUX RADIUS and FWHM would classify two –the same– objects as GCCs; CLASS STAR would classify a third one, and SPREAD MODEL would classify yet a fourth, redder one, as a GCC in the EGS field. Hence, the combination of FWHM and SPREAD MODEL that we employed for our selection of GCCs in NGC 4258 likely allowed two contaminants to be classified as GCCs.
We adopt 2 contaminants and hence 37 as our final number of GC candidates. Incidentally, this
estimate of contaminating objects coincides with the results of the very recent work by Powalka et
al.(2016). They have very carefully examined, also using structural parameters, the u∗i0Ks diagram
of spectroscopically confirmed GCs in the M 87 field produced by Mu˜noz et al. (2014); Powalka et
al. concluded, conservatively, that the contamination is at most 5%. Both M 87 and NGC 4258 are
at high Galactic latitudes (respectively, at b = 74.◦5 and b = 68.◦8) and, indeed, the Besan¸con model13
(Robin et al. 2003) predicts 8% fewer stars in the direction of NGC 4258 relative to the M 87 line of
12 http://www.cadc-ccda.hia-iha.nrccnrc.gc.ca/en/cfht/. 13
1.0 1.5 2.0 2.5 3.0 3.5 (u∗−i0) 0 0.4 0.2 0.0 0.2 0.4 0.6 0.8 1.0 1.2 ( i 0− K s )0 0.60 0.64 0.68 0.72 0.76 0.80 0.84 0.88 0.92 FWHM (arcsec) 1.0 1.5 2.0 2.5 3.0 3.5 (u∗−i0) 0 0.4 0.2 0.0 0.2 0.4 0.6 0.8 1.0 1.2 ( i 0− K s )0 0.68 0.72 0.76 0.80 0.84 0.88 0.92 FWHM (arcsec) 1.0 1.5 2.0 2.5 3.0 3.5 (u∗−i0) 0 0.6 0.4 0.2 0.0 0.2 0.4 0.6 0.8 1.0 1.2 ( i 0− K s )0 0.00 0.25 0.50 0.75 1.00 1.25 1.50 1.75 2.00 10 0 × S PR EA D MO DE L 1.0 1.5 2.0 2.5 3.0 3.5 (u∗−i0) 0 0.6 0.4 0.2 0.0 0.2 0.4 0.6 0.8 1.0 1.2 ( i 0− K s )0 0.00 0.25 0.50 0.75 1.00 1.25 1.50 1.75 2.00 10 0 × S PR EA D MO DE L 1.0 1.5 2.0 2.5 3.0 3.5 (u∗−i0) 0 0.4 0.2 0.0 0.2 0.4 0.6 0.8 1.0 1.2 ( i 0− K s )0 0.43 0.45 0.47 0.49 0.51 0.53 0.55
FLUX RADIUS (arcsec)
1.0 1.5 2.0 2.5 3.0 3.5 (u∗−i0) 0 0.4 0.2 0.0 0.2 0.4 0.6 0.8 1.0 1.2 ( i 0− K s )0 0.43 0.45 0.47 0.49 0.51 0.53 0.55
FLUX RADIUS (arcsec)
1.0 1.5 2.0 2.5 3.0 3.5 (u∗−i0) 0 0.4 0.2 0.0 0.2 0.4 0.6 0.8 1.0 1.2 ( i 0− K s )0 0.0 0.1 0.2 0.3 0.4 0.5 0.6 0.7 0.8 0.9 1.0 CLASS STAR 1.0 1.5 2.0 2.5 3.0 3.5 (u∗−i0) 0 0.4 0.2 0.0 0.2 0.4 0.6 0.8 1.0 1.2 ( i 0− K s )0 0.0 0.1 0.2 0.3 0.4 0.5 0.6 0.7 0.8 0.9 1.0 CLASS STAR
Figure 11. NGC 4258 (left column) and Extended Groth Strip (right column). Comparison of struc-tural parameters in the GCC selection region. From top to bottom: FWHM; 100×SPREAD MODEL; FLUX RADIUS; CLASS STAR. The gray contour outlines the GCC selection region. GCCs appear with shades of blue and cyan in all compactness estimators. Since the average FWHM is slightly larger for the strip mosaic than for NGC 4258 (0.0067 vs. 0.0060), we have increased accordingly the lower value of the FWHM range covered by the respective colormap. This way, point sources in the Groth Strip will show approximately with the same color as those in the NGC 4258 field.
sight.
7. PROPERTIES OF THE GC SYSTEM OF NGC 4258
7.1. Color distribution
The distributions of our final sample of GCCs in the colors (u∗ - g0), (u∗ - i0), (g0 - r0), (g0- i0), (r0
-i0), and (g0- Ks) are shown in the top panels of Figure 12. The colors of the individual candidates
have been corrected for foreground extinction in the Milky Way, as mentioned before (Section 5).
The means and dispersions of Gaussian fits to the color distributions, performed with the algorithm
GMM (Muratov & Gnedin 2010), are presented in Table 8.
We now compare the colors of the GCCs of NGC 4258 with those of the globulars of our Galaxy
and M 31. For the Milky Way, we use the compilation by Harris 1996 (2010 edition). This catalog
comprises to date information on 147 objects, but only 82 have photometry on all U BV RI bands, which we need to obtain their colors in the MegaCam system. We first transform the values in
the catalog to the SDSS (AB) system with the equations in Jester et al. (2005) for stars with
Rc − Ic< 1.15, and then to MegaCam u∗g0r0i0z0 magnitudes with the relations given in the MegaPipe
webpage.14 We have dereddened individually each of the 82 MW GCs using the E(B − V ) values
inHarris 1996 (2010 edition), assuming the relative extinctions for the Landolt filter set derived by
Schlegel et al. (1998) from the RV = 3.1 laws of Cardelli et al. (1989, UV and IR), and O’Donnell
(1994, optical).
Our transformation equations are given below, where names without superscripts refer to the SDSS system, and those with superscripts allude to the MegaCam filters:
u − g = 1.28 × [U − B − 3.1 × E(B − V ) × (1.664 − 1.321)] + 1.13 (2) g − r = 1.02 × [B − V − 3.1 × E(B − V ) × (1.321 − 1.020)] − 0.22 (3) g − i = 0.92 × [V − R − 3.1 × E(B − V ) × (0.819 − 0.594)] − 0.20 (4) u∗− g0 = 0.759 × (u − g) + 0.153 × (g − r) (5) u∗− i0 = 0.759 × (u − g) + 1.003 × (r − i) (6) g0 − r0 = 0.871 × (g − r) (7) g0 − i0 = 0.847 × (g − r) + 1.003 × (r − i) (8) r0 − i0 = 1.003 × (r − i) − 0.024 × (g − r). (9)
(u∗ - g0), (u∗ - i0), (g0 - r0), (g0- i0), and (r0- i0) color distributions of the MW globulars are shown
in the middle panels of Figure 12; means and dispersions of Gaussian fits to them are also presented
in Table 8.
In the case of M 31, we take the sample of old clusters with SDSS photometry in Peacock et al.
(2010). There are 289 objects with u, g, r, and i data, as well as 173 GCs that have also been observed
in the K filter with the Wide Field Camera (WFCAM) mounted on the United Kingdom Infrared Telescope (UKIRT). Whereas the optical magnitudes are given in the AB system, the infrared K values are quoted in Vega magnitudes. To transform the optical colors to the MegaCam system, we
use eqs. (6)–(10). For (g0 - Ks), we apply:
g0 − Ks = g − 0.153 × (g − r) − K − 1.834, (10)
where the constant 1.834 is introduced to convert K to the AB system used by WIRwolf (http://www.
(2010) have calibrated their K magnitudes with Two Micron All Sky Survey (2MASS;Skrutskie et al.
2006) Ks-band data, but the two filters are different. The Ksfilter cuts off at 2.3 µm in order to reduce
the contribution from the thermal background; its minimum, maximum, and central wavelengths are,
respectively, λmin = 1.95µm, λmax = 2.36µm, λcen = 2.16µm, vs. λmin = 1.98µm, λmax = 2.47µm,
λcen = 2.23µm for the K filter (http://svo2.cab.inta-csic.es/svo/theory/fps3/).
The color distributions of the M 31 old clusters are shown in the bottom panels of Figure12, and
the parameters of the Gaussian fits are listed in Table 8.
The colors reported in Peacock et al. (2010) have not been corrected for extinction, but we can
estimate the reddening for the whole system as we describe below. Barmby et al. (2000) have
published U BV RI colors derived consistently for more than 400 M 31 clusters. Although these authors do not provide extinction corrections for their individual objects, they do find a global
average reddening E(B − V ) = 0.22. Using again the reddening law tabulations in Schlegel et al.
(1998), we find E(u∗ − g0) = 0.25; E(u∗ − i0) = 0.57; E(g0 − r0) = 0.19; E(g0 − i0) = 0.32; E(g0 − K
s)
= 0.68; E(r0 − i0) = 0.13. Even without considering errors, if we correct the mean MegaCam colors
of the M 31 GC system for these excesses, they are virtually identical to the colors of the MW
system, as can be seen in Table 8. The redder colors of the M 31 can then be fully explained by
extinction, of which about one third would be due to the relatively uncertain foreground of the MW
[E(B − V ) = 0.062; Schlegel et al. 1998], and the rest would be internal to M 31. The colors of the
NGC 4258 system are slightly redder than those of the MW globulars. This small difference could also be partially due to unaccounted for internal extinction in NGC 4258.
Since in the NGC 4258 data we are 100% complete for objects brighter than the GC LFTO, we
also derive colors only for the globulars in the MW and M 31 systems with MV ≤ −7.5 mag; for the
Peacock et al. M 31 sample, we use the transformation for the SDSS filters V = g−0.59×(g −r)−0.01 (Jester et al. 2005), and assume a distance modulus for Andromeda of 24.45 (mean and median from
NED). The colors of these subsets are likewise tabulated in Table 8, and are virtually identical to the colors of the full systems.
This brief analysis shows that, like the GCs of M 31 and our Galaxy, the GCCs in NGC 4258 do not have a bimodal color distribution, and that the colors of the three systems are remarkably consistent, once extinction has been taken into account.
7.2. Luminosity function
The Ks-band luminosity function for the final sample of 39 GCCs is shown in Figure 13. The
histogram includes the corrections for incompleteness derived for the four different elliptical/annular
regions considered in Section 4and listed in Table 3. With these corrections, the number of sources
increases to 40. The solid red line is a Gaussian fit to the histogram, with mean µ at the turnover
magnitude m0
TO = 21.3, and σ = 1.2 mag. Extrapolating over the GCLF yields 65 objects.
We would like to stress here that we do not use the extrapolation over the luminosity function to derive the total number of globular clusters in the system. We perform the completeness and GCLF corrections implicitly, as we explain in the next section.
8. TOTAL NUMBER OF GLOBULAR CLUSTERS
8.1. Correction for incomplete spatial coverage
Usually, mostly in elliptical galaxies, the total number of globular clusters is derived from the observed sources by (1) applying the completeness correction, (2) extrapolating over the LF to account for clusters below the detection limit, and (3) accounting for incomplete spatial coverage, both due to the image FOV and to occultation/obscuration by the galaxy itself. In particular, in the case of NGC 4258, not being an edge-on spiral, it is essential to estimate the number of clusters that
are lost to crowding in the brightest regions of the bulge and arms (see Section 4). Both the small
T able 8 . P arameters of Gaussian Fits to Color Distrib utions ( u ∗ − g 0 ) ( u ∗ − g 0 ) 0 ( u ∗ − i0 ) ( u ∗ − i0 ) 0 ( g 0 − r 0 ) ( g 0 − r 0 ) 0 ( g 0 − i0 ) ( g 0 − i0 ) 0 ( g 0 − K a s ) ( g 0 − K a s ) 0 ( r 0 − i0 ) ( r 0 − i0 ) 0 µ σ µ σ µ σ µ σ µ σ µ σ µ σ µ σ µ σ µ σ µ σ µ σ 4258 1.10 0.13 1.86 0.34 0.49 0. 06 0. 72 0.09 0.76 0.24 0.23 0.04 W a y 1.03 0.15 1.67 0.25 0.45 0.09 0.64 0.11 0.19 0.03 W a y M V < − 7 .5 1.02 0.15 1.65 0.25 0.45 0.09 0.64 0.11 0.18 0.03 1.30 0.26 1. 05 2.29 0.53 1.72 0.64 0.17 0.45 1.00 0.28 0.68 1.24 0.61 0.56 0.36 0.12 0.23 M V < − 7 .5 1. 30 0.26 2.29 0.52 0.64 0.17 1.00 0.28 1.23 0.59 0.36 0.11 or M 31, near-IR filter is actually K , although calibrated with the K s-band data of the 2M ASS sur v ey . Colors of MW clusters are extinction-colors of ob jects in NGC 4258 are corrected for foreground Galactic extinction. F or old clusters in M 31, w e giv e uncorrected colors, colors corrected b y th e a v erage of b oth foreground extinction in the MW and re d dening in ternal to M 31.
Figure 12 . Color distributions of GC systems. T op: NGC 4258 GCCs (this w ork); midd le: MW globulars ( Harris 1996 2010 editi on ); bottom: M 31 old clusters ( P eaco ck et al. 2010 ). F rom left to righ t: (u ∗ − g 0 ), (u ∗ − i 0 ), (g 0 − r 0 ), (g 0 − Ks ), (r 0 − i 0 ). F or M 31, near-IR fil te r is actually K , although c ali brated with the Ks -band data of the 2MASS surv ey .
16 17 18 19
20
21 22 23 24
Ks
[
mag
]
0
5
10
15
20
N
Figure 13. Ks-band luminosity function of the GCCs in NGC 4258. Histogram: numbers of detected
objects, corrected for incompleteness using parameters derived for concentric regions (see Section4). Thin bars: individual object Ks magnitudes. Cyan arrow: Ks TO (21.3 mag); olive arrow: 21.58 mag, for which
completeness is 50%. Solid red line: Gaussian GCLF derived from fit to the corrected histogram.
to confusion prevent us from deriving this last correction from the fit to the radial distribution of GCCs customarily performed in elliptical galaxies.
Conversely, we adapt the procedure introduced byKissler-Patig et al.(1999), based on a comparison
with the GC system of the MW. With this method, the correction for incomplete spatial coverage
et al. (1999) andGoudfrooij et al. (2003) have discussed in detail the assumptions involved and their implications, as well as how the results are consistent with those from a fit to the radial number density, when both can be applied to the same object.
Summarizing, one estimates the number of GCs that one would detect if the MW were at the distance and orientation of the galaxy of interest, and were observed with the same instrument and to the same depth. The total number of globular clusters would then be:
NGC= NGC(MilkyWay)
Nobs
NFOV
. (11)
NGC(Milky Way) is the total number of clusters in the MW, including objects invisible to us behind
the bulge; Nobs is the number of clusters observed in the target galaxy, in our case 37 after correcting
for contamination, and NFOV is the number of objects recovered in the artificial observation of the
MW. We take NGC (Milky Way) = 160±10 (Harris et al. 2014).
In order to estimate NFOV we use, again, the catalog by Harris 1996 (2010 edition); it provides
X, Y, Z coordinates for 144 MW GCs. This coordinate system’s origin is at the position of the Sun; the X axis points towards the Galactic center, the Y axis in the direction of Galactic rotation, Z
is perpendicular to the Galactic plane. We define a new coordinate system X0Y Z with origin in
the Galactic center, assuming a Galactocentric distance for the Sun R0 = 8.34 kpc (Reid et al.
2014). The main difference with previous applications (e.g., Kissler-Patig et al. 1999; Goudfrooij et
al. 2003) is that NGC 4258 is not edge-on. Hence, we have to first rotate the MW GC system in
3-D 67◦ with respect to the X0 or Y axes, then project it on the plane of the sky; the rotated pairs
(Xrot,X0 0, Yrot,X0), (X0
rot,Y, Yrot,Y), where the subscript indicates the Galactic axis of 3-D rotation, are
directly the projected coordinates. The easiest way to place the projected system on the WIRCam
ellipse centered on the galaxy, with semi-major axis = 3.05, or 0.37 R25, axis ratio = cos(67◦), and
the same P.A. of = 150◦ (default mask). This is the area most affected by confusion (see Section 4
and Figure 3, leftmost panel). As for the limiting magnitude, we set V = 22.4 mag, combining the
magnitude limit at Ks with the difference between the Ks and V bands TO magnitudes; we first
correct the V mag of each cluster for the Galactic extinction given in the Harris 1996 (2010 edition)
catalog, and afterwards apply the foreground Galactic reddening in the direction of NGC 4258. There are four possible orientations of the FOV and mask that preserve the alignment of the galaxy;
they can be seen as mirror reflections of the projected coordinates (+Xproj, +Yproj;+Xproj, −Yproj;
−Xproj, +Yproj; −Xproj, −Yproj, with two sets of four pairs each for rotation around the Galactic X0
and Y axes, respectively). We show in Figure 14the results of the artificial observations of the MW
for the rotation around the X0 and Y axes, respectively, and +Xproj, +Yproj; angular distances in
arcsec are measured relative to the center of the galaxy, with the horizontal axis increasing in the direction of decreasing RA. The ellipses delineated with the black solid line mark the outer edge of the default mask; the red crosses are clusters visible in the WIRCam FOV, whilst sources represented by black crosses have been masked out.
For the 4 realizations rotating around the X0 axis we detect, respectively, 38 (+Xproj, +Yproj), 36
(+Xproj, −Yproj), 36 (−Xproj, +Yproj), and 36 (−Xproj, −Yproj) sources; for rotating around the Y axis,
the numbers are 45, 46, 45, 46. We repeated the exercise with a slightly different mask for the most
crowded area, i.e., an ellipse with a center displaced horizontally from the center of the galaxy 6.0045 to
the east, semi-major axis = 3.04 , axis ratio = cos(64.◦5), P.A. = 153◦ (alternative mask); the difference
was one globular cluster less detected, on average. Changing the P.A. by ±2◦ or the inclination angle
to the line of sight, also by ±2◦, had no effect.
With the numbers from the default mask, there would be 41±5 simulated MW clusters visible in
Figure 14. MW GC system, at the distance and orientation of NGC 4258. Left: 3-D rotation about Galactic X0 axis before projection on the plane of the sky. Right: 3-D rotation about Galactic Y axis. Solid black line: default mask; red crosses: sources visible in the WIRCam FOV; black crosses: masked-out GCs.
includes errors in the assumed number of total GCs in the MW, Poisson errors in the observed number of GCCs in NGC 4258, and Poisson errors in the number of simulated clusters in the WIRCam FOV. To this error, we add potential systematics. Errors in the distance to the galaxy result in uncertain-ties in the detection limiting magnitude, and in the effective areas of the galaxy covered by the FOV and excluded by the mask. For the given, rather small, uncertainties in the distance to NGC 4258 (±
0.23 Mpc, if we add in quadrature the random and systematic errors), NGC would vary by +12/-3.
Another important concern is the difference in the number of obscured clusters between the MW and NGC 4258, particularly relevant, once again, because the latter is not edge-on.
Albeit with small number statistics, we performed the following experiment to try to assess the effect of dust in the galactic disk on the detection of GC candidates. We have inspected the optical images of NGC 4258 and confirmed, by the sheer numbers of background galaxies seen behind the
disk beyond R25, that it is quite transparent there. If the effects of dust (or crowding, for that