HAL Id: hal-01061626
https://hal.archives-ouvertes.fr/hal-01061626
Submitted on 8 Sep 2014HAL is a multi-disciplinary open access
archive for the deposit and dissemination of sci-entific research documents, whether they are pub-lished or not. The documents may come from teaching and research institutions in France or abroad, or from public or private research centers.
L’archive ouverte pluridisciplinaire HAL, est destinée au dépôt et à la diffusion de documents scientifiques de niveau recherche, publiés ou non, émanant des établissements d’enseignement et de recherche français ou étrangers, des laboratoires publics ou privés.
based on image segmentation accuracy metrics
V. Laurent, N. Saint Geours, Jean-Stéphane Bailly, J.-P. Chery
To cite this version:
V. Laurent, N. Saint Geours, Jean-Stéphane Bailly, J.-P. Chery. Simulating geometric uncertain-ties of impervious areas based on image segmentation accuracy metrics. GEOBIA 2014, May 2014, Thessaloniki, Greece. p. 37 - p. 40. �hal-01061626�
Simulating
geometric uncertainties of impervious areas based on
image
segmentation accuracy metrics
Valérie Laurenta,*, Nathalie Saint‐Geoursb, Jean‐Stéphane Baillyc,d, Jean‐Pierre Chéryd
a Post‐Doc, Irstea, UMR TETIS, France, b Researcher, Irstea, UMR TETIS, France, c Researcher, AgroParisTech, UMR LISAH, France, d Researcher, AgroParisTech, UMR TETIS, France *Corresponding author: [email protected], +33467558615, +33467548700 Abstract: Urban sprawl monitoring is important for developing land management policies at various spatial scales. Segmentation and classification of satellite images allows obtaining polygons of impervious areas regularly over large areas, e.g. as has been implemented for the region Languedoc‐Roussillon in the south of France using 5 m RapidEye images. Starting from the results of this previous study, we aim to: i) evaluate the geometric and thematic accuracy of the impervious polygons (S) using segmentation accuracy metrics, and ii) use these metrics to simulate polygons having the same level of uncertainty. A manual segmentation (M) was used to evaluate the accuracy. After matching the polygons, the distance (d) and azimuth (a) of each vertex of M to the closest segment of the boundary of S was calculated. Spherically correlated random fields of d and a were used to randomly move the vertices of S. Realistic simulations of impervious polygons were obtained. Keywords: Spatial Data Analysis, Remote Sensing, Geometry, Human Settlement 1. Introduction Since the 1950s, urban sprawl has dramatically increased, and the new urban areas are most often established on fertile agricultural fields, thus competing with food production. To support the elaboration of sustainable urbanization policies, numerous indicators integrating information about impervious areas, population census, socio‐economical context, agricultural activities, or soil quality have been proposed (Balestrat, 2011). These indicators may be computed and mapped at different spatial scales and administrative levels ‐ from municipality to region. However, they suffer from uncertainties, which mainly arise from the quality of the input data. Among these sources of uncertainty, we focus here on the geometric and thematic uncertainties in the map of impervious areas derived from satellite imagery. In this paper, we present how these uncertainties can be modelled and then be used for simulating impervious polygons. The simulation will later be used in a Monte Carlo set‐up for evaluating the uncertainties of urban sprawl indicators.
2. Materials and methods 2.1. Study area and data
Roujan is a rural municipality of about 2,000 inhabitants, covering an area of 16.93 km2, located in the south of France. Multispectral RapidEye data with 5 m spatial resolution was acquired on June 26th, 2009. The image was received as a 25 km ortho‐rectified tile (level
and classified using eCognition. Road polygons, built using the French vector database BD CARTO®, were used as ancillary data in the segmentation. Finally, a manual post‐ classification step allowed reducing the confusions between impervious areas and other objects, in particular bare soils. Another dataset of impervious polygons (M) was manually digitized on the RapidEye tile to evaluate the uncertainties in S. The digitalization scale was set to 1/8,000. The minimum mapping unit was set to 125 m2 (5 pixels). The roads were not digitized and were therefore excluded from S, using morphological closure. Only road portions included in the village centre polygon were retained.
2.2. Evaluation of uncertainties
Because there are only two classes (impervious and non‐impervious areas), thematic and geometric uncertainties are equivalent and can be evaluated at the same time. The confusion matrix or the Cohen‐Kappa coefficient in terms of correct, omitted and committed areas gives first information about the overall labelling uncertainties. The location and shape of the polygons, however, is also of importance because the calculation of the indicators of urban sprawl involves a morphological operation. We therefore used a modified version of the boundary distance distribution signature (BDDS) of Huang and Dom (1995) to evaluate the dissimilarity of M from S. The polygons in S and M having more than 50 % overlap are matched. Then, the Euclidian distance (d) of each vertex of M (PM) to the closest point (PS) of
the boundary of the matched polygon in S (vertex or on a segment) was calculated. The distribution of these distances constitutes the BDDS. The azimuths of the PMPS segments (a)
were also collected in a boundary azimuth distribution signature (BADS). The spatial correlation of the uncertainties was evaluated by calculating the semi‐variances of d and a, and fitting semi‐variogram models.
2.3. Simulation of impervious polygons
Based on the fitted semi‐variogram models, spatially correlated Gaussian random fields at 50 m resolution were simulated, using the measured BDDS for d, and a uniform distribution over [0; 2π[ for a. Each vertex of S was then moved according to the distance and azimuth found in the random field, thus creating a simulated polygon. A buffer with zero distance was then applied to correct the topology of the simulated polygon. Finally, a dissolve operation was used to merge (partly) overlapping simulated polygons.
3. Results and discussion 3.1. Uncertainties
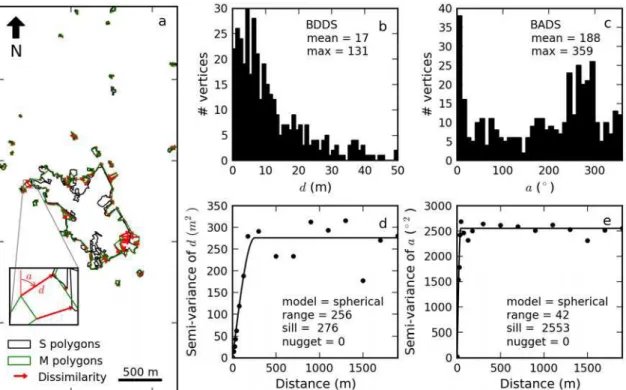
The impervious area correctly segmented was 0.54 km2, which represents 88% of M, and 66% of S. Figure 1a shows the dissimilarity between S and M, in terms of distance and azimuth. The dissimilarity is small for most vertices, and seems to be spatially correlated. This is confirmed by the BDDS plot (Fig. 1b), which has higher frequencies at small distances, similar to a Poisson distribution, and by the distance semi‐variogram (Fig. 1d), which has a range of 256 m. As expected, the azimuth seems to follow a uniform distribution (Fig. 1c), but is less spatially correlated than the distance, with a semi‐variogram range of 42 m (Fig. 1e).
Figure 1. Comparison of S and M polygons (a), BDDS (b), BADS (c), distance (d) and azimuth (e) semi‐ variograms. Number of vertices in M = 403. Number of point pairs for semi‐variance calculation = 139,203. 3.2. Simulations
Figure 2 shows a few examples of simulated impervious polygons. The simulations look realistic. Most of the polygons’ boundaries were slightly displaced, in accordance with the
high frequency of small distances in the BDDS. The spatial correlation of high distance values creates either omitted or committed areas, depending on the azimuth value, relative to the vertices’ position around the polygon. 3.3. Limitations The spatially correlated random fields of a and d are currently simulated at 50 m resolution, which is much too low, especially for a, whose range is only 42 m. We are currently working on implementing the random field simulations at 5 m resolution, similar to the resolution of the RapidEye images. The topological correction of the simulation disturbs the simulation of
d and a values, but is however very important for further processing of the simulated
impervious polygons for producing the urban sprawl indicator maps. The current simulation algorithm only simulates the exterior ring of the polygons and does not account for the interior rings present in S. Further work will also include the simulation of omitted and committed polygons to match the correct area value observed between M and S. The uncertainty evaluation scheme will evolve depending on the information required to simulate these additional effects in the impervious polygons.
4. Conclusions
The algorithm principle presented here allows simulating the exterior boundary of segmented impervious polygons with realistic level of uncertainty. It will be improved to include the simulation of interior boundaries and omitted / committed polygons. The final algorithm will be used in a Monte Carlo set‐up to propagate the uncertainties to the urban sprawl indicator maps. An uncertainty map will then be produced for each indicator, which will be useful information for the local governments. 5. Acknowledgements
This work was funded by GEOSUD, a project (ANR‐10‐EQPX‐20) of the program “Investissements d'Avenir” managed by the French National Research Agency.
References
Balestrat M., 2011, Système d'indicateurs spatialisés pour la gouvernance territoriale: Application à l'occupation des sols en zone périurbaine languedocienne, Geography (p. 402). Montpellier: Université Paul Valéry ‐ Montpellier III.
Dupuy S., Barbe E., Balestrat M., 2012, An Object‐Based Image Analysis Method for Monitoring Land Conversion by Artificial Sprawl Use of RapidEye and IRS Data. Remote Sensing, Volume 4: 404‐423.
Huang Q., Dom B., 1995, Quantitative methods of evaluating image segmentation. Proceedings IEEE International Conference on Image Processing, Washington D.C., USA, pp. 53‐56.