Marta Wujczyk, Adam Watras, Philippe Boutinaud, Marco Bettinelli, Sara Targonska, Jorma Hölsä,
and Rafal J. Wiglusz
*
Cite This:J. Phys. Chem. C 2020, 124, 17364−17371 Read Online
ACCESS
Metrics & More Article Recommendations*
sı Supporting InformationABSTRACT: The paper discusses the origin of emission quenching and the formation of metal-to-metal charge-transfer states in yttrium orthovanadate-arsenates doped with Tb3+ ions. For that purpose, a series of highly crystalline yttrium orthovanadate-arsenate nanoparticles (type YVxAs1−xO4,
where x = 2−65 mol %) doped with Tb3+ions were prepared using the co-precipitation method. The structural and morphological properties of the particles were studied by means of X-ray powder diffraction (XRD), transmission electron microscopy (TEM), and scanning electron micros-copy (SEM) techniques. The photoluminescence spectral and dynamical properties of YVxAs1−xO4doped with 1 mol % Tb3+ions were investigated
in detail. It was found that the emission quenching is related to changes in
the band gap and Tb3+-to-V5+metal-to-metal charge transfer. Further, the Tb3+-to-As5+metal-to-metal charge transfer was identified
and rationalized based on different models.
1. INTRODUCTION
A large number of research groups are looking for novel, nanosized, stable chemically and mechanically stable materials with attractive and distinct spectroscopic properties.1−4One of the materials that have brought an immense interest is YVO4.
The interest is rightful due to the fact that doping with rare-earth ions like Eu3+or Nd3+, and/or additionally codoped with s2-type cations like Bi3+, has a number of potential applications, such as
sensors,5 fluorescent labels,6 display devices,7 laser materi-als,8−11and bioprobes.12,13However, it is known for long that doping with Tb3+ does not generate any luminescence in YVO4.
14,15
This phenomenon is ascribed to the formation of a low-lying Tb3+-to-V5+metal-to-metal charge transfer (MMCT)
state that efficiently quenches the otherwise brightly emitting
5D
4level. Some 15 years ago, the Tb3+:Y(P,V)O4solid solution
was investigated to determine the reason for the total inactivity of Tb3+ions in YVO
4. It was concluded that the intensity of Tb3+
ion emission is proportional to the probability that none of the four metal ion sites of Tb3+ion is occupied by V5+ion.16Similar work has been carried out more recently in sol−gel nanosized Tb3+:Y(P,V)O4solid solution and also concluded on the Tb3+
ion emission quenching mediated by a low-lying Tb-V CT state.17As discussed in earlier studies, the MMCT process is ascribed as an excitation from the ground state of Tb3+ion to the
bottom of the conduction band of the host, which allows locating the7F0(4f8) ground state of Tb3+ion relative to the host
fundamental states.18,19In YVO4, the bottom of the conduction
band consists majorly of V(3d) orbitals20−22 and features a relatively narrow band gap of 3.8 eV,23whereas in YPO4, the
band gap is much larger, up to 9.2 eV,24 and the P orbitals contribute very little to the bottom of the conduction band that has a strong Y(4d) character.20,22It comes that the Tb3+-to-P5+
or Tb3+-to-Y3+CT, if occurring, has high energy relative to Tb→ V CT.
In the present work, we investigate the emission behavior of Tb3+ion in the nanosized solid solution Y(As,V)O
4, where As5+
ion plays a role similar to that of P5+ion in terms of dilution of
the V5+ion within the crystal lattice. The essential difference with the previous report of DeLosh et al.16is the 3d10electron configuration of As5+ion that allows 4s orbitals to participate in
the bottom of the lattice conduction band in the mixture with the Y(4d) orbitals25with a corresponding band gap of 4.5 eV.26 This potentially permits Tb3+(4f8)-to-As5+(4s0) CT to occur in
the near-UV spectral region, although somehow higher relative to YVO4, and related vanadium-rich compounds to avoid
quenching of Tb3+ion emission. In this regard, the maximum concentration of V5+ ions that quenches the luminescence of
Tb3+ions in YV
xAs1−xO4solid solution is determined to be 65
mol % and the occurrence of Tb-As MMCT is evaluated by adapting a model previously established for the Pr3+-to-d0 transition-metal CT.18
Received: May 24, 2020
Revised: July 2, 2020
Published: July 10, 2020
Downloaded via 118.70.52.165 on June 24, 2021 at 09:18:17 (UTC).
2. MATERIALS AND METHODS
2.1. Synthesis Route. Nanosized yttrium orthovanadate-arsenate doped with terbium ions were prepared by wet chemical synthesis via co-precipitation method. The concen-tration of the optically active ions was set to be 1 mol % Tb3+for
each material, with respect to the appropriate Y3+molar content. The V5+ions concentration was changed from 2 to 65 mol %
with respect to the appropriate As5+molar content. Analytical
grade Y2O3(99.99% Alfa Aesar), Tb7O11(99.99% Alfa Aesar),
As2O3 (99.5% Sigma-Aldrich), and NH4VO3 (99.5%
Sigma-Aldrich) were used as the starting materials.
In this method, stoichiometric amounts of the Y2O3 and Tb7O11were digested in excess of dilute HNO3to transform
them into nitrate salts. The obtained lanthanide nitrates were recrystallized three times to get rid of the excess HNO3.
Ammonium metavanadate was dissolved in deionized water. The arsenic oxide was transformed to arsenic acid with an excess amount of ultrapure HNO3. Next, H3AsO4 and NH4VO3 solutions were mixed and the mixture was added to nitrate salts solution (Y(NO3)3 and Tb(NO3)3). The reaction was
maintained at a stirring plate for 1.5 h at approximately 100°C. The pH of the suspension was adjusted to 8 with aqueous ammonia. The obtained precipitate was washed and centrifuged at least thrice to reach the pH value. The as-prepared materials were dried for 24 h at 70°C and heated at 800 °C for 3 h to form crystallized nanoparticles.
2.2. XRD, SEM, and TEM Analyses. The development of the crystal phase was checked by X-ray diffraction (XRD). The patterns were collected in the 2θ range of 5−120° with an X’Pert PRO X-ray diffractometer (Cu Kα1, 1.54060 Å) (PANalytical). The XRD patterns were assigned using the Joint Committee on Powder Diffraction Standards Database (JCPDS) and Inorganic Crystal Structure Database (ICSD) and then analyzed. Analysis of the morphology, dispersibility, and size of the materials was performed using the scanning electron microscope (SEM) FEI Nova NanoSEM 230 equipped with an energy-dispersive system (EDS) spectrometer (EDAX PegasusXM4) as well as the high-resolution transmission electron microscopy (HR-TEM) on a Philips CM-20 Super Twin microscope.
2.3. Spectroscopic Analysis. Infrared spectra were measured by a Thermo Scientific Nicolet iS50 FT-IR spectrometer equipped with an Automated Beam splitter exchange system (iS50 ABX containing DLaTGSKBr detector), built-in all-reflective diamond ATR module (iS50 ATR), Thermo Scientific Polaris and HeNe laser was used as an IR radiation source. The infrared spectra were recorded in KBr pellets at a 4000−400 cm−1range with a spectral resolution of 2 cm−1 at room temperature. The obtained infrared spectra
(Figure S1) are featured in the Supporting Information.
Emission spectra were recorded upon excitation at 380 nm using a tunable Ti/sapphire laser pumped with the second harmonic of the YAG:Nd3+pulse laser ( f = 10 Hz, t < 10 ns). A
long pass Schott filter (420 nm) was used. The Hamamatsu PMA-12 photonic multichannel analyzer was used as an optical detector. All measurements were performed with the fixed parameters such as the exposure time (200 ms) and the cumulative amount of measurements (20),finally resulting in an averaged emission spectrum. The excitation spectra were collected at room temperature using an FLS980 Fluorescence Spectrometer from Edinburgh Instruments equipped with a 450 W xenon lamp and a Hamamatsu R928P photomultiplier. The emission decay profiles corresponding to the 5D
4 → 7F5
transition of Tb3+at 548 nm were recorded at room temperature upon 380 nm excitation using a Tektronix MDO3052 digital oscilloscope.
3. RESULTS AND DISCUSSION
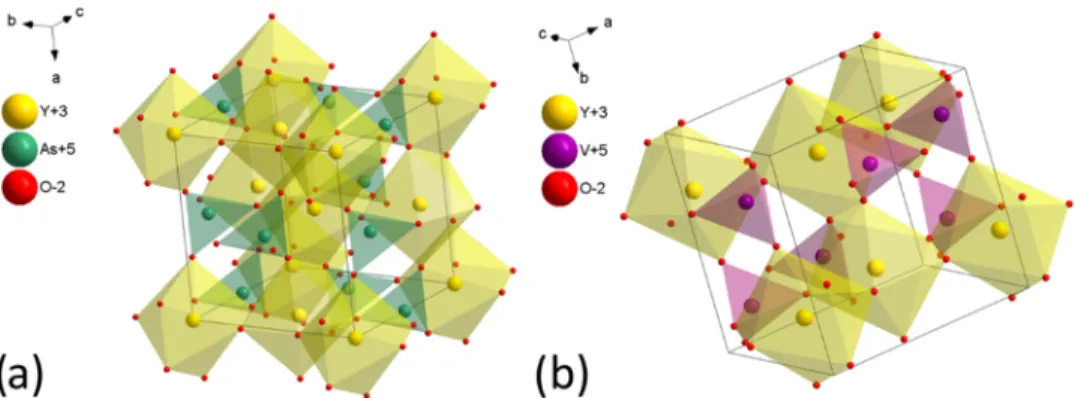
3.1. Structure and Morphology. The crystal structure of YXO4(where X = As, V) is tetragonal, ascribed to space group
I41/amd (no. 141), and offers only one yttrium cationic site for the possible substitution with rare-earth ions (seeFigure 1). The parameters that characterize unit cells of the compounds are as follows (seeTable 1).
Moreover, the mixed YVxAs1−xO4system doped with Tb3+
ions should be in accordance with Vegard’s law as a solid solution. A similar situation was observed in the case of YVxP1−xO4and Eu3+:YV
xP1−xO4that was obtained via the
co-precipitation method.29,30
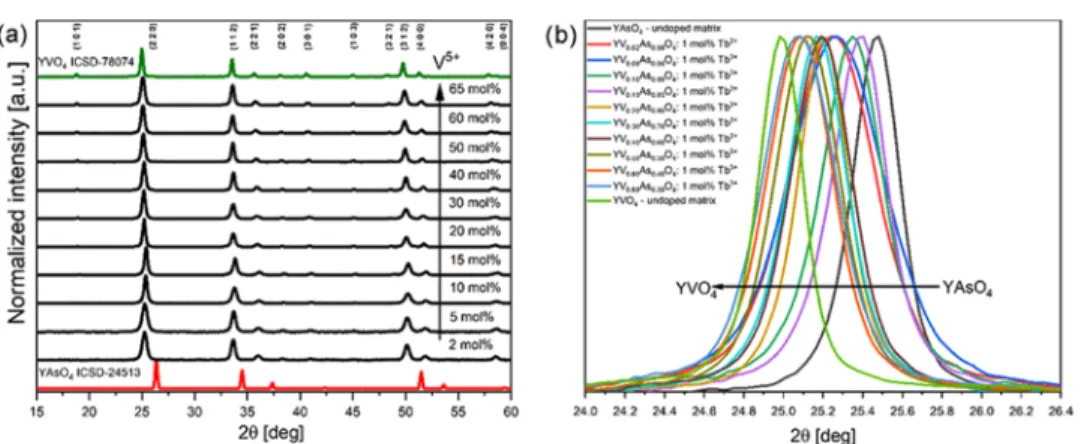
The formation of crystalline undoped and 1 mol % Tb3+
-doped YVxAs1−xO4 nanomaterials was followed by XRD
Figure 1.Three-dimensional (3D) view of the unit cell representation of (a) YAsO4and (b) YVO4.
Table 1. Crystallographic Data for Yttrium Orthovanadate and Yttrium Orthoarsenate27,28
YVO4 YAsO4
cryst. syst. zircon tetragonal zircon tetragonal space group I41/amd (no. 141) I41/amd (no. 141)
a (Å) 7.1183(1) 6.9040(1) b (Å) 7.1183(1) 6.9040(1) c (Å) 6.2893(1) 6.2820(1) α (deg) 90 90 β (deg) 90 90 γ (deg) 90 90 point-group symmetry D4h D4h
measurements (seeFigures S2and2, respectively). All samples prepared by utilizing wet chemistry techniques showed detectable crystallinity and purity at all ranges and proposed sintering temperature at 800°C. Moreover, a continuous shift of the (220) plane toward lower 2θ angles was observed as an effect of the cell parameters change induced by the substitution of the bigger V5+(0.355 Å at CN 4) cation by smaller one As5+(0.335
Å) (seeFigure 2b), respectively.
TEM images of the representative 1 mol % Tb3+:YV
0.5As0.5O4
sample are shown inFigure 3. After 3 h at 800°C, we observe that elongated particles formflat plates with an average size in the range of 20−40 nm (Figure 4). These observations are in line with earlier data reported for the nanosized YVO4or YAsO4
systems.31,32
3.2. Spectroscopic Properties. The emission spectra of the 1 mol % Tb3+:YV
xAs1−xO4(x = 0.02−0.65) are shown in
Figure 5. The visible lines are ascribed to the characteristic 4f−4f transitions of Tb3+ ions.33−35 The intensity of these lines
increases sharply up to x = 0.05 and then gradually decreases for larger values of x, i.e., with an increase of the probability that Tb3+ionfinds V5+ion in its immediate neighborhood to form
the Tb-V MMCT state. Total quenching is observed for x = 0.65 at room temperature. This, in fact, motivated us to interrupt the solid solution at this content.
This compositional dependence of the emission intensity is well confirmed by the analysis of the temporal decay of the
5D
4-7F5emission of Tb3+in the solid solution. The compounds
were excited at 380 nm in correspondence with the7F 0−5L6
intraionic transition of Tb3+ions (Figure 6). The decays present
Figure 2.XRDP patterns of YVxAs1−xO4doped with 1 mol % Tb3+ions and heat-treated at 800°C for 3 h in air (a). Dependence of the lattice plane
(220) shift upon V5+/As5+ratio in YV
xAs1−xO4doped with terbium ions (b).
Figure 3.Size and morphology representation by SEM image (a) and TEM images (b, c) of 1 mol % Tb3+:YV
0.5As0.5O4sample thermally treated at 800
°C.
Figure 4.Particle size distribution designated by TEM images.
Figure 5.Emission spectra (λexc= 380 nm) obtained for 1 mol %
Tb3+:YV
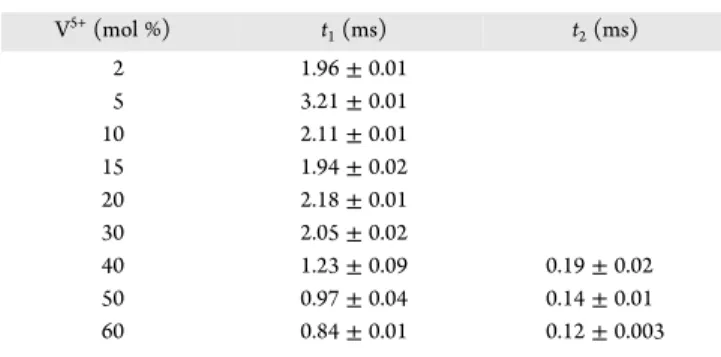
a single-exponential nature for materials with a concentration of V5+up to 40 mol % and a double-exponential nature above 40 mol % V5+ions. The emergence of the double-exponential decay
profile is directly correlated with a high content of V5+ions in the matrices. It could be explained through the crystal structure non-uniformity related to two separate phases of the YVO4 and
YAsO4in the crystal structure. Minakova et al. have shown that the peak related to the (220) plane was split. In this case, there could be indicated the existence of another crystal phase in the YVxAs1−xO4matrix.
36
Therefore, an emergence of the double-exponential decay profile could be seen, when such a phenomenon occurs. The short time component can be associated with the Tb3+:YV
xAs1−xO4 phase in which Tb3+
ions are nearby V5+ ions as well as As5+ ions. On the other hand, the longtime component may come from the Tb3+:YAsO
4
phase in which Tb3+ions are directly coordinated by As5+ions. All values get the millisecond components of the time interval reproduced inFigure 5. The values were obtained byfitting the decay profiles with exponential functions in Origin software (Table 2). Decay profiles of the materials containing up to 30 mol % V5+werefitted with the single-exponential function
= + − −
y y0 A e1 (x x0)/t1
(1)
And decay profiles of the materials containing above 40 mol % V5+werefitted with the double-exponential function
= + − − + − −
y y0 A1e (x x0)/t1 A2e (x x0)/t2
(2)
where y0is the offset; x0is the center; A1, A2are the amplitudes; and t1, t2are time constant and coefficient of determination (R2)
at 0.94−0.99. Hence, with an increment of V5+ ion
concentration, a shortening of the decay time is observed.
Decay times characterize themselves with rises prominent for each sample except that containing 5 mol % V5+ions (Figure
S3). The longest rise is observed for the sample containing 2 mol % V5+ions. The presence of the rises may be explained on the
basis of the5D4term population by the nonradiative transition’s
occurring from the5D
3term, which is directly populated by the
absorption of the excitation energy (λexc= 380 nm) (Figure S3).
Additionally, based on the lifetime profiles, a quenching rate of the Tb3+emission by V5+was calculated. The quenching rate kq
can be calculated using the following formula
τ τ
= −
kq 1 1
q 0 (3)
whereτqis the decay time with quenching andτ0is the decay time without quenching. Using values for 5 and 60% samples (τ0
= 3.21 ms andτq= 0.84 ms, respectively), quenching rate stands at kq= 879.
Figure 6.Decay time profiles of 1 mol % Tb3+:YV
xAs1−xO4measured for the5D4→7F5transition monitored at 548 nm and pumped with 380 nm
wavelength of the pulse laser.
Table 2. Decay Time Dependent on Vanadium Ion Concentration in the 1 mol % Tb3+:YV
xAs1−xO4System V5+(mol %) t 1(ms) t2(ms) 2 1.96± 0.01 5 3.21± 0.01 10 2.11± 0.01 15 1.94± 0.02 20 2.18± 0.01 30 2.05± 0.02 40 1.23± 0.09 0.19± 0.02 50 0.97± 0.04 0.14± 0.01 60 0.84± 0.01 0.12± 0.003
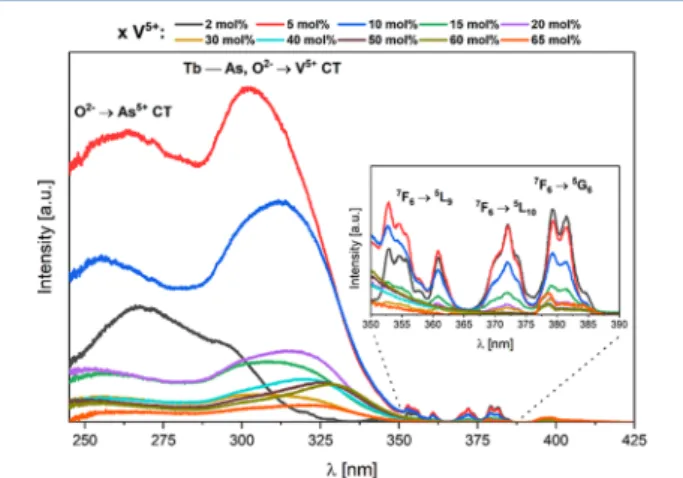
solid solution. They show the weak 4f−4f transitions of Tb3+ ions in the near-UV spectral region and intense transitions with f−d and/or charge transfer character below 350 nm.
The origin of these excitation signals depends on the considered member of the solid solution. As we know since the work of DeLosh et al., thefirst critical issue is the probability for the Tb3+ ions to find the V5+ acceptors in its immediate neighborhood in the YVxAs1−xO4solid solution. In the zircon
crystal structure, this probability is P(x) = 1−(1−x)2. Values are given inTable 3together with the energy position of the lowest
excitation band in the compounds. The energy of the lowest excitation band was obtained byfitting the excitation-emission curves with the Gauss function in Origin software
= + π − − y y A w e x x w 0 2 2( c) /2 2 (4)
where y0is the offset, xcis the center of the peak, w is the width, and A is the area. The coefficient of determination (R2) stands at >0.99.
Let us start with the compound Tb3+:YV0.02As0.98O4, i.e., the
codoped arsenate YAsO4: 2 mol % V5+,1 mol % Tb3+ with
negligible interaction between Tb3+and V5+ions. In the previous work,31the fundamental excitation (FE) of the YAsO4host was located roughly at≈255 nm (39 200 cm−1, 4.86 eV) from a low
Tb → As MMCT in solids and similarly, no direct information exists on the energy of the Tb3+(4f8), V5+(3d0)→
Tb4+(4f7), V4+(3d1) CT in YVO4, since the Tb3+ions emission is
quenched in this compound. We tentatively introduce here a method allowing an estimation of these CT energies by transposing the Pr3+-to-metal CT model published in another
study37 to the case of Tb3+ ions. This model uses the methodology developed by Dorenbos through which the energy levels of divalent and trivalent lanthanides can be positioned respective to fundamental bands (top of valence band/bottom of conduction band) of a given crystal lattice (A).38,39Following the Dorenbos’ model, we calculate the vacuum-referred binding energy of an electron located in the 4f8(7F0) ground state of
Tb3+ion in the lattice (A) in eV using
= − + − − − + Δ + U U U E VRBE(Tb , 4f , A) 24.92 18.05 (A) 0.777 0.0353 (A) (A) (4f , 4f ) 3 8 8 6 (5)
where 24.92 eV is the third ionization energy of europium as a free atom, −
−
U U
18.05 (A)
0.777 0.0353 (A) is the chemical shift,
40
U(A) is the Coulomb repulsion energy associated with lattice (A) determined within an accuracy of ≈±0.1 eV as the binding energy difference between the Eu2+ (4f7) and Eu3+ (4f6) ions
ground states41−43andΔE(4f8, 4f6) is the energy separating 4f8 and 4f6 ground states of Tb3+ and Eu3+ ions. This value was
estimated at 3.58 eV in19,44but recently revised in39,45to a value amounting 3.4 eV, which we will retain here. Following the methodology described in another study and adapting it to Tb3+37
the absolute value of VRBE(Tb3+, 4f8, A) is connected
with the Tb3+→ Mn+CT energy according to
χ − = − − + + + ′ + + + k d MMCT(Tb M , A) VRBE(Tb , 4f , A) (A) (M ) (Tb M ) n n n 3 3 8 CN 3 (6)
whereχCN′(Mn+) is the electronegativity of the metal cation Mn+ with coordination number CN′ in the crystal lattice as calculated in a previous study,46k(A) is a lattice-related parameter, and d(Tb3+-Mn+) is the shortest distance between the cations,
corrected from ionic radii mismatches between Tb3+ and its doping site in the crystal lattice. Taking A = YVO4, we have χ4(V5+) = 2.46, the electronegativity of tetrahedrally
coordi-nated V5+as picked up in the previous study,46
d(Tb3+-V5+) =
3.155 Å and k(YVO4) = 5.73 eV.37Using U(YVO4) = 7.0 eV,37
we calculate VRBE(Tb3+,4f8, YVO
4) =−7.67 eV fromeq 5and
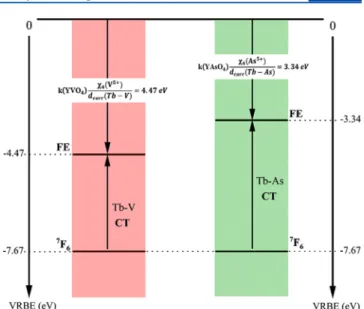
MMCT (Tb3+-V5+, YVO4) = 3.2 eV from eq 6. This value
matches well the energy level scheme published in a previous study.47This very low position of the Tb-V CT state accounts
Figure 7.Excitation emission spectra of the YVxAs1−xO4doped with 1
mol % Tb3+ions annealed at 800°C.
Table 3. Probability for the Tb3+Ions to Find V5+Acceptor in Its Immediate Neighborhood and the Energy of the Lowest Excitation Band in the Solid Solution YVxAs1−xO4
x P(x) (%) energy of the lowest excitation band (eV)
0.02 4 4.14 0.05 10 4.05 0.10 19 3.95 0.15 28 3.93 0.20 36 3.89 0.30 51 3.87 0.40 64 3.84 0.50 75 3.79 0.60 84 3.77 0.65 88 3.83
for the quenching of the Tb3+ ion emission in YVO 4. The
situation is more complex for YAsO4, essentially because the
spectroscopy of trivalent lanthanides is very poorly documented in this compound, except for Eu3+.24,48,49 In particular, the absence of information pertaining to f−d transitions of Ce3+ions
prevents calculating the energy of the lowest spin-allowed 4f8→ 4f75d1transition of Tb3+ions in this lattice via the redshift model
of Dorenbos.41,42 This issue remains therefore open. In this context, we will concentrate on the possibility of a Tb3+-to-As5+
CT in this compound. The use of eqs 5 and 6 requires the determination of U(YAsO4) and k(YAsO4); d(Tb3+-V5+) =
3.155 Å is obtained from ICSD 24513 standard card of YAsO4
and χ4(As5+) = 2.5 is picked up from the previous study.46
U(YAsO4) can be estimated following a concept introduced by Dorenbos in the previous study50and reused latter in,37,38which establishes a connection between U(A) and the average electronegativityχav(A) of the lattice (A) defined as
χ = ∑ χ ∑ n Z n Z (A) i i i i i i i av (7)
where niis the number of cations of type i with charge Ziand electronegativityχi. Using the electronegativity scale of Li and
Xue,46we calculateχav(YVO4) = 2.03 andχav(YAsO4) = 2.04. The similarity of the values prompts us to consider in thefirst intention that U(YAsO4) = U(YVO4) = 7.0 eV. It should be
noted that the valueχav(YVO4) differs a bit from that published
by Dorenbos et al.,38which used Pauling electronegativities. The value of k(YAsO4) is yet impossible to determine by means of empirical approaches as it was done in the previous study37due to the lack of experimental optical data pertaining to Pr3+or Tb3+
in arsenates. However, we can try a direct estimation of this value considering that k(A) in eq 6 is analogous to a Coulomb constant and therefore writable in units of eV Å ask(A)= ε14.4
(A)
r
, where εr(A) is the real part of the dielectric constant of
compound (A) in a spectral region corresponding to the UV excitation band that is suspected of CT origin, i.e.,≈+4 eV. We found εr(YAsO4) ≈ 3.451 (JVASP-10202), which gives
k(YAsO4)≈ 4.2 eV Å. Introducing all of the required data in
eq 6 gives a Tb3+−As5+ energy of 4.33 eV in Tb3+:YAsO4.
Considering the values given in Table 3, this result looks relevant. We therefore conclude that the lower-lying excitation band in the As-rich part of the Tb3+:YV
xAs1−xO4solid solution
contains a Tb3+→ As5+CT contribution, possibly mixed with Tb f−d transitions, although this could not be assessed in the present work. As evidenced inTable S1, the increase in V5+ content does not modify the Tb-As/V distances significantly. This means that the Tb3+→ As5+CT almost keeps its energy; only the probability of forming that CT state diminishes. In parallel, a second excitation band grows up to the low-energy side. The energy position of this band (≈3.8 eV) matches O2−→ V5+LMCT within the isolated (VO4)3−groups
22
and is ascribed accordingly. This band attests to the occurrence of (VO4)3−
-to-Tb3+energy transfer. Concomitantly, the progressive increase of
the probability of having a V atom in the immediate vicinity of Tb atoms results in the formation of the Tb3+-to-V5+CT state at
≈3.2 eV, which quenches the Tb3+ ion emission. The
corresponding situation is sketched in Figure 8 for the end members of the Tb3+:YVxAs1−xO4solid solution.
4. CONCLUSIONS
The terbium-doped YVxAs1−xO4system (0≤ x ≤ 0.65) has been synthesized as pure tetragonal nanocrystals using a co-precipitation synthesis route. The detailed study of yttrium orthovanadate-arsenate structures presented complete crystal-lization and was confirmed by X-ray diffraction and Rietveld analysis. It has been found and described in detail the regularity with observed structural and spectroscopic measurements.
Moreover, the designed physicochemical experiments have allowed unambiguous determination of the spectroscopic properties, such as emission, excitation, and luminescence kinetics. The presented measurements and calculations allowed a clear inference and thus proposing the basic information concerning Tb3+−V5−quenching and formation of Tb3+-to-As5+
metal-to-metal charge transfer (CT) state. Furthermore, the main reasons for the quenching occurrence are both very low position of the Tb-V CT state and directly influenced by the variation of the band gap.
■
ASSOCIATED CONTENT*
sı Supporting InformationThe Supporting Information is available free of charge at
https://pubs.acs.org/doi/10.1021/acs.jpcc.0c04668.
Fourier transform infrared (FT-IR) spectrum of yttrium orthovanadate-arsenate powders (Figure S1); diffraction data for undoped matrices of YVO4, YVxAs1−xO4, and
YAsO4in comparison to standard ICSD patterns (a) and the dependence of the lattice plane (220) on shift (b) (Figure S2); unit cell parameters (a, c), cell volume (V), crystallite size as well as refine factor (Rw) for
Tb0.01Y0.99VxAs1−xO4prepared at 800 °C as a function of V5+ion concentration (Table S4); rise time dependent on the vanadium concentration (Figure S3) (PDF)
■
AUTHOR INFORMATIONCorresponding Author
Rafal J. Wiglusz− Institute of Low Temperature and Structure Research, Polish Academy of Sciences, 50-422 Wroclaw, Poland;
orcid.org/0000-0001-8458-1532; Phone: +48 (071)
3954159; Email:r.wiglusz@intibs.pl; Fax: +48 (071) 3441029
Verona, Italy; orcid.org/0000-0002-1271-4241
Sara Targonska− Institute of Low Temperature and Structure Research, Polish Academy of Sciences, 50-422 Wroclaw, Poland Jorma Hölsä − Department of Physics, University of the Free State,
ZA-9300 Bloemfontein, South Africa Complete contact information is available at:
https://pubs.acs.org/10.1021/acs.jpcc.0c04668
Notes
The authors declare no competingfinancial interest.
■
ACKNOWLEDGMENTSThe authors would like to acknowledge the National Science Centre in Poland (NCN− Narodowe Centrum Nauki) for the financial support within the Project “Preparation and modu-lation of spectroscopic properties of YXZO4, where X and Z-P5+,
V5+, As5+, doped with‘s2-like’ ions and codoped with rare earth ions” (No. UMO-2019/33/B/ST5/02247). We are grateful to M.Sc. E. Bukowska for performing XRPD measurements and to Ph.D. D. Szymanski for SEM-EDS measurements.
■
REFERENCES(1) Carlos, L. D.; Ferreira, R. A. S.; de Zea Bermudez, V.; Julián-López, B.; Escribano, P. Progress on Lanthanide-Based Organic-Inorganic Hybrid Phosphors. Chem. Soc. Rev. 2011, 40, 536−549.
(2) Luitel, H. N.; Chand, R.; Torikai, T.; Yada, M.; Watari, T. Highly Efficient NIR-NIR Upconversion in Potassium Substituted Ca-MoO4:Tm3+, Yb3+phosphor for Potential Biomedical Applications. RSC Adv. 2015, 5, 17034−17040.
(3) Nampi, P. P.; Varma, H.; Biju, P. R.; Kakkar, T.; Jose, G.; Saha, S.; Millner, P. Sodium Yttrium Fluoride Based Upconversion Nano Phosphors for Biosensing. J. Phys. Conf. Ser. 2015, 619, No. 012043.
(4) Bednarkiewicz, A.; Wawrzynczyk, D.; Nyk, M.; Samoć, M. Tuning Red-Green-White up-Conversion Color in Nano NaYF4:Er/Yb Phosphor. J. Rare Earths 2011, 29, 1152−1156.
(5) Wangkhem, R.; Singh, N. S.; Singh, N. P.; Singh, S. D.; Singh, L. R. Facile Synthesis of Re-Dispersible YVO4:Ln3+(Ln3+= Dy3+, Eu3+, Sm3+) Nanocrystals: Luminescence Studies and Sensing of Cu2+ions. J. Lumin. 2018, 203, 341−348.
(6) Shao, J.; Yan, J.; Li, X.; Li, S.; Hu, T. Novel Fluorescent Label Based on YVO4: Bi3+, Eu3+ for Latent Fingerprint Detection. Dyes Pigm. 2019, 160, 555−562.
(7) Wu, C.-C.; Chen, K. B.; Lee, C.; Sen; Chen, T. M.; Cheng, B. M. Synthesis and VUV Photoluminescence Characterization of (Y,Gd)-(V,P)O4:Eu3+ as a Potential Red-Emitting PDP Phosphor. Chem. Mater. 2007, 19, 3278−3285.
(8) Fields, R. A.; Birnbaum, M.; Fincher, C. L. Highly Efficient Nd:YVO4 diode - Laser End-Pumped Laser. Appl. Phys. Lett. 1987, 51, 1885−1886.
(9) Kränkel, C.; Fagundes-Peters, D.; Fredrich, S. T.; Johannsen, J.; Mond, M.; Huber, G.; Bernhagen, M.; Uecker, R. Continuous Wave Laser Operation of Yb3+:YVO4. Appl. Phys. B 2004, 79, 543−546.
matographic Test Strip Assay. Mater. Res. Bull. 2013, 48, 4454−4459. (14) Blasse, G.; Bril, A. Investigation of Some Ce3+ - Activated Phosphors. J. Chem. Phys. 1967, 47, 5139.
(15) Blasse, G.; Bril, A. Photoluminescent Efficiency of Phosphors with Electronic Transitions in Localized Centers. J. Electrochem. Soc. 1968, 115, 1067−1075.
(16) Delosh, R. G.; Tien, T. Y.; Gibbons, E. F.; Zacmanidis, P. J.; Stadler, H. L. Strong Quenching of Tb3+ Emission by Tb−V Interaction in YPO4−YVO4. J. Chem. Phys. 1970, 53, 681.
(17) Mraouefel, A.; Guerbous, L.; Boukerika, A.; Diaf, M.; Mendoud, A.; Seraiche, M. Effect of the Vanadium Concentration on Structural and Photoluminescence of YP1-XVxO4: 1 at.% Tb3+ Nanophosphors. Opt. Mater. 2017, 65, 129−136.
(18) Krumpel, A. H.; Boutinaud, P.; Van Der Kolk, E.; Dorenbos, P.; et al. Charge Transfer Transitions in the Transition Metal Oxides ABO4:Ln3+ and APO4:Ln3+ (A=La, Gd, Y, Lu, Sc; B=V, Nb, Ta; Ln=lanthanide). J. Lumin. 2010, 130, 1357−1365.
(19) Dorenbos, P.; Krumpel, A. H.; Kolk, E. Van Der.; Boutinaud, P.; Bettinelli, M.; Cavalli, E. Lanthanide Level Location in Transition Metal Complex Compounds. Opt. Mater. 2010, 32, 1681−1685.
(20) Sohn, K.; Zeon, I. W.; Chang, H.; Lee, S. K.; Park, H. D. Combinatorial Search for New Red Phosphors of High Efficiency at VUV Excitation Based on the YRO4 (R = As, Nb, P, V) System. Chem. Mater. 2002, 14, 2140−2148.
(21) Huang, Z.; Feng, J.; Pan, W. Theoretical Investigations of the Physical Properties of Zircon-Type YVO4. J. Solid State Chem. 2012, 185, 42−48.
(22) Cavalli, E.; Angiuli, F.; Mezzadri, F.; Trevisani, M.; Bettinelli, M.; Boutinaud, P.; Brik, M. G. Tunable Luminescence of Bi3+ -Doped YPxV1-XO4 (0=<x=<1). J. Phys. Condens. Matter 2014, 26, No. 385503.
(23) Dolgos, M. R.; Paraskos, A. M.; Stoltzfus, M. W.; Yarnell, S. C.; Ã, P. M. W. The Electronic Structures of Vanadate Salts: Cation Substitution as a Tool for Band Gap Manipulation. J. Solid State Chem. 2009, 182, 1964−1971.
(24) Poolton, N. R. J.; Bos, A. J. J.; Jones, G. O.; Dorenbos, P. Probing Electron Transfer Processes in YPO4: Ce, Sm by Combined Synchrotron− Laser Excitation Spectroscopy. J. Phys. Condens. Matter 2010, 22, No. 185403.
(25) Inoue, Y. Photocatalytic Water Splitting by RuO2-Loaded Metal Oxides and Nitrides with D0- and D10- Related Electronic Configurations. Energy Environ. Sci. 2009, 2, 364−386.
(26) Errandonea, D.; Kumar, R.; López-Solano, J.; Rodríguez-Hernández, P.; Muñoz, A.; Rabie, M. G.; Sáez Puche, R. Experimental and Theoretical Study of Structural Properties and Phase Transitions in YAsO4 and YCrO4. Phys. Rev. B. 2011, 83, 1−12.
(27) Ledderboge, F.; Nowak, J.; Massonne, H.; Förg, K.; Höppe, H. A.; Schleid, T. High-Pressure Investigations of Yttrium (III) Oxoarsenate (V): Crystal Structure and Luminescence Properties of Eu3+ - Doped Scheelite-Type Y[AsO4] from Xenotime-Type Precursors. J. Solid State Chem. 2018, 263, 65−71.
(28) Chakoumakos, B. C.; Abraham, M. M.; Boatner, L. A. Crystal Structure Refinements of Zircon-Type MVO4 (M = Sc, Y, Ce, Pr, Nd, Tb, Ho, Er, Tm, Yb, Lu). J. Solid State Chem. 1994, 109, 197−202.
(29) Ropp, R. C.; Carroll, B. Yttrium Phosphate-Yttrium Vanadate Solid Solutions and Vegard’s Law. Inorg. Chem. 1975, 14, 2199−2202.
(30) Pan, G.; Song, H.; Dai, Q.; Qin, R.; Bai, X.; Dong, B.; Fan, L.; Wang, F. Microstructure and Optical Properties of Eu3+ Activated YV 1-XPxO4 Phosphors. J. Appl. Phys. 2008, 104 (). DOI: 10.1063/ 1.3003130.
(31) Strzep, A.; Watras, A.; Zawisza, K.; Boutinaud, P.; Wiglusz, R. J. Forgotten and Resurrected Chernovite-(Y): YAsO4 Doped with Eu3+ Ions as a Potential Nanosized Luminophore. Inorg. Chem. 2017, 56, 10914−10925.
(32) Wiglusz, R. J.; Bednarkiewicz, A.; Strek, W. Role of the Sintering Temperature and Doping Level in the Structural and Spectral Properties of Eu-Doped Nanocrystalline YVO4. Inorg. Chem. 2012, 51, 1180−1186.
(33) Kumar, V.; Som, S.; Kumar, V.; Kumar, V.; Ntwaeaborwa, O. M.; Coetsee, E.; Swart, H. C. Tunable and White Emission from ZnO:Tb3+ Nanophosphors for Solid State Lighting Applications. Chem. Eng. J. 2014, 255, 541−552.
(34) Zhou, X.; Jiang, S.; Xiang, G.; Tang, X.; Luo, X.; Li, L.; Zhou, X. Tunable Emission Color of Li2SrSiO4:Tb3+ Due to Cross-Relaxation Process and Optical Thermometry Investigation. J. Am. Ceram. Soc. 2018, 101, 3076−3085.
(35) Sobierajska, P.; Wiglusz, R. J. Influence of the Grain Sizes on Stokes and Anti-Stokes Fluorescence in the Yb3+ and Tb3+ Ions Co-Doped Nanocrystalline Fluorapatite. J. Alloys Compd. 2019, 785, 808− 818.
(36) Minakova, T.; Mjakin, S.; Bakhmetyev, V.; Sychov, M.; Zyatikov, I.; Ekimova, I.; Kozik, V.; Chen, Y.; Kurzina, I. Highly Efficient YVPO4 Luminescent Materials Activated by Europium. Crystals 2019, 9, No. 658.
(37) Boutinaud, P. Rationalization of the Pr3+-to-Transition Metal Charge Transfer Model: Application to the Luminescence of Pr3+ in Titano-Niobates. J. Lumin. 2019, 214, No. 116557.
(38) Dorenbos, P.; Rogers, E. G. Vacuum Referred Binding Energies of the Lanthanides in Transition Metal Oxide Compounds. ECS J. Solid State Sci. Technol. 2014, 3, R150−R158.
(39) Dorenbos, P. The Pr3+ and Tb3+ Ground State Locations in Compounds Obtained from Thermoluminescence and Intervalence Charge Transfer Studies. Opt. Mater. 2019, 91, 333−337.
(40) Dorenbos, P. Modeling the Chemical Shift of Lanthanide 4f Electron Binding Energies. Phys. Rev. B 2012, 85, No. 165107.
(41) Dorenbos, P. The 4fn-4fn-15d Transitions of the Trivalent Lanthanides in Halogenides and Chalcogenides. J. Lumin. 2000, 91, 91−106.
(42) Dorenbos, P. f-d Transition Energies of Divalent Lanthanides in Inorganic Compounds. J. Phys. Condens. Matter 2003, 15, 575−594.
(43) Dorenbos, P. Lanthanide Charge Transfer Energies and Related Luminescence, Charge Carrier Trapping, and Redox Phenomena. J. Alloys Compd. 2009, 488, 568−573.
(44) Dorenbos, P. Charge Transfer Bands in Optical Materials and Related Defect Level Location. Opt. Mater. 2017, 69, 8−22.
(45) Dorenbos, P. [INVITED] Improved Parameters for the Lanthanide 4f And 4f−1 5d Curves in HRBE and VRBE Schemes That Takes the Nephelauxetic Effect into Account. J. Lumin. 2020, 222, No. 117164.
(46) Li, K.; Xue, D. Estimation of Electronegativity Values of Elements in Different Valence States. J. Phys. Chem. A 2006, 110, 11332−11337.
(47) Dorenbos, P.; Krumpel, A. H.; Van Der Kolk, E.; Boutinaud, P.; Bettinelli, M.; Cavalli, E. Lanthanide Level Location in Transition Metal Complex Compounds. Opt. Mater. 2010, 32, 1681−1685.
(48) Linares, C.; Louat, A.; Blanchard, M. Rare-Earth - Oxygen Bonding in the LnMO4 Xenotime Structure: Spectroscopic Inves-tigation and Comparative Study of Ligand Field Modesl. In New Concepts; Springer: Berlin, Heidelberg, 1977; pp 179−207.
(49) McCarthy, G. J.; Rhyne, J. J.; Silber, H. B. The Rare Earths in Modern Science and Technology, 2nd ed.; Plenum Press: New York, 1980.
(50) Dorenbos, P. Relating the Energy of the [Xe]5d1 Configuration of Ce3+ in Inorganic Compounds with Anion Polarizability and Cation Electronegativity. Phys. Rev. B 2002, 65, No. 235110.
(51) Choudhary, K.; Zhang, Q.; Reid, A. C. E.; Chowdhury, S.; Van Nguyen, N.; Trautt, Z.; Newrock, M. W.; Congo, F. Y.; Tavazza, F. Computational Screening of High-Performance Optoelectronic Materials Using OptB 88 VdW and TB-MBJ Formalisms. Sci. Data 2018, 5, No. 180082.