HAL Id: hal-01535480
https://hal.archives-ouvertes.fr/hal-01535480
Submitted on 9 Jun 2017
HAL is a multi-disciplinary open access
archive for the deposit and dissemination of
sci-entific research documents, whether they are
pub-lished or not. The documents may come from
teaching and research institutions in France or
abroad, or from public or private research centers.
L’archive ouverte pluridisciplinaire HAL, est
destinée au dépôt et à la diffusion de documents
scientifiques de niveau recherche, publiés ou non,
émanant des établissements d’enseignement et de
recherche français ou étrangers, des laboratoires
publics ou privés.
Crowdsourcing the Robin Hood effect in cities
Thomas Louail, Maxime Lenormand, Juan Arias, José Ramasco
To cite this version:
Thomas Louail, Maxime Lenormand, Juan Arias, José Ramasco. Crowdsourcing the Robin Hood
effect in cities. Applied Network Science, Springer, 2017, 2 (11), pp.11. �10.1007/s41109-017-0026-3�.
�hal-01535480�
Thomas Louail,1,∗ Maxime Lenormand,2,∗ Juan Murillo Arias,3 and Jos´e J. Ramasco1
1
Instituto de F´ısica Interdisciplinar y Sistemas Complejos IFISC (CSIC-UIB), Campus UIB, 07122 Palma de Mallorca, Spain
2
Irstea, UMR TETIS, 500 rue Fran¸cois Breton, FR-34093 Montpellier, France 3
BBVA Data & Analytics,Avenida de Burgos 16D, E-28036 Madrid, Spain
Socioeconomic inequalities in cities are embedded in space and result in neighborhood effects, whose harmful consequences have proved very hard to counterbalance efficiently by planning policies alone. Considering redistribution of money flows as a first step toward improved spatial equity, we study a bottom-up approach that would rely on a slight evolution of shopping mobility practices. Building on a database of anonymized credit card transactions in Madrid and Barcelona, we quantify the mobility effort required to reach a reference situation where commercial income is evenly shared among neighborhoods. The redirections of shopping trips preserve key properties of human mobility, including travel distances. Surprisingly, for both cities only a small fraction (∼ 5%) of trips need to be altered to reach equity situations, improving even other sustainability indicators. The method could be implemented in mobile applications that would assist individuals in reshaping their shopping practices, to promote the spatial redistribution of opportunities in the city.
The growth of economic inequality has raised con-cern and attention in recent years [1, 2]. In cities, entangled processes such as location choices of house-holds and businesses, daily mobility, segregation and closure attitudes, central planning, or global economic restructuring contribute to these inequalities becom-ing embedded in space. Over the course of several decades their joint actions have given rise to spatially segregated cities, characterized by uneven distribu-tions of capital among their neighborhoods. While the intensity of socioeconomic inequalities vary from one city to another, the general observation that ”some neighborhoods are poorer than others” has been made for cities with different age, in every continent, and for different periods in urban history [3–6]. An abundant literature has long depicted the neighborhood effect [7], and highlighted its societal costs and enduring consequences [8–12].
Over the last decade, increasing volumes of digital geographic footprints have been passively produced by individuals using mobile ICT devices, and these footprints have been increasingly analyzed by scien-tists as well. These data are not free of biases [13] or privacy concerns [14], but they undeniably consti-tute an important asset for understanding social phe-nomena in detailed spatio-temporal contexts [15–20]. They also have the potential to reveal the informa-tion required to coordinate individuals’ acinforma-tions, so that large groups of people can tackle issues which are distributed and spatial by nature. This is par-ticularly true in the case of mobility networks, which already integrate such footprints in feedback mecha-nisms: people produce data when moving, and their travel decisions are partly guided by the data pro-duced by others. Examples include GPS navigation using real-time traffic data, local search and discovery
∗Corresponding authors ([email protected],
[email protected]) who contributed equally to this work.
of new places, or location-based dating applications. So far these footprints have been mainly used in ap-plications intended to enhance individual satisfaction (time savings, discovery of a location, encounter of a partner), but they have also fostered spontaneous and large-scale solidarity movements during disasters (e.g. Facebook’s safety check, or the use of dedicated Twitter hashtags). An important question thus con-cerns the possibility to scale up the use of such per-vasive data, in order to address complex social issues with distributed and coordinated approaches, issues for which improvements would necessarily occur on longer timescales. There is a need to relate smart technology with sustainability and spatial justice in cities [21], and this implies building upon the existing practices of individuals. Here we develop further this idea by focusing on a complex problem: the reduction of spatial inequality in large cities.
The “Robin-Hood effect” refers to a process through which capital is redistributed to reduce inequality. A spatial and city-scale implementation would then con-sist in taking from the rich neighborhoods to give to the poor. This role is normally played by the city’s governance, and is essential to mitigate spatial in-equality. However, studies in cities worldwide have demonstrated that top-down planning and fiscal poli-cies alone are inefficient in significantly counterbal-ancing the consequences of the neighborhood effect [22,23]. It has also been long emphasized that devel-oping economic activity in disadvantaged regions in-directly benefits the surrounding populations, by fos-tering job opportunities, transport facilities and in-creased safety [24]. Here we study an original ap-proach to rebalance economic activity among a city’s neighborhoods, that would not incur any additional environmental or monetary costs, but would instead require a slight evolution of shopping mobility prac-tices. According to surveys, shopping and leisure trips account for 15% to 20% of the individuals’ daily trips [25]. Such trips virtually move money from one part of the city to another, and directly contribute to shape
0.2 0.4 0.6 0.8 1.0 Normalized income per business $ $
(a)
(b)
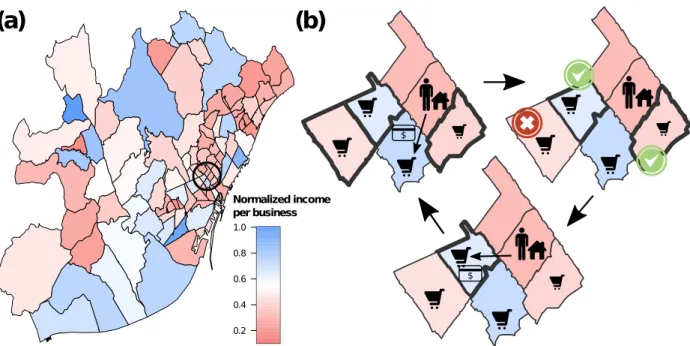
Figure 1. Rewiring urban shopping trips. (a) Average income per business in the neighborhoods of Barcelona resulting from individual transactions. The average income has been normalized by the maximum value among neighborhoods. The data correspond to 2011 and is displayed by zip code in the metropolitan area. From this perspective, some neighborhoods are five times richer than others. (b) The general principle common to the iterative rewiring methods. At each step a transaction is randomly selected, along with the possible alternative businesses (highlighted in bold). If rewiring the transaction to one of them (randomly selected) decreases inequality between neighborhoods and matches the other constraints, then rewiring is performed.
the distribution of wealth across neighborhoods. By connecting areas, shopping trips foster metropolitan integration and social cohesion [26], and the resulting money flows are a key component of the development of territories [27]. In large cities there are businesses of various types in most of the neighborhoods, and ev-ery time one has to buy usual products such as food, gas or clothes, one can actually choose among sev-eral stores and sevsev-eral neighborhoods, even without increasing the distance traveled.
In the following we demonstrate that more evenly balanced cities are reachable by the cumulative ad-dition of small and reasonable changes in a limited fraction of individuals’ shopping destinations. While there exists various spatial indicators for quantifying territorial inequalities, static indicators fail to provide a clear picture of the collective effort required to reach a certain level of redistribution. This in mind, we quantify the proportion of individual shopping trips that should be redirected to evenly share the com-mercial income between neighbourhoods, a conceiv-able path toward the spatial redistribution of oppor-tunities in the city. We show that alternative shopping mobility scenarios not only allow to distribute money more evenly in space, but also to enhance the spatial mixing of city residents through their shopping mo-bility, without increasing the total distance traveled, nor changing the effective purchases and the mobility routines of individuals.
RESULTS Data
We use a dataset containing one year of credit card transactions for more than 150 000 anonymous users in over 95 000 businesses of Barcelona and Madrid. Each transaction is time-stamped and contains the informa-tion collected by the bank on both the cardholder and the business. It also includes the customer’s age and residence neighborhood, the business category and its geographical coordinates (see the Appendix for de-tails). From these data there are two obvious ways to estimate inequality among neighborhoods: first, in measuring the income of their residents – indirectly estimated through the total amount of money spent during the year; second, in measuring the total income resulting from the commercial activity of businesses located in these neighborhoods. The map on Figure1a shows the latter for Barcelona, and reveals that some neighborhoods are indeed five times “richer” than oth-ers. This measure is particularly interesting because it results from the spatial organization of shopping trips, which may be much easier to alter than any other type of our daily trips, notably commuting.
Rewiring the shopping trips networks
From the data for both cities we construct the bi-partite spatial network whose nodes are individuals
0 5 10 15 20 25 30 0.0 0.2 0.4 0.6 0.8 1.0
Percentage of rewired transactions
W
W
0(a)
(b)
U-U U-W W-U W-W 0 5 10 15 20 25 30 35 0.0 0.2 0.4 0.6 0.8 1.0Number of rewiring operations Xx 105)
Xk
X0 WS
D ρ
Rewiring heuristic
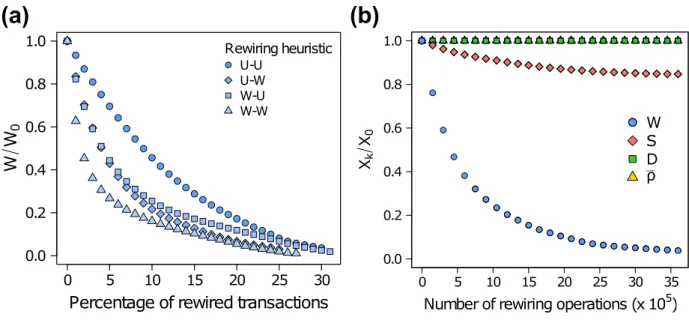
Figure 2. Decreasing spatial inequality in the city by adapting daily shopping destinations. (a) Decrease of wealth inequal-ity among neighborhoods as a function of the fraction of transactions rewired, for various rewiring methods. Four combinations of choice heuristics are considered, ”Uniform-Uniform” (U-U in the legend), ”Uniform-Weighted” (U-W), ”Weighted-Uniform” (W-U) and ”Weighted-Weighted” (W-W). (b) Decrease of wealth inequality (W /W0) while preserving the spatial mixing index (S/S0), the total distance traveled (D/D0) and the exploration rate ( ¯ρ/ ¯ρ0), as a function of the number of rewiring operations. Values have been averaged over hundreds of replications. The bars represent the minimum and the maximum values obtained but in most cases are too close to the average to be seen (see Figure S9-S10in Appendix for Madrid).
and businesses, and whose edges stand for transac-tions (see Figure S2 in Appendix). We then per-form rewiring experiments, in which randomly se-lected transactions are redirected toward alternative businesses of the same category, but located elsewhere in the city. The purpose of each rewiring operation is to incrementally decrease inequality in the spatial dis-tribution of business income W (see Figure1a). Fur-thermore, we consider three key properties of urban mobility: the distance traveled D, the individual mo-bility routines ¯ρ (measured as the tendency to return to already visited businesses), and finally the spatial mixing of residents of different neighborhoods S. W and S are defined as distances to homogeneous spatial configurations. At each step, an individual transac-tion is selected along with all the candidate businesses toward which it could be reasonably redirected. One of them is randomly chosen, and if rewiring the trans-action results in distributing money more evenly in space while matching the other constraints, then the change is accepted. The purchases and the amount of expenses of each individual are preserved, and this iterative process is run until the rewiring rate falls below a given threshold. Since the rewiring process is stochastic, all the results have been averaged over hundreds of replications (see Methods for more details about the four metrics and constraints considered in the rewiring process).
Numerous rewiring methods fulfilling these con-ditions could be proposed. In particular, besides the random selection of transactions (’Uniform’
sam-pling), we can choose them according to a probability proportional to their amount and/or inversely pro-portional to the income of the target neighborhood (’Weighted’ sampling). Even more informed methods might be proposed, but for the sake of simplicity, only basic random procedures are considered in the follow-ing.
Reachability of even spatial distributions
We first investigate the reachability of an even spa-tial distribution of the commercial income resulting from individual purchases, while the variables S, D and ¯ρ remain in the range of their empirical values. To address this question, we apply the method with the four constraints of Equation 5 such as αW = 0, αS =1, αD=1 and αρ=1. This constitutes the Ref-erence experiment. Figure2a shows the evolution of inequality in the urban area of Barcelona as a func-tion of the fracfunc-tion of rewired transacfunc-tions, accord-ing to various methods. Surprisaccord-ingly, even with basic random methods, it is possible to reduce spatial in-equality by more than 80% while reassigning only 20% of individual transactions. All the methods produce the same qualitative behavior – an early regime of very fast decay, followed by a regime of slower decay. Weighted methods are naturally more efficient, and allow to reach spatial equity by redirecting a smaller fraction of transactions. In particular, a reduction of 80% in W /W0 can be obtained by rewiring only 5%
of the transactions if the method is double weighted. The state of the other variables S, D and ρ is also monitored along the process, as shown in Figure 2b for a Uniform-Uniform method. What makes the pre-vious results remarkable is in fact that income redis-tribution is achieved without increasing the distance traveled by individuals (D), nor changing their mo-bility routines ( ¯ρ). Moreover, a positive side-effect is to increase the frequency of encounters of individuals living in different parts of the city – as indicated by the decrease of S/S0 –, an effect that could not be
derived from the rewiring constraints alone (αS =1). The increase of spatial mixing is the consequence of in-dividual shopping trips more evenly distributed in the city space, required to homogenize the income among neighborhoods. The behavior of S is non trivial, no-tably because one could imagine unrealistic solutions to this problem that would simultaneously even the business income distribution among neighborhoods and decrease the total distance traveled, by rewiring most of the shopping trips to the closest neighbor-hood containing businesses of the relevant category. The spatial mixing of individuals in this case would decrease dramatically, and S the distance to an ho-mogeneous spatial mixing would increase. Here the decrease of S/S0guarantees that it is not the case.
Preservation of human mobility properties
We wish to control further the likelihood of the rewired shopping mobility networks, and ensure that they preserve the spatial properties of individual hu-man mobility. A small set of indicators are useful to describe the statistical and spatial properties of hu-man mobility [20]. These include the jump length be-tween consecutive locations ∆r, the radius of gyration
rgand the tendency to return to already visited places
ρ. In our case, for each individual ρ is simply defined as the ratio between the number of unique businesses visited and the total number of transactions.
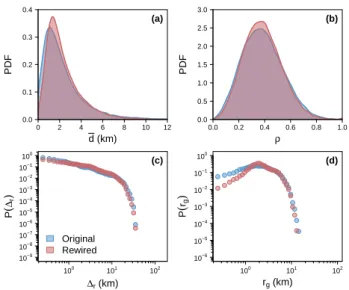
Figure3shows their empirical and simulated values, plus the average distance ¯d traveled by each individ-ual for each shopping trip (see the Methods section for details on the calculation of shopping trips dis-tances). On each panel both curves overlap almost perfectly, indicating that the rewiring has no signifi-cant effect on the key mobility properties. Simulated distributions of ¯d and rgare slightly more peaked than
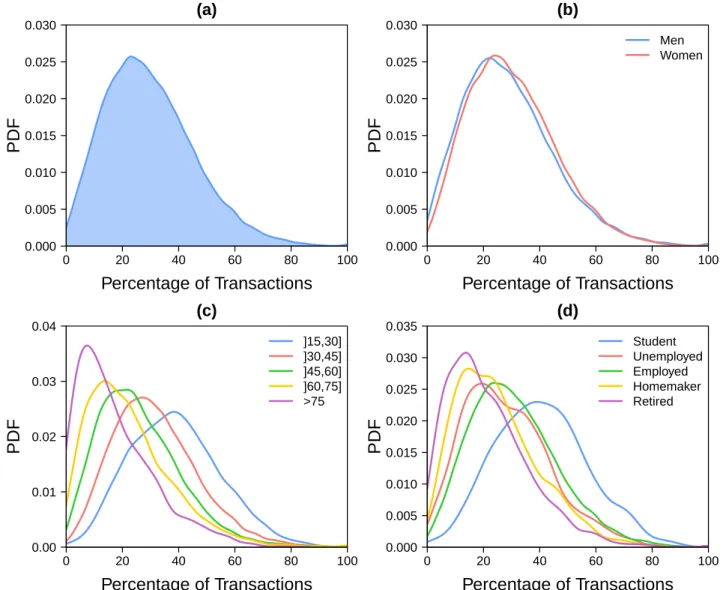
the empirical ones. Finally, we showed in a previous study that young adults tend to spend their money further from their neighborhood of residence [28], and coherently their shopping trips are those that are the most affected in the simulated scenarios (see Figure S5 in Appendix).
Multi-objective improvement
We now perform multi-criteria rewiring experi-ments, to measure to what extent redistribution can
0 2 4 6 8 10 12 0.0 0.1 0.2 0.3 0.4 d (km) PDF (a) 0.0 0.2 0.4 0.6 0.8 1.0 0.0 0.5 1.0 1.5 2.0 2.5 3.0 ρ PDF (b) ∆r (km) P ( ∆r ) 100 101 102 10−9 10−8 10−7 10−6 10−5 10−4 10−3 10−2 10−1 100 (c) Original Rewired rg (km) P ( rg ) 100 101 102 10−6 10−5 10−4 10−3 10−2 10−1 100 (d)
Figure 3. Observed and simulated distributions of human mobility indicators. The distribution of jump lengths ∆r, the radius of gyration rg, the tendency to return to already visited places (ρ) and the individual average distance traveled ( ¯d) are considered. Values measured on the empirical data are in blue, while those obtained after rewiring are in red. The calculation of ∆rand rgis based on the business’ exact geographical coordinates. The simulated distributions plotted here correspond to one particular replication, see the Figure S4for the robustness of the results and Figure S8in Appendix for the same curves for Madrid.
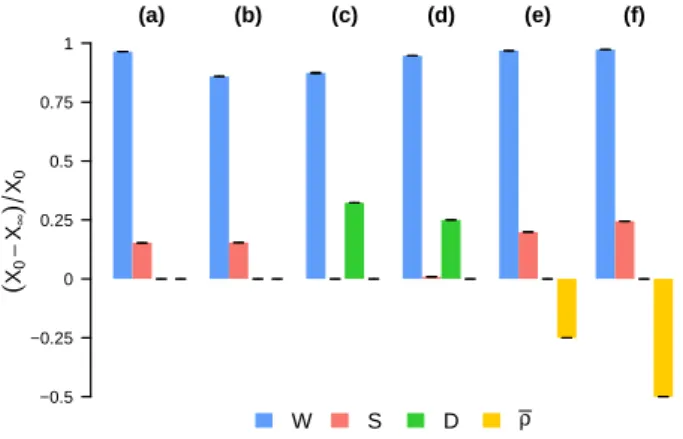
be achieved while improving simultaneously other im-portant aspects of urban mobility. To this end we perform the series of experiments summarized in Ta-ble1. The objective is to even the wealth distribution among neighborhoods (αW = 0) and simultaneously improve either S, D or ¯ρ without worsening the other two. Figure4gives the relative gains and losses upon the four indicators, and the last two columns of Ta-ble 1 contain the asymptotic values obtained for the reduction rate of wealth inequality, for Barcelona (B) and Madrid (M).
Table 1. Experiments performed. Column W indicates the relative gain of (W0−W )/W0. The first value is for Barcelona (B) and the second for Madrid (M).
Experiment αW αS αD αρ¯ W (B/M)
(a) Reference 0 1 1 1 96.4%/99.5%
(b) Spatial mixing ↑ 0 0.75 1 1 85.9%/78.1% (c) 50% energy savings 0 1 0.5 1 87.4%/84.8% (d) 25% energy savings 0 1 0.75 1 94.7%/98.8% (e) Exploration rate ↑ 0 1 1 1.25 96.8%/99.9% (f) Exploration rate ↑↑ 0 1 1 1.5 97.3%/100%
Experiments prove that it is possible to combine significant improvements on several dimensions simul-taneously. This is not an issue with the method but rather with the objectives set, which are somewhat op-posite. Most individuals perform their shopping trips
−0.5 −0.25 0 0.25 0.5 0.75 1 (a) (b) (c) (d) (e) (f) ( X0 − X∞ ) X0 W S D ρ
Figure 4. Multi-criteria improvement of shopping mobil-ity. Each group of bars gives the relative gains or losses for the four indicators W , S, D and ¯ρ. Experiments are described in Table1. See Figure S11in Appendix for Madrid.
near their residence – as highlighted by the empirical distributions in Figure 3– and consequently it is not feasible to simultaneously diversify the neighborhoods where an individual regularly travels to – in order to improve spatial mixing S – and at the same time de-crease the total travel distance D. More surprisingly, experiment (b) indicates that it is also not possible to simultaneously improve the wealth redistribution and the spatial mixing of individuals. The two indicators are based on different metrics (the amount of money spent per business for W and the number of trips for S), which imply different reference egalitarian situa-tions (see Figure S6 in Appendix for more details). Optimization is thus a trade-off between the various consequences of shopping mobility at the city scale. However, experiments (c) and (d) prove that it is pos-sible to significantly decrease the total distance trav-eled and in the same time to strongly reduce wealth inequality among neighborhoods, but not as much as in the reference experiment. Still, it is remarkable that experiment (d) results in an alternative mobility network such that the spatial inequality of the aver-age business income is reduced by 95%, while the total distance associated to shopping mobility is reduced by 25%, the level of spatial mixing is preserved, as well as the individual mobility routines. Finally experiments (e) and (f) show that even if residents deeply restruc-tured their mobility routines, and typically started go-ing to a new business each time they perform a new shopping trip, keeping control of the total distance traveled in the city would prevent from increasing the mixing of individuals coming from different neighbor-hoods beyond 25%. The gains in terms of wealth re-distribution would not be significant when compared to the reference experiment (a).
DISCUSSION
Reducing urban segregation and increasing spatial justice are some of the major challenges faced by cities
worldwide, and the digital footprints passively pro-duced by their residents constitute a promising re-source to help addressing these issues from the bot-tom. This study is a first attempt to quantify the re-lation between shopping mobility and the spatial dis-tribution of economic activity in the city. The alter-native shopping trips resulting from our experiments offer an interesting trade-off between the preservation of essential aspects – the effective purchases of individ-uals and households, and their mobility properties – and some reasonable changes in the places where they spend their money. The addition of small changes in the shopping destinations of individuals can dramat-ically impact the spatial distribution of money flows in the city, and the frequency of encounters between residents of different neighborhoods, even if the total number of changes remains small. These results have important consequences, and they lead in particular to the decisive question of the effective implementa-tion of alternative shopping travels, like those drawn by our experiments. While the decision process be-hind each individual redirection may appear intricate for a single person, one could easily imagine dedicated mobile applications, querying databases very similar to the one used in this paper. Their purpose would be to assist their users in a transition toward a more socially and spatially concerned shopping mobility.
Limitations of the study
However one should keep in mind that individu-als do not guide most of their travel decisions by philanthropy, but instead by balancing accessibility, price and business characteristics. Individuals first choose their casual shopping destinations with regard of transport facilities and travel time budget [29]. Here as accessibility information we considered the Euclidean distance between neighborhoods. However in urban environments the Euclidean distance is rarely a direct proxy for travel time [30], and some of the rewired shopping trips are unlikely to be performed in the real world. We also assumed that every shopping trip follows the simple pattern A → B → A, and we did not consider the more complicated case of chained trips (e.g. A → B → C → A) during which individuals join several trips associated with different purposes [31]. People also tend to choose the places where they spend money according to several other key factors, the price of products in the first place, but also accord-ing to some more personal appreciations, such as the ”ambiance” of neighborhoods and the feeling of well-being they provide. In large cities, the neighborhoods strongly differ in the quality of their planning and ar-chitecture, in their public spaces, in their amenities and leisure opportunities, commercial fabric, in their safety. Additionally, the changes might be considered as problematic, since a profound spatial reorganiza-tion of shopping mobility in the city could have con-sequences on the spatial structure of employment in the first place (see Figure S7in Appendix), and then
on residences. For the sake of simplicity we considered none of these factors, but they could be implemented in more involved frameworks derived from our work.
Concluding remarks
There are recent, encouraging examples of fast and wide adoptions of new daily practices, whose benefits are essentially collective. Examples include garbage differentiation [32], the increasing role of bicycle in urban transport and the development of bicycle shar-ing systems [33], or the open-source movement and the dedication of a growing number of individuals to collectively build free knowledge databases (e.g. Wikipedia, StackExchange, the free software move-ment). In these cases, the remuneration of partici-pants, if any, is essentially symbolic. The success of a spatial counterpart to these altruistic behaviors could rejuvenate the meaning of the so-called sharing econ-omy [21]. As citizens produce the data that document their location and activity patterns, in return these data could serve not only the specific interest of the institution collecting them, but also support fair socio-economic initiatives. This study brings evidence that these geographical footprints we passively produce can support bottom-up responses to big societal issues, an expected feature of truly smart cities.
METHODS
Estimation of shopping trips distances.
We made the assumption that to each transaction is implicitly associated a trip originating from either the main activity neighborhood during working time, or the neighborhood of residence, depending on the hour of the day and day of the week (see the Appendix for more details). The shopping trip distance is then the Euclidean distance between the centroids of the origin and destination neighborhoods.
Variables considered when redirecting the shopping trips
The primary objective when rewiring the shopping mobility networks is to even the distribution of com-mercial income among the neighborhoods (here zip-codes), while respecting a set of constraints to en-sure that the alternative networks produced are rea-sonable, and possess interesting properties.
We denote by W the wealth inequality among a city’s neighborhoods. It is defined as the distance to a reference egalitarian situation, where the commercial income resulting from individual purchases would be equally shared among all neighborhoods in average. More specifically, the level Wk of wealth inequality
af-ter k rewiring operations is
Wk=
N
∑
i=1
(wik−w∗)2, (1)
where N is the number of neighborhoods, wik is the average income of businesses located in neighborhood i after k rewiring operations, and w∗ represents the
wealth per neighborhood in the reference configura-tion where commercial income is evenly distributed across neighborhoods, such that
w∗ = 1 N N ∑ i=1 wik. (2)
An important aspect of individuals mobility in the city is to prevent some neighborhoods from ghettoiza-tion. To measure to what extent individuals residing in various neighborhoods mix in the city space as a result of their displacements, for each neighborhood i we count the number of times (si1
k, ..., s iN
k ) the
resi-dents of i traveled to each of the N neighborhoods (i included), after k rewiring operations. Then, by av-eraging the vector of trips over all the neighborhoods, we compute the geographical diversity index Sk
ob-tained after k rewiring operations,
Sk= 1 N N ∑ i=1 N ∑ j=1 (sijk −s∗i)2, (3) where s∗
i represents the homogeneous distribution
of visits originating from i and in direction to all neigh-borhoods, s∗ i = 1 N N ∑ j=1 sijk. (4)
The third aspect we want to control is the distance traveled by individuals. For obvious reasons it is de-sirable that the total travel distance does not increase. Summing the distances traveled by individuals for all their shopping trips, we can compute Dkthe total
dis-tance measured on the network after rewiring k trans-actions.
Finally, in order to preserve individual mobility rou-tines and the tendency of individuals to return to al-ready visited places, for each individual we calculated the exploration rate ρk. It is defined as the
num-ber of unique businesses he/she has visited divided by his/her total number of transactions, after k rewiring operations. Considering the empirical peaked distri-bution of ρk among the population of customers, in
the following we consider the mean value ¯ρk.
Rewiring constraints
The rewiring experiments can be formalized as a constraint satisfaction problem (CSP) over a spatial
bipartite network. We consider four constraints, each of them concerns one of the variables mentionned in the previous section, and quantifying an important aspect of shopping mobility:
• Constraint CW applies on the wealth
distribu-tion; it ensures that each destination change contributes to homogenize the distribution of commercial income across neighborhoods. • CS, a constraint on the spatial mixing of
indi-viduals, resulting from their shopping trips. To be accepted, a rewiring operation has to preserve the diversity of neighborhoods visited, hence the degree of spatial mixing of individuals residing in different neighborhoods.
• CD, a constraint on the total distance traveled,
to guarantee that each destination change does not result in increasing the total distance trav-eled. The distance associated to each individual transaction is calculated with regard to the in-dividual’s main activity place at this moment of the day (see section above for details).
• Cρ¯, a constraint on the spatial exploration rate
of individuals, to preserve the behavioral mobil-ity routines measured in the population.
All constrains have the same form: constraint CX
is satisfied if the following condition holds
Xk+1≤ ⎧ ⎪ ⎪ ⎨ ⎪ ⎪ ⎩ Xk if Xk+1≥αX0, αX0 otherwise, (5)
where k denotes the number of rewiring operation, and α is a parameter positive or equal to zero. Equa-tion 5 allows to fix the objective upper bound for each variable X with respect to its empirical value X0. While X is greater than αX0, each rewiring
op-eration must decrease X. Once X is smaller than αX0, Equation 5 ensures that none of the following
rewiring operations will increase X above this value. An experiment is then defined by a set of four val-ues (αW, αS, αD, αρ¯)that specify the desired maximal value for each of the four dimensions of interest.
We favored a numerical approach because of the large number of transactions (∼ 107) and because of the constraints imposed to guarantee that the simu-lated networks possess realistic and interesting prop-erties.
ACKNOWLEDGEMENTS
We wish to thank Julie Vall´ee and Suma Desu for providing feedback on an early version of the manuscript. We also thank Jean-Loup Guillaume for fruitful discussions on the rewiring problem. Partial financial support has been received from the Spanish Ministry of Economy (MINECO) and FEDER (EU) under the project INTENSE@COSYP (FIS2012-30634), and from the EU Commission through projects EUNOIA and INSIGHT. The work of TL has been funded under the PD/004/2015, from the Conselleria de Educaci´on, Cultura y Universidades of the Government of the Balearic Islands and from the European Social Fund through the Balearic Is-lands ESF operational program for 2013-2017. JJR acknowledges funding from the Ram´on y Cajal pro-gram of MINECO.
[1] T. Piketty. Capital in the Twenty-First Century. Har-vard University Press, Cambridge, MA, USA, 2014. [2] J. E. Stiglitz. The Great Divide: Unequal Societies
and What We Can Do About Them. W. W. Norton & Company, New York, 1 edition edition, 2015. [3] J.-L. Pinol. Histoire de l’Europe urbaine. Seuil, Paris,
France, 2003.
[4] W. Goldsmith, E. J. Blakely, and B. Clinton. Separate Societies: Poverty and Inequality in U.S. Cities, 2nd Edition. Temple University Press, Philadelphia, Pa, 2nd edition edition, 2010.
[5] T. Cassiers and C. Kesteloot. Socio-spatial Inequal-ities and Social Cohesion in European CInequal-ities. Urban Studies, 49(9):1909–1924, 2012.
[6] UN-HABITAT. State of African Cities Re-imagining sustainable urban transitions. State of Cities - Re-gional Reports. UN-Habitat, 2014.
[7] J. Friedrichs, G. Galster, and S. Musterd. Neighbour-hood effects on social opportunities: the European and American research and policy context. Housing Studies, 18(6):797–806, 2003.
[8] Judith R. Blau and Peter M. Blau. Cost of Inequality -Metropolitan Structure and Violent Crime. American Sociological Review, 47:114–129, 1982.
[9] Jeanne Brooks-Gunn, Greg Duncan, and J. Lawrence Aber, editors. Neighborhood Poverty, Volume 1: Con-text and Consequences for Children. Russell Sage Foundation, New York, 1997.
[10] J. Vall´ee, E. Cadot, F. Grillo, I. Parizot, and P. Chau-vin. The combined effects of activity space and neigh-bourhood of residence on participation in preventive health-care activities: The case of cervical screening in the Paris metropolitan area (France). Health & Place, 16(5):838–852, 2010.
[11] B. Womack. Across 110th street. 1972.
[12] R. Chetty and N. Hendren. The Impacts of Neigh-borhoods on Intergenerational Mobility: Childhood Exposure Effects and County-Level Estimates. Tech-nical report, Harvard Univ. Dept. of Economics, 2015. [13] K. Lewis. Three fallacies of digital footprints. Big
Data & Society, 2(2):2053951715602496, 2015. [14] Y.-A. de Montjoye, L. Radaelli, V. K. Singh, and
reidentifiability of credit card metadata. Science, 347(6221):536–539, 2015.
[15] D. Lazer, A. Pentland, L. Adamic, S. Aral, A.-L. Barab´asi, D. Brewer, N. Christakis, N. Contractor, J. Fowler, M. Gutmann, T. Jebara, G. King, M. Macy, D. Roy, and M. V. Alstyne. Computational Social Sci-ence. Science, 323(5915):721–723, 2009.
[16] N. Eagle, M. Macy, and R. Claxton. Network Diversity and Economic Development. Science, 328(5981):1029–1031, 2010.
[17] J.-P. Onnela, J. Saram¨aki, J. Hyv¨onen, G. Szab´o, D. Lazer, K. Kaski, J. Kert´esz, and A.-L. Barab´asi. Structure and tie strengths in mobile communication networks. Proceedings of the National Academy of Sci-ences, 104(18):7332–7336, 2007.
[18] X. Lu, L. Bengtsson, and P. Holme. Predictability of population displacement after the 2010 Haiti earth-quake. Proceedings of the National Academy of Sci-ences, 109(29):11576–11581, 2012.
[19] L. Sun, K. W. Axhausen, D.-H. Lee, and X. Huang. Understanding metropolitan patterns of daily encoun-ters. Proceedings of the National Academy of Sciences, 110(34):13774–13779, 2013.
[20] M. C. Gonz´alez, C. A. Hidalgo, and A.-L. Barab´asi. Understanding individual human mobility patterns. Nature, 453(7196):779–782, 2008.
[21] D. McLaren and J. Agyeman. Sharing Cities: A Case for Truly Smart and Sustainable Cities. Urban and In-dustrial Environments. MIT Press, Cambridge, MA, USA, 2015.
[22] W. Ostendorf, S. Musterd, and S. De Vos. Social Mix and the Neighbourhood Effect. Policy Ambitions and Empirical Evidence. Housing Studies, 16(3):371–380, 2001.
[23] D. Satterthwaite and D. Mitlin. Reducing Urban Poverty in the Global South. Routledge, London ; New York, 2013.
[24] R. Kanbur and A. J. Venables. Spatial Inequality and Development. Oxford University Press, 2005. [25] The American Association of State Highways and
Transportation Officials (AASHTO). Commuting in
America 2013, the national report on commuting pat-terns and trends. Technical report.
[26] K. Miciukiewicz and G. Vigar. Mobility and Social Cohesion in the Splintered City: Challenging Techno-centric Transport Research and Policy-making Prac-tices. Urban Studies, 49(9):1941–1957, 2012.
[27] J.-F. Ruault. L’effet de la consommation de passage sur le d´eveloppement et l’int´egration m´etropolitaine des territoires en Ile-de-France. Paris Est, 2014. [28] M. Lenormand, T. Louail, O. G. Cant´u-Ros, M.
Pi-cornell, R. Herranz, J. Murillo Arias, M. Barthelemy, M. San Miguel, and J. J. Ramasco. Influence of so-ciodemographics on human mobility. Scientific Re-ports, 5:10075, 2015.
[29] W. W. Recker and L. P. Kostyniuk. Factors influenc-ing destination choice for the urban grocery shoppinfluenc-ing trip. Transportation, 7(1):19–33, 1978.
[30] R. Gallotti, A. Bazzani, S. Rambaldi, and M. Barthelemy. A stochastic model of randomly accel-erated walkers for human mobility. arXiv:1509.03752 [cond-mat, physics:physics], 2015.
[31] C. M. Schneider, V. Belik, T. Couronn´e, Z. Smoreda, and M. C. Gonz´alez. Unravelling daily human mo-bility motifs. Journal of The Royal Society Interface, 10(84):20130246, 2013.
[32] G. M. Robinson and A. D. Read. Recycling behaviour in a London Borough: Results from large-scale house-hold surveys. Resources, Conservation and Recycling, 45(1):70–83, 2005.
[33] J. Dill and T. Carr. Bicycle Commuting and Fa-cilities in Major U.S. Cities: If You Build Them, Commuters Will Use Them. Transportation Re-search Record: Journal of the Transportation Re-search Board, 1828:116–123, 2003.
[34] Instituto Nacional de Estadstica (National Institute for Statistics). Available: http://www.ine.es. Ac-cessed 2016 April 26.
APPENDIX Data preprocessing
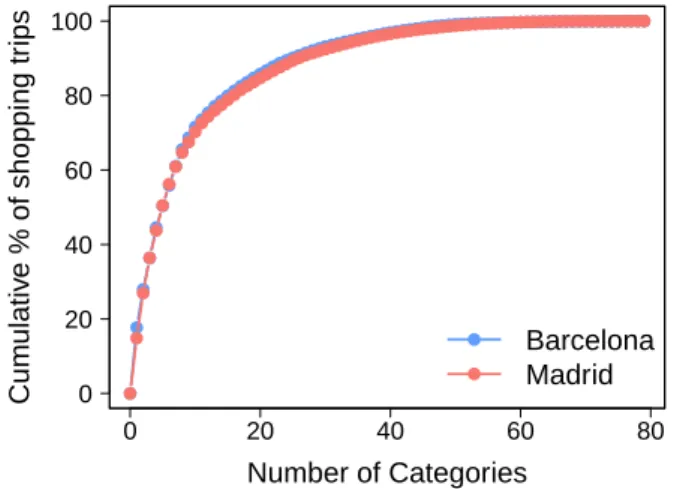
The dataset contains information about 14 mil-lion bank card transactions made by customers of the Banco Bilbao Vizcaya Argentaria (BBVA) in the metropolitan areas of Barcelona and Madrid in 2011. For both case studies, we only consider the credit card payments whose amount was inferior to 1000 eu-ros, and which were made inside the metropolitan ar-eas, by bank customers that lived and worked in the metropolitan area in 2011. Each transaction is charac-terized by its amount (in euro currency) and the time when the transaction has occurred. Each transaction is also linked to a customer and a business. Customers are identified with an anonymized customer ID, con-nected with sociodemographic characteristics (gender, age and occupation) and their postcode of residence. In the same way, businesses are identified through an anonymized business ID, a business category id, and the geographical coordinates of the credit card terminal. Since we are primarily interested in daily shopping mobility, we chose to consider the business categories that account for the top 90% of the daily shopping trips (see Figure S1). The proportions of shopping trips associated to each of the 20 business categories we selected are available in Table S1.
● ● ● ● ● ● ● ●● ●●● ●●●● ●●●●● ●●●●●●● ●●●●●●●●●●●●●●●●●●●●●●●● ●●●●●●●●●●●●●●●●●●●●●●●●●●●● 0 20 40 60 80 0 20 40 60 80 100 ● ● ● ● ● ● ●● ●● ●●● ●●●● ●●●●●● ●●●●●●●● ●●●●●●●●●●●●●●● ●●●●●●●●●●●●●●●●●●●●●●●●●●●●●●●●●● Number of Categories Cum ulativ e % of shopping tr ips ● ● Barcelona Madrid
Figure S1. Cumulative proportion of shopping trips as a function of the number of categories. In blue the metropolitan area of Barcelona; In red the one of Madrid
Formal description of the rewiring process
From the data we extract G(R, B, T ) the bipartite network of all credit card transactions performed by the city residents in businesses located in the city, dur-ing the entire year. R is the set of residents, B the set of businesses and T the set of transactions. Table S2
contains the characteristic attributes of the network in the two cities studied. Each city is partitioned in
Table S1. Proportion of shopping trips associated to each of the 20 business categories selected.
Category Barcelona Madrid
Supermarket 17.71 14.84
Hypermarket 10.25 12.09
Gas Stations 8.41 9.49
Restaurants 8.20 6.73
Retail store 5.84 2.82
Clothing store chain 5.48 4.67
Clothing store 5.16 7.33
Pharmacy, optical and orthopedics 4.52 3.81
Department store 3.14 5.73
Hair and beauty 2.88 2.72
Electronics, computers and appliances 1.97 1.44
Bars and caf´e 1.85 1.60
Shoe store 1.71 1.43
Toys and sports articles 1.43 1.33 Bookshop, music shop and stationery 1.42 1.04 Fast food restaurants and chains 1.13 2.38 Car dealership and garage 1.02 1.01
Bazaar 1.01 1.06
DIY store 0.99 1.08
Hospitals, clinics and doctors 0.91 0.88
N spatial units/neighborhoods (here the units corre-spond to zip codes) and the network G is spatial: each resident and each business is located in one neighbor-hood. We denote Ri (resp. Bi) the set of residents
(resp. businesses) located in the neighborhood i. The sets are disjointed and we have R = ⊍Riand B = ⊍Bi,
with i ∈ 1..N . Additionally the businesses are also partitioned in C categories according to the products they sell, and we have B = ⊍Bc, c ∈ 1..C. The edges
of the network represent the card transactions, hence implicitly the shopping trips. We note tkr,b the k-th transaction performed by resident r in business b, and by w(tkr,b)its amount.
Table S2. Summary statistics of the two metropolitan areas and of the two transactions networks.
Statistics Barcelona Madrid
Number of neighborhoods 97 123 Number of inhabitants (2009) 3,218,071 5,512,495 Area (km2) 634 1,935 Number of customers 42,023 118,447 Number of businesses 40,618 55,148 Number of transactions 3,640,961 10,025,642
The rewiring methods we implemented operate di-rectly at the micro scale of the individual transactions, and each rewiring operation tr,b→tr,b′ consists in
se-Residents
Businesses
t1,1 1 t1,1 2 k-th transaction/ shopping trip performed by resident r in business b Neighbourhoods delimitations Various categories of businesses tr,b kFigure S2. The bipartite network of transactions.
lecting a business b′
≠b, such than b′and b are of the same category c but are located in different neighbor-hoods. The rewiring occurs only if b′fulfills a number
of additional constraints (namely CW, CD, CS and
Cρ) which are expressed at the macro-scale of the
en-tire city.
The network is rewired iteratively, i.e. transaction per transaction. A transaction tr,b is picked up
ran-domly (uniform or weighted sampling, as described in the main text). A neighborhood is chosen among the set of all neighborhoods that contain some busi-nesses b′of the same category than b. Both the
trans-action and the candidate business can be picked up through a uniform or weighted random sampling. Fi-nally, if the neighborhood change j → j′ matches the
four constraints, then the transaction/edge is rewired. The process stops when the rewiring rate falls below 0.001.
Estimation of shopping trips distances and identification of the users’ main daytime activity
location
We made the assumption that to each transaction is implicitly associated a trip originating from either the main activity neighborhood during working time, or the neighborhood of residence, depending on the hour of the day and day of the week. The shopping trip distance is then defined as the Euclidean distance between the centroids of the origin and destination neighborhoods.
We already know the neighborhood of residence that we can assign as the place of main activity during night time (i.e between 7pm and 8am) on week days and Saturday and Sunday. In addition to the neigh-borhood of residence, for each individual we can deter-mine the neighborhood in which he/she was the most frequently located during the typical working hours of
working days, i.e. from 8pm to 7am, from Monday to Friday.
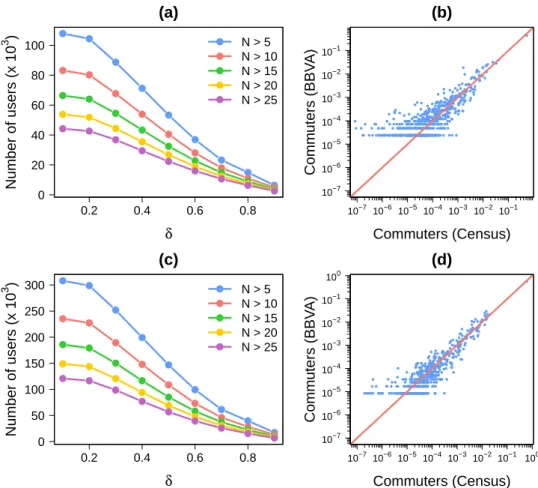
To do so, for each individual we count the num-ber of unique couples (day, hour) during which he/she was located in each neighborhood. For our study we keep only the individuals for which credit card is a casual mode of payment, and for which we can then reasonably assume that their card purchases and cor-responding shopping trips are representative of their shopping mobility in general. Regarding the avail-able statistics for Spain on the share of credit card payments among all payments, we decided to keep in-dividuals whose data displayed at least N = 20 unique couples (day, hour) during the entire year. For each of these individuals, we then determine the neighbor-hood in which they were the most frequently located during typical working hours. If this neighborhood accounted for less than one third of the time δ = 1/3 in his/her entire set of locations, then the individual is discarded. As it can be seen in Figure S3a and Fig-ure S3c, the couple of value (N, δ) = (20, 1/3) allow us to keep enough users and discard the users not show-ing enough regularity to estimate their main daytime activity location.
Finally, we can estimate the commuting flows be-tween neighborhoods and assess the accuracy of the results by comparing these flows with those ob-tained from the 2011 Spanish census in Barcelona and Madrid [34]. The census data is at the municipal level, which implies that the neighborhoods must be aggre-gated at the municipality scale to be able to perform the comparative analysis. Figure S3b and Figure S3d show a scattered plot with the comparison between the flows obtained with the two matrices. A good agreement between the two ODs is obtained.
The source code of this method is available
at https://github.com/maximelenormand/
0.2 0.4 0.6 0.8 0 20 40 60 80 100 δ Number of users (x 10 3 ) N > 5 N > 10 N > 15 N > 20 N > 25
(a)
10−7 10−6 10−5 10−4 10−3 10−2 10−1 10−7 10−6 10−5 10−4 10−3 10−2 10−1 Commuters (Census) Comm uters (BBV A)(b)
0.2 0.4 0.6 0.8 0 50 100 150 200 250 300 δ Number of users (x 10 3 ) N > 5 N > 10 N > 15 N > 20 N > 25(c)
10−7 10−6 10−5 10−4 10−3 10−2 10−1 100 10−7 10−6 10−5 10−4 10−3 10−2 10−1 100 Commuters (Census) Comm uters (BBV A)(d)
Figure S3. Identification of the users’ main daytime activity location in Barcelona ((a)-(b)) and Madrid ((c)-(d)). (a) and (c) Number of users according to N and δ. (b) and (d) Comparison between the non-zero flows obtained with the credit card dataset ((N, δ) = (20, 1/3)) and the census data. The values have been aggregated at the municipality scale. The values have been normalized by the total number of commuters for both OD tables. Blue points are scatter plot for each pair of municipalities. The red line represents the x = y line.
SUPPLEMENTARY FIGURES 1 2 3 4 1 2 3 4 5 6 7 8 9 10
Replication
d
(km)
(a)
0.2 0.3 0.4 0.5 1 2 3 4 5 6 7 8 9 10Replication
ρ
(b)
0 2 4 6 8 1 2 3 4 5 6 7 8 9 10Replication
∆
r
(km)
(c)
2 3 4 5 1 2 3 4 5 6 7 8 9 10Replication
r
g
(km)
(d)
Figure S4. Individual human mobility indicators’ distributions obtained with ten replications of the algorithm. (a) Individual average distance traveled ¯d. (b) Exploration rate ρ. (c) Jump length distribution ∆r. (d) Radius of gyration rg. The boxplot is composed of the first decile, the lower hinge, the median, the upper hinge and the 9thdecile.
0 20 40 60 80 100 0.000 0.005 0.010 0.015 0.020 0.025 0.030
Percentage of Transactions
(a)
0 20 40 60 80 100 0.000 0.005 0.010 0.015 0.020 0.025 0.030Percentage of Transactions
(b)
Men Women 0 20 40 60 80 100 0.00 0.01 0.02 0.03 0.04Percentage of Transactions
(c)
]15,30] ]30,45] ]45,60] ]60,75] >75 0 20 40 60 80 100 0.000 0.005 0.010 0.015 0.020 0.025 0.030 0.035Percentage of Transactions
(d)
Student Unemployed Employed Homemaker RetiredFigure S5. Probability density functions of the individual percentage of rewired transactions. (a) Total. (b) By Gender. (c) By age. (d) By occupation.
0 5 10 15 20 25 0.0 0.5 1.0 1.5 2.0 2.5
Number of rewiring operations (x 10
5)
X
kX
0 (a) W S D ρ 0 20 40 60 80 100 0 1 2 3 4 5Number of rewiring operations (x 10
5)
X
kX
0 (b) W S D ρ 0 10 20 30 40 0.0 0.5 1.0 1.5 2.0 2.5Number of rewiring operations (x 10
5)
X
kX
0 (c) W S D ρ 0 2000 4000 6000 8000 10000 0.0 0.5 1.0 1.5 2.0 2.5 3.0Number of rewiring operations (x 10
5)
X
kX
0(d)
W S D ρ
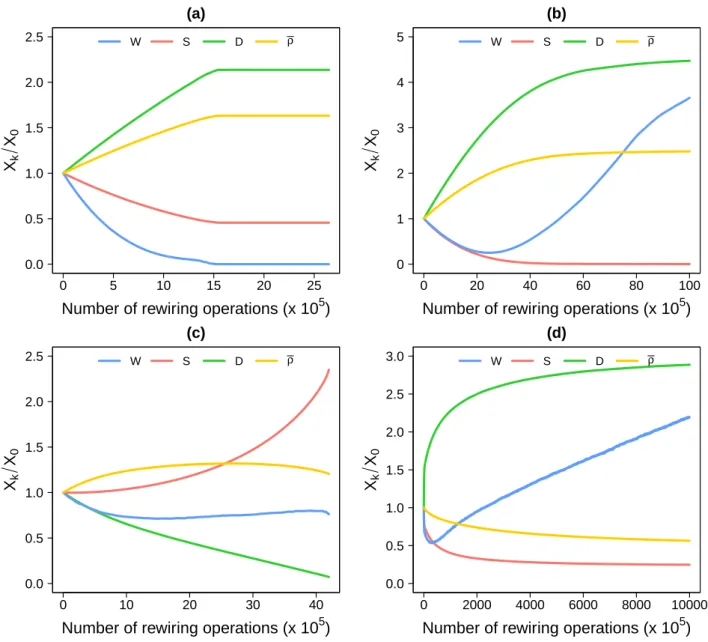
Figure S6. Evolution of W, S, D and ¯ρ as a function of the number of rewiring transactions. (a) (αW, αS, αD, αρ¯) = (0, +∞, +∞, +∞). (b) (αW, αS, αD, αρ¯) = (+∞, 0, +∞, +∞). (c) (αW, αS, αD, αρ¯) = (+∞, +∞, 0, +∞). (d) (αW, αS, αD, αρ¯) = (+∞, +∞, +∞, 0).
0 1000 2000 3000 4000 5000 0e+00 2e−04 4e−04 6e−04 8e−04 1e−03
Amount of money spent (euro)
(a)
Before
After
0 1000 2000 3000 4000 5000 1 2 3 4 5 6 7 8 9 10Replication
Amount of mone
y spent (euro)
(b)
Figure S7. Probability density functions of the total amount of money spent by business in 2011, in Barcelona. (a) Comparison between the original distribution and the one obtained after applying the rewiring algorithm. (b) Distributions obtained with ten replications of the algorithm. The boxplot is composed of the first decile, the lower hinge, the median, the upper hinge and the 9thdecile.
0 5 10 15 20 0.00 0.05 0.10 0.15 0.20
d (km)
(a)
0.0 0.2 0.4 0.6 0.8 1.0 0.0 0.5 1.0 1.5 2.0 2.5 3.0ρ
(b)
∆
r(km)
P
(
∆
r)
100 101 102 10−9 10−8 10−7 10−6 10−5 10−4 10−3 10−2 10−1 100(c)
Original
Rewired
r
g(km)
P
(
r
g)
100 101 102 10−6 10−5 10−4 10−3 10−2 10−1 100(d)
Figure S8. Observed and simulated distributions of human mobility indicators in Madrid. The distribution of jump lengths ∆r, the radius of gyration rg, the tendency to return to already visited places (ρ) and the individual average distance traveled ( ¯d) are considered. Values measured on the empirical data are in blue, while those obtained after rewiring are in red. The calculation of ∆r and rg is based on the business’ exact geographical coordinates.
0
10
20
30
40
0.0
0.2
0.4
0.6
0.8
1.0
Percentage of rewired transactions
W
W
0
Uniform−Uniform
Uniform−Weighted
Weighted−Uniform
Weighted−Weighted
Figure S9. Decrease of wealth inequality among neighborhoods as a function of the fraction of transactions rewired, for various heuristics (Madrid). Four heuristics are considered, ”Uniform-Uniform”, ”Uniform-Weighted”, ”Weighted-Uniform” and ”Weighted-Weighted”.
0
50
100
150
200
0.0
0.2
0.4
0.6
0.8
1.0
Number of rewiring operations (x 10
5
)
X
k
X
0
W
S
D
ρ
Figure S10. Decrease of wealth inequality (W /W0) while preserving the spatial mixing index (S/S0), the distance traveled (D/D0) and the exploration rate ( ¯ρ/ ¯ρ0) as a function of the number of rewiring operations (Madrid case). Values have been averaged over hundreds of replications. The bars represent the minimum and the maximum values obtained but in most cases they are too close to the average to be seen.
−0.5 −0.25 0 0.25 0.5 0.75 1 (a) (b) (c) (d) (e) (f)
(
X0 − X∞)
X0 W S D ρFigure S11. Multi-criteria improvement of shopping mobility in the city of Madrid. Each group of bars gives the relative gains or losses for the four indicators W , S, D and ¯ρ.