ANALYSIS AND DESIGN OF
HOUSEHOLD RAINWATER CATCHMENT SYSTEMS
FOR RURAL RWANDA
By
Daria Cresti
Diploma di Specializzazione in Architettura dei Giardini e Progettazione del Paesaggio Universiti di Firenze, Italy, 2005
Laurea in Architettura Universiti di Firenze, Italy, 1999
Submitted to the Department of Civil and Environmental Engineering In Partial Fulfilment of the Requirements for the Degree of
MASTER OF ENGINEERING IN CIVIL AND ENVIRONMENTAL ENGINEERING at the
MASSACHUSETTS INSTITUTE OF TECHNOLOGY June 2007
© 2007 Daria Cresti All rights reserved
The author hereby grants to MIT permission to reproduce and distribute publicly paper and electronic copies of this thesis document in whole or in part
in any medium now known or hereafter created.
Signature of the Author...
Crtified b~
/11
... Department of Civil and Environmental EngineeringMay 11, 2007
... ...
Peter Shanahan Senior Lecturer, Department of CPi l and Environmental Engineering Thesis Supervisor Accepted by... MASSACHUSETTS INSTI E OF TECHNOLOGY Chairman
JUN 0
7
2007
Daniele Veneziano Departmental Committee for Graduate Students-y
. . ... . . .... .... ... IAnalysis and Design of Household Rainwater Catchment Systems
for Rural Rwanda
by
Daria Cresti
Submitted to the Department of Civil and Environmental Engineering on May 11, 2007 in partial fulfilment of the requirements for the Degree of Master of Engineering in Civil and Environmental Engineering
ABSTRACT
The Dian Fossey Gorilla Fund International (DFGFI) contacted MIT in September 2006 for technical assistance to analyze the water-supply potential within the Bisate Sector, Musanze District, Rwanda.
The present study focuses on designing low-cost household rainwater catchment systems to improve the quantity and quality of water available and therefore achieve higher standards of living for the Bisate village. Given the climatic and geographic characteristics of Bisate, rainwater harvesting represents one of the most appropriate solutions to improve water supply. The designed low-cost household rainwater catchment system consists of an excavated cistern of 6 cubic meters volume, lined with a plastic tarpaulin sheet and covered with a wood and iron lid, and with a hand pump to extract water. The cistern should provide an average of 16 liters/day/person for the entire year for medium-size houses (roof area of 35 M2) and 21.5
liters/day/person for large-size houses (82 in2). The excavated cistern is designed with walls to stop surface runoff from entering into the cistern, and a hard cover and hand pump to extract water and minimize water contamination from faecal bacteria.
The implementation of these small-scale rainwater harvesting systems should improve water quality and supply for the families of Bisate Village. Indeed, household rainwater catchment systems should improve water consumption from less than 5 liters/day/person to at least 16 liters/day/person.
The household rainwater catchment system can provide water inside or nearby the house, which is very important as it would drastically reduce travel time for women and children to fetch water. Freeing up time from daily "water walks" could significantly improve school attendance and trade activities, leading to increased education levels and average annual income.
Thesis Supervisor: Peter Shanahan
ACKNOWLEDGEMENTS
My family -always supporting my decisions
Prof. Eric Adams and Patricia Glidden -for making this experience possible
Prof. Peter Shanahan -for offering advice and support during the MEng program and Rwandan experience
Prof. Alicia Lilly and DFGFI -for the incredible and unforgettable opportunity Karisoke Research Center -for its assistance and support in Rwanda
Jean Pierre Nshimyimana -Murakoze cyane -for the precious assistance and friendship! Laura Clauson -for her invaluable hospitality and enjoyable atmosphere
A particular thanks to Kiki and Kelly -it's been wonderful experiencing Rwanda together, sharing unforgettable emotions that strengthen our bond.
TABLE OF CONTENTS
LIST OF FIG URES...9
LIST OF TABLES ... 11
1. INTRODUCTION ... 12
1.1. DIAN FOSSEY GORILLA FUND INTERNATIONAL...12
1.2. RW ANDA ... 13
1.3. VOLCANO ES NATIONAL PARK ... 14
1.3.1. HISTORY AND ADMINISTRATION ... 14
1.3.2. PHYSICAL CHARACTERISTICS...15
1.3.3. BIoTIC CHARACTERISTICS ... 16
1.3.4. DEMOGRAPHIC PARAMETERS AND EDUCATION... 18
1.3.5. ECONOMY AND EMPLOYMENT ... 19
1.3 .6 .W A TER ISSU E...20
1.3.6.1. W ater distribution ... 20
1.3.6.2. Social Water Issues... 20
1.4 . T HESIS O BJECTIV ES ... 2 1 2. SURVEY OF THE WATER SOURCES IN BISATE VILLAGE...22
2.1. BISATE VILLAGE INTRODUCTION...22
2 .1.1. G EN ERA LITIES ... 22
2.1.2. POPULATION HEALTH CONDITION ... 25
2.2. BISATE W ATER SUPPLY ... 25
2 .2 .1. T A P W A TER ... 25
2.2.2. COMMUNITY TANKS ... 28
2.2.3. SMALL SCALE WATER SUPPLY ... 29
2.2.4. SUMMARY OF BISATE VILLAGE WATER SUPPLY ... 30
2.3. EXPERIENCE IN KABATWA VILLAGE ... 30
2.4. POND W ATER QUALITY...34
2.4.1. PARAMETERS TESTED AND METHODS ... 34
2 .4 .2 .T EST RESU LTS...37
2.5. CONCLUSIO N...39
3. LOW-COST HOUSEHOLD RAINWATER HARVESTING ... 40
3.1. CO M PONENT OVERVIEW ... 41
3.1.1. CATCHMENT SURFACE ... 41
3.1.2. CONVEYANCE SYSTEM ... 42
3 .1.3 . STO R A G E ... 4 3 3.1.4 . D ELIV ERY SY STEM ... 45
3.2. W ATER QUALITY PROTECTIO N ... 46 3 .2 .1. SC REEN FILTER ... 4 7 3 .2 .2 . F IR ST FLU SH ... 4 8 3 .2 .3 . F ILTR A TIO N ... 49 3.2.4. TREATMENT OF WATER ... 50 3.3. CASE STUDIES ... 50
3.3.1 TARPAULIN TANKS, SOUTHERN UGANDA (REES 2000)...50
3.3.2. UNDERGROUND STORAGE OF RAINWATER FOR DOMESTIC USE, WESTERN UGANDA (THOMAS & M C G EEV ER 1997) ... 5 1 4. RAINFALL DATA ANALYSIS AND STORAGE SIZE CALCULATION...53
4.1. RAINW ATER SUPPLY ... 53
4 .1.1. R A IN FA LL D A TA ... 53
4.1.2. RAINFALL DATA ANALYSIS...54
4.2. W ATER DEM AND...58
4.3. RAINWATER STORAGE CALCULATION...59
4.3.1. BISATE HOUSES SURVEY ... 59
4.3.2. STORAGE CALCULATION METHODOLOGY ... 64
4.3.2.1. Dry-season demand versus rainwater supply ... 64
4.3.2.2. Mass curve analysis ... 67
4.3.2.3. G rap hical m ethod ... 70
4.3.2.4. Mass balance curve analysis ... 73
4 .3.3. C O N C LU SIO N ... 79
5. DESIGN OF LOW-COST HOUSEHOLD EXCAVATED CISTERN...81
5.1. CATCH M ENT SURFACE ... 81
5.2. CONVEYANCE SYSTEM ... 82
5 .2 .1. G U TTER S ... 82
5.2 .2 . D O W N EPIPES ... 83
5.3. STORAG E ... 84
5.3.1. CISTERN CONSTRUCTION ... 85
5.3.1. 1. D igg ing the p it ... 85
5.3.1.2. Coating with old engine oil... 87
5.3.1.3. Building the frame ... 87
5.3.1.4. Plastering the higher part of walls with mud... 88
5.3.1.5. L ining the cistern ... 88
5.3.1.6. C istern overflow ... 89
5.3.2. C ISTERN CO V ER ... 89
5.3. DELIVERY SYSTEM - HAND PUM P...91
5.4. W ATER FILTRATION ... 92
5.4.1. GRAVEL FILLED BUCKET SOLUTION...93
5.5. COST ANALYSIS OF THE HOUSEHOLD RAINWATER CATCHMENT
SYSTEM...94
5.7. SUMMARY ... 98
5.7.1. DESIGN VARIATIONS AND FUTURE WORK ... 98
5.7 .2 . C O N C LU SIO N ... 9 8 6. CONCLUSION AND RECOMMENDATIONS ... 100
6.1. CONCLUSION...100
6.2. RECOMMENDATIONS ... 100
7. R FER NCE ... 102
APPENDIX 1 - STORAGE CALCULATION METHODOLOGY ... 106
MASS CURVE ANALYSIS ... 106
GRAPHICAL METHOD...108
LIST OF FIGURES
FIGURE 1: RWANDA'S GEOGRAPHIC LOCATION IN AFRICA ... 13
FIGURE 2: VOLCANOES NATIONAL PARK LOCATION ... 15
FIGURE 3: GAHINGA AND MUHABURA VOLCANOES... 15
FIGURE 4: V EGETATION ZONES... 17
FIGURE 5: GORILLA POPULATION 1960 - 2004... 18
FIGURE 6: R OA D SY STEM ... 22
FIGURE 7: BISATE VILLAGE VIEW FROM THE CLINIC...23
F IG U R E 8: C LIN IC ... 23
FIGURE 9: PRIM ARY SCHOOL ... 24
FIGURE 10: B ISA TE C HURCH ... 24
FIGURE 11: STAND-PIPE IN THE VILLAGE CENTER...26
FIGURE 12: BUSHOKORO SOURCE IN THE PARK ... 26
FIGURE 13: STAND-PIPE ALONG THE MAIN STREET ... 27
FIGURE 14: BUNYENYERI SOURCE IN THE PARK ... 27
FIGURE 15: M ETAL SCHOOL TANK ... 28
FIGURE 16: STONE CHURCH TANK ... 28
FIGURE 17: SMALL SCALE RAINWATER HARVESTING SYSTEM...29
FIGURE 18: WOOD POND TO COLLECT RAINWATER IN BISATE ... 30
FIGURE 19: 3MTM PETRIFILM E. COLI/COLIFORM COUNT PLATES ... 35
FIGURE 20: HACH 2 1OOP PORTABLE TURBIDIMETER ... 35
FIGURE 21: POCKET PALTM CONDUCTIVITY TESTER ... 36
FIGURE 22: HACH 5 IN 1 WATER QUALITY TEST STRIP... 36
FIGURE 23: HACH NITRATE AND NITRITE TEST STRIP ... 37
FIGURE 24: HACH CHLORIDE QUANTAB@ TEST STRIP...37
FIGURE 25: PROCESS DIAGRAM OF DOMESTIC RAINWATER HARVESTING ... 40
FIGURE 26: MAIN COMPONENTS OF ROOF-WATER HARVESTING... 41
FIGURE 27: SPLASH-GUARD DEVICE...43
FIGURE 28: FIRST FLUSH FIXED VOLUME METHOD...48
FIGURE 29: FIRST FLUSH SEESAW SYSTEM ... 49
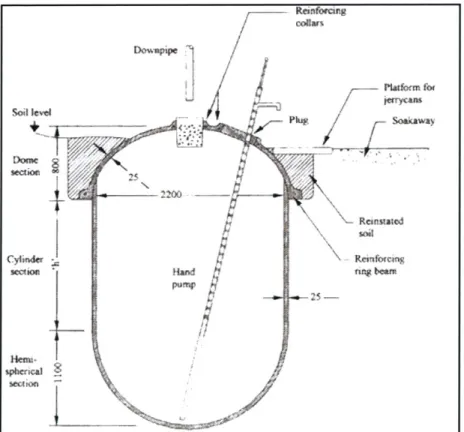
FIGURE 30: LOW-COST UNDERGROUND CISTERN WITH PUMP ... 51
FIGURE 31: BISATE - MUSANZE CORRELATION FOR THE PERIOD 1996-1997...56
FIGURE 32: BISATE - MUSANZE CORRELATION FOR YEAR 2000 ... 56
FIGURE 33: BISATE - MUSANZE CORRELATION FOR YEAR 2000 ... 57
FIGURE 34: LOCATION OF THE STATIONS...57
FIGURE 35: MID-LEVEL HOUSE IN BISATE VILLAGE ... 61
FIGURE 36: MID-LEVEL HOUSE IN BISATE VILLAGE ... 61
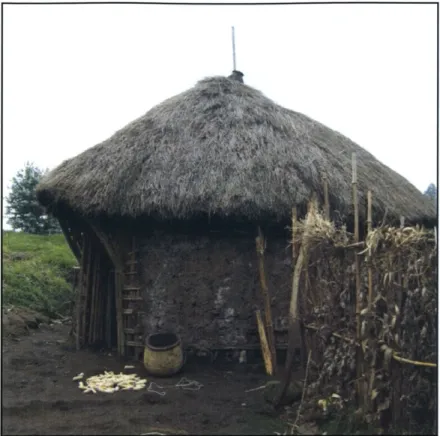
FIGURE 37: POOR-LEVEL HOUSE WITH THATCH ROOF IN BISATE VILLAGE ... 62
FIGURE 38: POOR-LEVEL HOUSE WITH BRANCH WALLS IN BISATE VILLAGE ... 62
FIGURE 39: HIGHER-LEVEL HOUSE IN BISATE VILLAGE ... 63
FIGURE 40: HIGHER-LEVEL HOUSE IN BISATE VILLAGE ... 63
FIGURE 41: MASS CURVE ANALYSIS FOR SMALL ROOF (15.4 M2) AND 10/L/D/PERSON ... 68
FIGURE 42: MASS CURVE ANALYSIS FOR MEDIUM ROOF (35.1 M2) AND 15/L/D/PERSON...69
FIGURE 43: MASS CURVE ANALYSIS FOR MEDIUM ROOF (35.1 M2) AND 20/L/D/PERSON...69
FIGURE 44: GRAPHICAL METHOD FOR MEDIUM ROOF (35.1 M2) OVER THE PERIOD 1977-2005 WITH NON CONSTANT W ATER DEM AND ... 71
FIGURE 45: GRAPHICAL METHOD FOR MEDIUM ROOF (35.1 M2) OVER THE PERIOD 1997-2005 WITH NON CONSTANT W ATER DEM AND ... 72
FIGURE 46: MASS BALANCE CURVE FOR MEDIUM ROOF (35.1 M2
), 6 M3 STORAGE, AND NON-CONSTANT
WATER DEMAND OF 20 L/D/PERSON FOR WET SEASON AND 15 L/D/PERSON FOR DRY SEASON ... 74
FIGURE 47: MASS BALANCE CURVE FOR MEDIUM ROOF (35.1 M2), 6 M3 STORAGE, AND NON-CONSTANT WATER DEMAND OF 20 L/D/PERSON FOR WET SEASON AND 10 L/D/PERSON FOR DRY SEASON ... 75
FIGURE 48: MASS BALANCE CURVE FOR MEDIUM ROOF (35.1 M2), 5.2 M3 STORAGE, AND NON-CONSTANT WATER DEMAND OF 20 L/D/PERSON FOR WET SEASON AND 10 L/D/PERSON FOR DRY SEASON ... 75
FIGURE 49: MASS BALANCE CURVE FOR MEDIUM ROOF (35.1 M2), 6 M3 STORAGE, AND NON-CONSTANT WATER DEMAND OF 22 L/D/PERSON FOR WET SEASON AND 10 L/D/PERSON FOR DRY SEASON ... 76
FIGURE 50: MASS BALANCE CURVE FOR MEDIUM ROOF (81.7 M2), 6 M3 STORAGE, AND NON-CONSTANT WATER DEMAND OF 30 L/D/PERSON FOR WET SEASON AND 13 L/D/PERSON FOR DRY SEASON ... 77
FIGURE 51: MASS BALANCE CURVE FOR MEDIUM ROOF (81.7 M2), 10 M3 STORAGE, AND NON-CONSTANT WATER DEMAND OF 40 L/D/PERSON FOR WET SEASON AND 20 L/D/PERSON FOR DRY SEASON ... 78
FIGURE 52: B ISATE IRON ROOFS...82
FIGURE 53: PVC SEMICIRCULAR GUTTERS IN BISATE VILLAGE ... 83
FIGURE 54: DIGGING THE PIT AND THE ALCOVES FOR THE WOOD POLES...86
FIGURE 55: SKETCH OF THE CISTERN PLAN VIEW... 86
FIGURE 56: COATING THE CISTERN'S WALLS WITH OLD ENGINE OIL ... 87
FIGURE 57: B UILDING THE FRAM E ... 87
FIGURE 58: SKETCH OF THE SECTION OF CISTERN WITH COVER ... 88
FIGURE 59: ILLUSTRATION OF PLASTERING WALLS WITH MUD... 88
FIGURE 60: LINING THE CISTERN WITH TARPAULIN SHEET ... 89
FIGURE 61: SKETCH OF THE COVER STRUCTURE ... 90
FIGURE 62: SKETCH OF THE SECTION OF CISTERN WITH INLET FILTER AND HAND PUMP ... 91
FIGURE 63: THE FLOATING VALVE ... 92
FIGURE 64: W ATER INLET FILTER... 93
LIST OF TABLES
TABLE 1: POPULATION DENSITY IN 2002 ... 18
TABLE 2: PERCENTAGE OF THE POPULATION ON GENDER BASIS ... 19
TABLE 3: SUPPLY SITUATION: DISTRICT OF KINIGI AND MOUNTAIN REGION ... 20
TABLE 4: SUMMARY OF BISATE WATER SOURCES ... 30
TABLE 5: KABATWA PONDS' CHARACTERISTICS AND PICTURES ... 31
TABLE 6: SUMMARY OF THE WATER QUALITY OF THE PONDS IN BISATE AND KABATWA ... 38
TABLE 7: ROOF TYPES, RUNOFF COEFFICIENT AND WATER QUALITY ... 42
TABLE 8: GUTTER SIZE AND SLOPE RELATED TO THE ROOF AREA ... 43
TABLE 9: TANK SCALE CLASSIFICATION ... 44
TABLE 10: TANKS VERSUS CISTERN ... 45
TABLE 11: H AND PUM P EXAM PLES ... 46
TABLE 12: PROS AND CONS OF TREATMENT METHODS FOR STORED WATER ... 50
TABLE 13: TARPAULIN TANK COST TABLE ... 51
TABLE 14: RAINFALL DATA FOR BISATE, MUSANZE AND KIGALI ... 54
TABLE 15: MONTHLY RAINFALL DATA [MM] OF YEARS 2000 AND 2001 FOR BISATE, MUSANZE AND K IG A L I ... 5 5 TABLE 16: PEARSON CORRELATION BETWEEN BISATE, MUSANZE AND KIGALI FOR THE YEARS 2000 AND 2 0 0 1 ... 5 5 TABLE 17: SERVICE LEVEL DESCRIPTORS OF WATER IN RELATION TO HYGIENE ... 59
TABLE 18: BISATE HOUSES' ROOF AREA [M2]...60
TABLE 19: MUSANZE MEAN MONTHLY RAINFALL DATA OF THE PERIOD 1997-2205...65
TABLE 20: AVERAGE ANNUAL RAINFALL OF MUSANZE AND BISATE...65
TABLE 21: ANNUAL WATER DEMAND AND ANNUAL WATER SUPPLY [LITERS] ... 66
TABLE 22: CONCLUSION FROM THE METHOD -DRY-SEASON DEMAND VERSUS RAINWATER SUPPLY...67
TABLE 23: CONCLUSION FROM THE METHOD - MASS CURVE ANALYSIS...70
TABLE 24: CONCLUSION FROM THE METHOD - GRAPHICAL METHOD ... 72
TABLE 25: CONCLUSION FROM THE METHOD - MASS BALANCE CURVE ANALYSIS ... 78
TABLE 26: SUMMARY OF THE PROPOSED RAINWATER CATCHMENT SYSTEMS ... 80
TABLE 27: GUTTER SHAPE, SIZE, SLOPE, LENGTH AND QUANTITY FOR MEDIUM AND LARGE ROOF ... 83
TABLE 28: DOWNPIPE SHAPE, SIZE, LENGTH, AND QUANTITY FOR MEDIUM AND LARGE ROOF...84
TABLE 29: COVER MATERIALS -DESCRIPTION, SIZE, AND QUANTITY ... 90
TABLE 30: COST OF HOUSEHOLD RAINWATER CATCHMENT SYSTEM BUILT WITH MATERIALS PURCHASED FROM M ANUFACTURERS ... 96
TABLE 31: COST OF HOUSEHOLD RAINWATER CATCHMENT SYSTEM BUILT WITH A MIX OF MATERIALS LOCALLY SOURCED AND PURCHASED... 97
TABLE 32: LOWER COST DELIVERY SYSTEM OPTION ... 98
TABLE 33: COST OF THE CISTERN BUILT WITH ITEMS PURCHASED FROM LOCAL MANUFACTURERS...99
TABLE 34: COST OF THE CISTERN BUILT WITH A MIX OF LOCALLY-SOURCED AND PURCHASED ITEMS .... 99
TABLE 35: M ASS CURVE ANALYSIS... 106
TABLE 36: GRAPHICAL METHOD - MUSANZE 1977-2005 ... 108
TABLE 37: GRAPHICAL METHOD - MUSANZE 1997-2005 ... 110
1. INTRODUCTION
The Dian Fossey Gorilla Fund International (DFGFI) contacted MIT in September 2006 for technical assistance to analyze the water-supply potential within the Bisate Sector (Musanze District, Rwanda). The DFGFI is a non-profit organization dedicated to the preservation and protection of the endangered mountain gorillas and their ecosystem, the Virunga Volcanoes Conservation Area. The mountain gorillas of the Volcanoes National Park in Rwanda are threatened by close interaction with the local Rwandan villagers. Villagers, in particular women and children, access the Volcanoes National Park on a daily basis to fetch water due to the lack of local water supply. Most of the villagers are affected by infectious diseases and parasitic worms, which contaminate the gorillas' habitat, threaten their health and eventually their existence. The DFGFI believes the implementation of a sustainable water-supply system in the villages near the Park is critical not only to improve the health and life conditions of the villagers, but also to reduce some of the main threats to the gorillas (Lilly 2006).
Portions of Sections 1.1 and 1.2 are the result of a collaborative effort of an MIT Master of Engineering project team that included the author, Christiane Zoghbi, and Kelly Doyle.
1.1. Dian Fossey Gorilla Fund International
Named after the late Dr. Dian Fossey, the Dian Fossey Gorilla Fund International (DFGFI) was created in 1978 to promote the conservation and protection of the endangered mountain gorillas in Central Africa. Through the encouragement of continued research on both the gorillas and the ecosystems in which they live (DFGFI 2006), the foundation works to keep alive Dian's strong passion and love for primates. The Fund has been instrumental in protecting the endangered mountain gorillas since Dian's tragic death in 1985. Thanks to the foundation members' efforts, the gorillas largely survived the horrors of the 1994 genocide.
Working with local communities is one of the Fund's priorities and includes both educational assistance and economic development support, including tourism. Indeed, the tourist industry continues to rely heavily on the gorillas to attract wealthy foreign tourists and increase income of this poor region.
The DFGFI supports many types of research in an effort to promote increased knowledge and maintain a culture of conservation. The research activity includes primarily: monitoring and protection of the gorillas within the Volcanoes National Park, dissemination of common monitoring procedures, collection of demographic data with the help of local universities, financial support of small-scale development activities in local communities, training of rangers and trackers, GIS data collection, and collaboration with local conservation groups (DFGFI 2006).
In the year 2000, the foundation introduced a Conservation Action Program that included community-based conservation plans, ecosystem health projects, education programs, economic initiatives, and conservation science (DFGFI 2006). With the Ecosystem Health Program, the
fund wanted to analyze and study the transmission of infectious diseases between human beings and gorillas. The foundation discovered that gorillas are highly susceptible to humans' intestinal parasitic diseases, leading to the conclusion that better health conditions for Rwandans, especially those living near the gorillas' habitat, could greatly reduce risks for that endangered species. Last year, the DGFGI-in collaboration with the Ministry of Health of Rwanda (MoH)-initiated a project to provide clean water, sanitation facilities, intestinal parasite treatments, and hygiene education to the poor people living in the rural area of the Bisate Sector (Lilly 2006).
1.2. Rwanda
Rwanda is a landlocked country in the middle of Africa (Figure 1). It borders with the Democratic Republic of Congo to the west, Uganda to the north, Tanzania to the east, and Burundi to the south. Rwanda has a unique geography, with its six volcanoes, twenty-three lakes, and rivers that feed the Nile (Govt. of Rwanda 2006). The entire nation is 26,340 square kilometers (SEARNET 2006) with 25,000 square kilometers of land area, making it only slightly larger than the state of Massachusetts. About 90% of the population works and live through subsistence farming. Kigali is the main city and capital. As with many underdeveloped countries, Rwanda has been plagued by poverty, ignorance and injustice, and not long ago went through a devastating civil war and genocide.
Figure 1: Rwanda's Geographic Location in Africa (TuTiempo 2006)
Rwanda's infamous genocide began on April 6, 1994, following the death of President Habyarimana in a controversial and mysterious airplane crash (Percival 1995). Without focusing too much on the history of Rwanda, the events that took place in the last two decades have had such a dramatic impact on the country and its current welfare that it is important to give it some consideration. The genocide of 1994 killed an estimated 800,000 people during three months of intense fighting, while twice that many were displaced to neighboring countries (DOS 2006). The genocide disrupted the entire country, leaving many people without basic needs and destroying most of the infrastructure of this small country. The magnitude of those events was such that Rwanda now defines itself in terms of pre- and post-genocide. The aftermath of the killings completely redefined the country and its goals, leaving deep scars in all aspects of Rwandan society.
About 84% of the estimated 8.6 million people living in Rwanda are Hutu, while the remaining
15% are Tutsi and a small percentage Twa. The genocide primarily targeted the Tutsi communities, a minority ethnic group, as noted above. Approximately 94% of the population considers themselves to be Christian, a likely result of the Belgian colonization, which began in
1915. As a result of sub-par health and hygiene conditions, diseases, and the rampant spread of
HIV/AIDS, Rwandans' average life expectancy is only 47 years (DOS 2006).
The current density of 320 people per square kilometer (Census 2002) makes Rwanda one of the most densely populated countries in Africa (Wikipedia 2006). Considering that most of Rwandans rely on subsistence agriculture, there is an enormous pressure on available land and the country's natural resources. Due to the disruptions suffered during the genocide, many citizens fled the cities towards rural areas. Over time, the extreme poverty, high population density, and unabated land erosion has forced people to clear more and more land in the mountains. The reduction in vegetation, the extensive farming and soil degradation further exacerbated the pre-existing serious shortage of water, especially in the northwest region of the country (Bangs 2006).
1.3. Volcanoes National Park
1.3.1. History and Administration
The origin of the Parc National des Volcans (Volcanoes National Park or PNV, Figure 2) dates back to 1925, when Rwanda was a Belgian colony under King Albert I, who created the Albert Park between Rwanda, Congo, and Uganda. A few years earlier, the American naturalist Carl Akey had discovered the mountain gorillas on the three volcanoes Mikeno, Karisimbi and Bisoke. In order to protect the gorillas and their natural habitat, King Albert I decided to create the Albert Park. In 1960, when Congo became independent from Belgium, the Albert Park became the Volcanoes National Park. When Rwanda also became independent in 1962, the Rwandan portion of the park became state property. Current preservation of the Volcanoes National Park is regulated under the Decree of 24 April 1974, under the supervision and management of the Office Rwandais du Tourisme et des Parcs Nationaux (ORTPN 2005).
According to a report published by the United Nations Environmental Program (UNEP) and the World Conservation Monitoring Centre (WCMC), the Volcanoes National Park in Rwanda is about 15 km to the northwest of Ruhengeri, in the Virunga Mountains (northwest section of Rwanda). It borders with the Democratic Republic of Congo and Uganda (10 21'-1' 35'S, 290 22'-290 44'E). (UNEO-WCMC 1985)
The PNV covers the southern portion of the Virunga Massif, and is almost 40 km long and 1 to 8 km wide. The altitude varies from 2,400m at the edge of the volcanoes to 4,507m at the highest point of Karisimbi Volcano. With its total surface of about 160 km2, the park is the smallest of
the three Rwandan parks. The surface is distributed over the two Provinces of Ruhengeri (85%) and Gisenyi (15%). (ORTPN 2005)
Pafc Natnai des *VOW-rasj
Figure 2: Volcanoes National Park location (OR TPN 2005)
1.3.2. Physical characteristics
As mentioned earlier, the Volcanoes National Park covers the south part of the Virunga Massif. The mountain chain comprises six volcanoes, five of which border with Uganda and Congo. The six volcanoes are divided into two geographical groups. The first group-in the west-includes Karisimbi (4,507 in), Bisoke (3,711 m) and Mikeno (4,437 m, in the DRC); the second
group-in the east-group-includes Sabygroup-inyo (3,634 in), Gahinga (3,434 m) and Muhabura (4,127 in), Figure 3. The two groups of volcanoes are separated by a large valley and a number of small volcanoes.
Each volcano is characterized by steep slopes, with the Sabyinyo presenting particularly steep and eroded slopes, which form deep gullies (ORTPN 2004).
Figure 3: Gahinga and Muhabura Volcanoes (Picture by Author)
4
.4
-40
The PNV is characterized by this unique volcanic region. While now considered inactive, the five volcanoes in Rwanda have greatly shaped the landscape in the past. In fact, lava covers a significant portion of rock formations and greatly contributed to a rich and fertile soil. Two volcanoes in the DRC are still active and sometimes cause seismic activities within the park area (ORTPN 2005). The Virunga Massif is a branch of the Western Rift, or Albertine Rift, which is part of the Great African Rift Valley (Wikepedia 2007).
The hydrologic system of the region is so peculiar that sometimes the volcanic mountains are also called the "chateau d'eau," or water castles (ORTPN 2004). Due to the high permeability of the volcanic soil and rocks, the abundant rain quickly infiltrates into the ground, leaving only a small amount of water to the seasonal river flows. The large amount of rainwater that infiltrates within the soil cannot provide water supply to the people living on the volcanoes' slopes. In fact, the water either flows underground or re-surfaces in a few springs inside the park and its surroundings (ORTPN 2005).
The villages near the park are located in dry areas along the volcanoes' slopes. The absence of permanent rivers and water bodies in those areas forces villagers to travel into the PNV to fetch water. Unfortunately, the water they find in the seasonal rivers is rich in sediments (very high levels of turbidity) and therefore difficult to use domestically. Also, the extensive use of land outside the park for agricultural purposes tends to exacerbate land erosion and creates additional turbidity in surface water (Gurrieri 2005).
This mountain region is characterized by a fresh-humid climate typical of high altitude areas. Compared to the rest of the country, this region has the maximum annual rainfall concentration, reaching 2,000 mm at an altitude of between 2,000 m and 3,000 m. The rainfall is not constant across the entire area. In fact, at the top of Karisimbi, the highest volcano with 4,507 m, the annual rainfall can reach 900 mm (ORTPN 2005). Above 4,000 m, snow can be found seasonally at the top of the Karisimbi volcano. Although it rains year-round, the climate of the region is defined by two major rain seasons. The first and longest is from February to June, while the second, somewhat shorter, from September to December (ORTPN 2005).
1.3.3. Biotic characteristics
The vegetation aspect is strictly related to the land morphology and the microclimatic factors of the mountain region. Generally, the vegetation of the park (Figure 4) is characterized by the typical flora of Central Africa and East African Mountains (ORTPN 2004). Five vegetation zones are present in the region, with their distribution is related to both altitude and microclimatic differences between the two volcanic groups (Karisimbi and Bisoke to the West; Sabyinyo, Gahinga and Muhabura to the East). (ORTPN 2005)
The first zone is the Neoboutonia forest, which covers the lower mountain forest between the altitudes of 2,400 m and 2,500 m. The second zone is the Arundinaria alpina (bamboo) forest, which covers the West volcanoes group from an altitude of 2,500 m to 2,800 m and the East group from 2,500 m to 3,200 m. The third zone is the Hagenia-Hypericum forest. This zone covers the most humid belt between the altitude of 2,600 m and 3,600 m. The forest of the Bisoke volcano is one of the largest Hagenia abyssinica forests in Africa (UNEP-WCMC 2007).
The fourth vegetation zone is characterized by the presence of Lobelia wollastonii, L. lanurensis,
and Senecio erici-rosenii, covering the region between 3,550 m and 4,200 m of altitude. The last
zone is the highest belt on top of the Karisimbi and Muhabura volcanoes, from 4,000 m to 4,500 m. This region is constituted by the typical alpine grassland (UNEP-WCMC 2007).
Vegetation Zones N 0 25 5 10 15 20 Kiloxrieters Vegetation zones Water Sub-Alpine Mixed Forest Mimulopsis Meadow Herbaceous Hagenia Forest Brush Ridge Bamboo Alpine
Figure 4: Vegetation Zones (Karisoke Research Center DFGFI, 2007)
In spite of the small size of the park and the relatively high altitude of the PNV, the local fauna includes a number of endemic species and sub-species. The Virunga Massif is known for the presence of mountain gorillas (Gorilla beringei beringei), golden monkeys (Cercopithecus mitis
kandti) and blue monkeys (Cercopithecus mitis stuhmani). The park herbivore species include
elephants (Loxodonta africana), buffalos (Syncerus caffer), black-fronted duikers (Cephalophus
nigrifrons) and the tree hyrax (Dendrohyrax arboreus). For carnivores, it is possible to find
hyenas (Crocuta crocuta), jackals (Canis adustus) and some small "cats". Some of the mammal species have been reduced in number over the years, while some others, like the elephant or the black-fronted duiker, continue to be main targets of poachers (ORTPN 2005). The birds are rich in species. Inside the park 294 bird species have been documented.
The Mountain Gorillas (Gorilla beringei beringei) live only in the Virunga Massif and in the Bwindi Impenetrable National Park of Uganda. The Mountain Gorilla was first sighted by a non-African on October 17, 1902, when the German Captain Oscar Von Beringei shot two animals and sent them to Europe for identification (BBC 2007). Despite this effort, the first comprehensive study was not completed until fifty years later in 1959-1960 by the scientist George Schuller. At that time, the population of gorillas was estimated at around 400-500. It is true, though, that this specie became widely popular and protected only after deeper and more analytical studies conducted by Dr. Dian Fossey.
Based on the research of the ORTPN, the change in the number of gorillas seems directly related to human activities. In fact, during the period 1960-1970, the population decreased from 400-500 to 260-290, somewhat proportional to the reduction in surface area of the National Parks in the Virunga Massif and in Uganda. When Dian Fossey began her studies on this species, she quickly realized the need for a campaign to protect and preserve the gorillas and their habitat. During the period 1980-2004, the agencies of the National Parks and several NGOs, such as DFGFI, combined their efforts to protect and preserve the gorillas and their ecosystem. The joint efforts resulted in an increase of the population from 250 to 380 animals (ORTPN 2004). Figure
5 shows the evolution in the number of gorillas during the period from 1960 to 2004.
Figure 5: Gorilla Population 1960 -2004 (OR TPN 2005)
1.3.4. Demographic parameters and education
The PNV borders the two Provinces of Ruhegeri and Gisenyi for about 60 km. These two provinces are densely populated, creating an issue of high impact from human activities to the neighboring park. Bisate Sector, the area of study, is in the Province of Ruhengeri and precisely in the District of Kinigi. Based on the Park Management Plan 2005-2009 (ORTPN 2005), the District of Kinigi had a population of 55,200 in 1991 and 62,800 in 2002. Comparing these numbers from the last two censuses, the population of the District of Kinigi increased 14% during the eleven years' period. In 2002, the population density was 390/km2 (Error! Not a valid bookmark self-reference.)
Table 1: Population density in 2002 (ORTPN 2005)
District / Total Total surface Habitable Physical Physiolo Town population area (KM2) area km2 density gical
30/08/2002 density Kg 62,7 9 8 162 110 390 570 Gorilla Population (1960 - 2004) 500 400 300-200 100 0-1960 1972 1977 1981 1986 2004 Years
According to the Park Management Plan 2005-2009 (ORTPN 2005), the structure by age of the population in the District of Kinigi is the same as in the rest of the country. The people under 30 years of age represent 70% of total population. In terms of distribution by sex, the plan shows a higher percentage of women within the population (Table 2).
Table 2: Percentage of the population on gender basis (OR TPN 2005)
District Men Women Total
Kinigi 45.2 54.8 100
Based on the Parc National des Volcans - Plan de Zonage (ORTPN 2004), the average
household has 5.1 members, with the following age distribution: 49% younger than 15, 47% between 15 and 64, and 4% older than 64 years. Therefore, more than half of household members (53%) can be considered "inactive" (ORTPN 2204).
According to the Park Management Plan 2005-2009 (ORTPN 2005), the rate of illiteracy within the District of Kinigi is 42%. Moreover, only 54% of people living in these two provinces completed primary school, 7% secondary school and 0.2% university-level degrees. One of the primary causes behind this poor situation lies in the long distances to reach the school. The study indicates that the average walking distance is about 46 minutes to primary school (1.5 km) and 1 hour 16 minutes to secondary school (3.5 km). The District of Kinigi has two secondary schools and 11 primary schools on a total surface area of 162 km2.
1.3.5. Economy and employment
The economy of the rural areas near the park is based on agriculture. In fact, 91.8% of the population is engaged in subsistence farming. Almost the entire land is cultivated, with the exception of some rocky areas. The fertile volcanic soil and the cold temperatures are favorable conditions for productive cultivations, including Irish potatoes, sorghum, beans, wheat, etc. The local population is engaged also in growing "cash crops," which include pyrethrum, tobacco, tea and coffee (ORTPN 2005).
In spite of the high land productivity and frequency of crops, the average annual income remains very low. In 2004, the District of Kinigi average annual household income was 104,196 Frw (about 190 US dollars). The reasons for this low annual income are many and include the following: first, the lack of credit, which limits the access to proper equipment and fertilizers; second, the lack of training, which does not allow improvement in agricultural methods; third, the high population growth reduces the amount of land per capita. In 2003, the average land per capita was estimated at 0.25-0.80 hectares (ORTPN 2004).
The unemployment rate is high because of the population density, the scarcity of cultivable land and low propensity to enter in non-agricultural activities-such as craftsmanship-due to the required financial help. According to the Park Management Plan 2005-2009 (ORTPN 2005), the rural people are not willing, if not scared, to approach the banks for financial assistance.
1.3.6. Water issue
1.3.6.1. Water distributionAs mentioned earlier, the mountain region has the largest annual rainfall concentration within the whole country. The surface morphology, the humid forest and the permeable volcanic soil facilitate water storage in the subsurface. However, the abundant rains infiltrate so fast that only a small amount of water is able to flow into the seasonal rivers. The water supply sources of those districts near the park tend to be located at groundwater discharge points due to the difficulty to collect surface water (Guerrieri 2005). Other than the geological reasons, the lack of water supplies reflects the poor status of the hydraulic infrastructure after the 1994 genocide, when the country was affected by social insecurity, particularly during the period of 1997-1998 (ORTPN 2004).
According to the Parc National des Volcans - Plan de Zonage (ORTPN 2004), within the region
surrounding the park only 41.3% of households have access to clean water, while 42.8% have access to alternative water sources. Half of the population living near the park has significant difficulties in fetching water. The three main concerns about accessing water are: the time spent to reach the water source, the effort to transport the water, and the threat to the gorillas and their habitat from the high human interaction. Table 3 shows the water supply situation for the District of Kinigi compared to the average situation of the Provinces of Ruhengeri and Ginsenyi and to the WHO Standards (ORTPN 2004).
Table 3: supply situation: District of Kinigi and mountain region (OR TPN 2004)
District -Region District of Kinigi Park region WHO standards*
Improved sources 1 N/A N/A
Public standpipes 50 N/A N/A
Private connections 7 N/A N/A
People with access to 40.3 42.8 0
alternative water [%] 4
Water consumption 6 6.3
20 [liters/day/capital
Distance to water sources 4.4 4.1 0.1-1
[km]
* WHO, Domestic Water Quantity, 2003
1.3.6.2. Social Water Issues
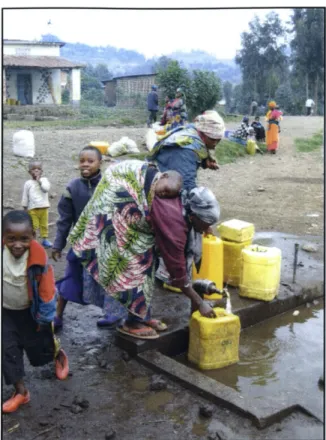
As in many developing countries, it is women's and children's responsibility to fetch water for the family's domestic needs. Residents of the Virunga Mountains' hillsides are, as already mentioned, in a region particularly scarce in water, due primarily to its geology and hydrology. The people living in this "dry zone" often spend many hours a day walking to find water
(Gurrieri 2005). Many people are trekking into the Parc National des Volcans in order to retrieve surface water. The amount of time spent to walk, find and retrieve water severely hampers the potential of women and children in the region. If alternative sources of water were secured and utilized, women and children now imprisoned by their "water walks" could attend school, work to increase family income, or have more time to spend on productive domestic tasks (DFGFI 2006). Additionally, improved water conditions would decrease the occurrence of water-borne and water-washed diseases such as diarrhea, cryptosporidium, etc. Rather than drinking contaminated water from a stream and carrying it many kilometers back to their homes, the people of Rwanda deserve at least clean water in close proximity to their homes.
1.4. Thesis objectives
The overall objective of the present study is to provide a design of low-cost household rainwater catchment systems for the rural community of Bisate Village. The household rainwater catchment system is designed to reach three primary goals: first, increasing the water quantity; second, improving the water quality; and third, improving the quality of life.
1. Improving the water quantity: household rainwater catchment systems can provide a larger amount of water to the families, improving water consumption from less than 5
liters/day/person to 15 liters/day/person;
2. Improving the water quality: household rainwater catchment systems must be covered and furnished with a hand pump to extract water, in order to reduce the possibility of faecal bacteria contamination by dirty hands and/or containers; the implementation plan must include also a hygiene education program directed to adults and children;
3. Improving the quality of life: household rainwater catchment systems can provide water inside or nearby the house, thereby drastically reducing the travel time for women and children to fetch water; freeing up time from "daily water walks" would improve school attendance and trade activities and ultimately raise the community education level and the family average annual income.
The overall objective of the present study has been pursued through the following steps: " Surveying and analyzing the existing water supply in Bisate Village and nearby areas " Reviewing the literature on small scale rainwater catchment systems
* Calculating the capacity of the rainwater storage system - Designing a household excavated cistern
- Analyzing the cost of the household rainwater catchment system " Final considerations and recommendations
2. SURVEY OF THE WATER SOURCES IN BISATE VILLAGE
2.1. Bisate Village introduction
2.1.1. Generalities
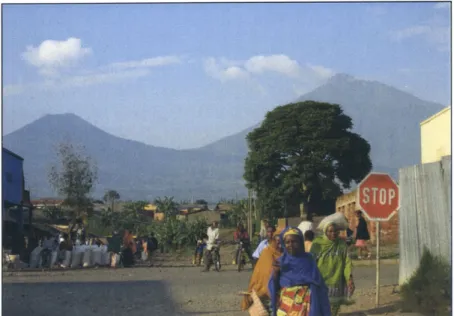
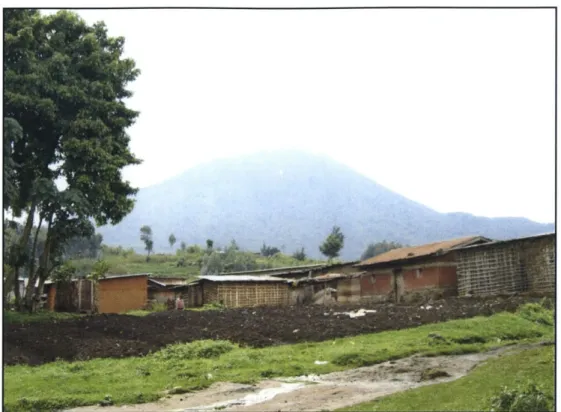
Bisate Village is located at the edge of the Bisoke volcano (Figure 7), one of the five volcanoes of the national park in the northern region of Rwanda. The village borders the national park. The village covers an area of 28.1 square kilometers and comprises two cells: Kaguhu and Bisoke. The total number of people living in the two cells is 8,364 and the total number of households is 1,860.
As shown on Figure 6, Bisate Village is located along a regional road which also includes a number of local roads. The entire road system is unpaved and, except for the main street, is
generally not well maintained.
ocanoes National Park
Bisate Villaue Volcanoes National LUgende Frontibre PNV Route nationale \ Route r6gionale /"Route locale Chemin
Figure 6: Road system (OR TPN 2004)
None of the village has electricity or a public water connection. The public buildings include a primary care clinic (Figure 8), a primary school for about 1,800 children (Figure 9), a trade center and two churches (Figure 10).
Figure 7: Bisate Village view from the Clinic (Picture by Author)
Figure 9: Primary School (Picture by Kelly Doyle)
2.1.2. Population health condition
Based on Lilly (2006), the Dian Fossey Gorilla Fund International Ecosystem Health Program affirms that 99% of the population living in Bisate Village suffers from intestinal diseases. The widespread illness weakens the population and reduces the opportunities to develop the community. In fact, intestinal parasites often lead to gastro-intestinal episodes, long hospital stays, and, ultimately, low productivity.
The principal causes of intestinal diseases include lack of water, faecal contamination in the water and absence of hygiene education. The transmission of intestinal diseases occurs mainly when fecal pathogens are ingested by people through water-borne and water-washed routes (Cairncross 2003):
" Water-borne route: transmission occurs when fecal pathogens contaminate drinking water; " Water-washed route: transmission occurs when pathogens passing through the feces of an
infected person are indirectly ingested by other persons.
The current health situation could be improved by reducing the incidence of intestinal diseases, through actions directed against those two transmission mechanisms. Specifically, improving hygiene conditions, water quality and water quantity (Cairncross 2003). First, children and adults should be introduced to specific hygiene education programs, both in school and through community-based presentations. Second, the hygiene education program should explain water disinfection and filtration. Finally, to improve water quantity it would be necessary to implement water supply systems. This study focuses on household rainwater harvesting, in the form of covered cisterns to collect water and hand pumps to extract water. This solution aims at improving water quantity for households and reducing water contamination from dirty hands and/or jerrycans.
2.2.
Bisate Water supply
During our stay in Bisate, we had the opportunity to survey the village's main water sources. In the following paragraphs, we summarize the existing situation with brief descriptions and pictures of these sources.
2.2.1. Tap water
In the entire area of the village of Bisate, there are only two public stand-pipes providing water for 8,364 people. The sources of water supply for these two stand-pipes are located inside the Volcanoes National Park and have seasonal patterns.
The first stand-pipe, shown in Figure 11, is located at the center of the village. The stand-pipe serves water only during the wet season and is alimented by a pipe coming from a large up-hill stone tank. The tank collects water from the Bushokoro source (see Figure 12), which is located inside the park. The pipe which aliments the stand-pipe is broken, causing chronic emptying of the storage tank. We had the opportunity to test water quality from the stand-pipe and we found total coliform contamination.
Figure 11: Stand-pipe in the village center (Picture by Author)
The second stand-pipe, shown in Figure 13, is located along the main street outside the center of the village. The system is alimented like the first stand-pipe, through an up-hill brick tank. The tank collects water from the Bunyenyeri source, located inside the park (Figure 14). Here again, our tests of water quality from the stand-pipe showed total coliform contamination.
A
WFigure 13: Stand-pipe along the main street (Picture by Author)
2.2.2. Community tanks
There are several rainwater tanks in the village: one metal tank at the Primary School (Figure
15), one metal tank at the Tracker House, one stone tank at the Church (Figure 16) and one stone
tank at the Trade Center. Despite the number of tanks within the village, people tend to fetch water only from the tank near the Church. Interestingly, tests of water from the various tanks showed that all tanks were contaminated with total coliform except for the stone tank near the Church.
Figure 15: Metal School Tank (Picture by Kelly Doyle)
2.2.3. Small scale water supply
While people of Bisate Village are accustomed to using only few liters of water per day and to walking long distances to fetch water, they never considered small scale rainwater harvesting systems. As mentioned in Chapter 1, in the area of the Volcanoes National Park there is considerable precipitation at about 1,500 mm/year. Surprisingly, the people of Bisate know how to use and manage rainwater for agriculture, but they never consider collecting rainwater for other purposes, such as drinking, cooking or washing.
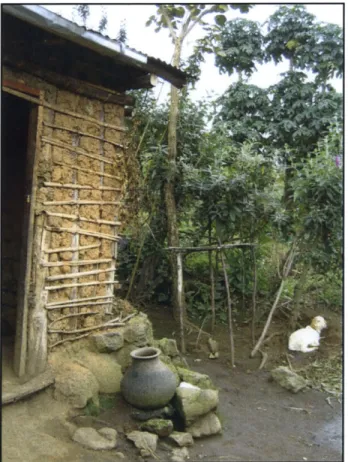
While performing the houses' survey in the village, we noticed that just two or three houses had implemented systems to collect rainwater. The simplest system observed included a very short piece of gutter attached to the roof and a small container to collect the rainwater, as shown in
Figure 17.
Figure 17: Small scale rainwater harvesting system (Picture by Author)
During the survey, we also found an outdoor wood-covered pond to collect water from nearby roofs. This relatively more sophisticated small-scale rainwater harvesting system is able to collect larger amounts of water per day per person compared to the simpler system observed above. In fact, the pond of 2.1 m length x 1.8 m width x 1.4 m depth is able to collect potentially
5,290 liters. The pond is made of wood boards, which are lined with plastic, covered with wood
tables and locked, as shown in Figure 18. We had the opportunity to test the water, which showed total coliform and E. coli contamination.
Figure 18: Wood pond to collect rainwater in Bisate (Picture by Kelly Doyle)
2.2.4. Summary of Bisate Village water supply
The main conclusion is that Bisate Village has insufficient water sources for its population. Given the existing situation, we observed that water resources are concentrated on the main street and center of the village. This situation explains why the majority of the people-who live away from the village-need to walk long distances to fetch water. In addition, these limited water sources provide poor quality water, often contaminated with faecal bacteria. The summary
of the water sources of Bisate Village is illustrated in Table 4.
Table 4: Summary of Bisate water sources
Bisate Village water sources Number Quality
Public tap water 2 100% faecal contamination
Rainwater community tanks 4 75% faecal contamination
Small rainwater harvesting system Few N/A
2.3. Experience in Kabatwa Village
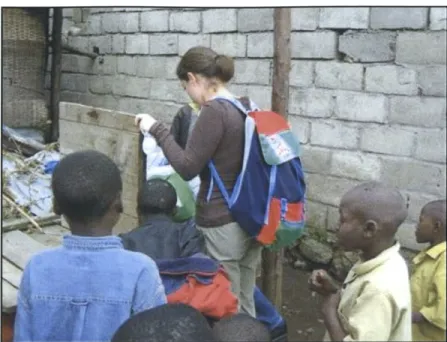
In the Village of Kabatwa at the edge of Karimsimbi Valcano, we observed that every household has an excavated pond to collect rainwater from their own roofs. Each owner of these "collecting
systems" agreed that the ponds provide water for a large part of the year. When the season is hit by a particularly deep drought, people walk to the public water sources of their village. We were surprised by the incredibly different water situation compared to the village of Bisate. At the very least, women and children of Kabatwa do not need to travel long distances to fetch water every day and are free to spend more time working and attending school.
We surveyed the collecting systems of Kabatwa and noticed that the ponds were generally 2 m x 3 m x 1 m (about 6,000 liters of volume), lined with tarpaulin plastic sheets provided by UNHCR (United Nations High Commissioner for Refugees). The ponds varied in location (indoor-outdoor) and type (covered-uncovered). The cover also varied in materials: wood, bamboo, plastic or iron sheets. We surveyed some of the ponds and tested the water, with the main characteristics illustrated in Table 5.
Table 5: Kabatwa ponds' characteristics and pictures
POND'S CHARACTERISTICS POND'S PICTURE
1. Indoor pond
* Indoor pond, bamboo room, plastic lining
* House roof in iron sheets with iron gutters
* Size: Length 3 m, Width 2 m, Depth 0.9 m
* Results of bacterial tests of water: Total coliform contamination, no E. coli contamination
2. Uncovered outdoor pond
I
"
Outdoor pond, uncovered, plastic lining* House roof iron sheets with iron gutters
" Size: Length 3 m, Width 2 m, Depth 0.9 m
* Results of bacterial tests of water: Total coliform contamination, no E. coli contamination
3. Covered outdoor pond * Outdoor pond, plastic covered,
plastic lining
* House roof iron sheets with iron gutters
* Size: Length 2.6 m, Width 2.1 m, Depth 0.9 m
* Results of bacterial tests of water: Total coliform contamination, E. coli contamination
4. Covered outdoor pond * Outdoor pond, iron and plastic
covered, plastic lining
* House roof iron sheets with iron gutters
" Size: Length 2.3 m, Width 2 m, Depth 0.9 m
" Results of bacterial tests of water: Total coliform contamination, no E. coli contamination
5. Covered outdoor pond
" Outdoor pond, bamboo covered, plastic lining
" House roof iron sheets with iron gutters
" Size: Length 2.6 m, Width 1.8 m, Depth 0.9 m
" Results of bacterial tests of water: Total coliform contamination, E. coli contamination
2.4. Pond water quality
While surveying the ponds in Bisate and Kabatwa, our team had the opportunity to sample and test water from different ponds. We consider it very important to compare the water quality in Kabatwa with that from the Bisate rainwater tanks. In fact, we wanted to understand the potential for water quality improvement in case of the implementation of small scale rainwater harvesting systems in Bisate.
2.4.1. Parameters tested and methods
We tested the water to find basic water quality characteristics. The list of the parameters tested is listed below: - E. coli - Total coliform - Turbidity - Conductivity - pH - Alkalinity - Hardness - Nitrate/Nitrite - Chloride
Test methods utilized are described below (HACH 2007):
* E.coli and total coliform - A 3MTM Petrifilm E. coli/coliform Count Plate was placed on a level surface and the top film lifted. A 1 mL of water sample was placed onto the center of the bottom film with a pipette. Carefully, the top film was rolled down without entrapping air bubbles. Before the gel was formed, the inoculum was distributed over the circular area of the film by the flat side of the spreader. After more than one minute, the plate was incubated for 24 hours at a temperature of 20'C. After the incubation, the E. coli and coliform were counted: red and blue colonies with associated gas bubbles for coliform and blue colonies associated with bubbles for E. coli (Figure 19).
JoX
Figure 19: 3M7m Petrifilm E. coli/coliform Count Plates (Picture by Author)
Turbidity - After cleaning the interior, a sample cell was filled to the scribed line with water sample (about 15 mL). Handling the cell by the top, the cell was wiped with a soft, lint-free cloth to remove water spots and/or fingerprints. Then, a light film of silicone oil was applied to the cell over the entire surface wiping it with a soft cloth. The instrument was turned on and the sample cell was inserted in the sample compartment of the HACH 2100P Portable Turbidimeter (Figure 20). The cell was inserted in the compartment so that the orientation mark was aligned with the raised orientation mark in front of the cell compartment. Once the instrument cover was closed, the read-key was pressed and the turbidimeter display showed the water turbidity in Nephelometric Turbidity Units (NTU).
Figure 20: HACH2100P Portable Turbidimeter (Picture by Author)
The calibration of the instrument was performed using four StablCal* Stabilized Formazin standards: <0.1 NTU, 20 NTU, 100 NTU and 800 NTU. The four samples were inserted in the sample compartment for the turbidity reading. The sequential order followed the instructions shown on display. Since the readings matched the NTU standards, the instrument was well calibrated.
* Conductivity - The Pocket PalTM Conductivity Tester (Figure 21) was turned on and its cap was removed. The bottom of the instrument was immersed for 1.5" into the water sample. The sample was gently stirred for several seconds. After the digital display stabilized, the conductivity value was read. The tester, then, was rinsed, closed with its
cap and turned off.
Figure 21: Pocket PalTM Conductivity Tester (Picture by Author)
pH/Alkalinity/Hardness - A HACH 5-in-i Water Quality Test Strip (Figure 22) was quickly immersed into a water sample. After the color development occurred on the test strip, the pad was compared to the chart printed on the bottle to read the value of the parameters. From the multi-parameter test, only three of the five parameters were tested: Total Hardness (as CaCO3, 0-425 mg/L), Total Alkalinity (as CaCO3, 0-240 mg/L), and
pH (6.2 - 8.4).
* Nitrate/Nitrite - The procedure for the Nitrate/Nitrite analysis is very similar to that for pH/Alkalinity/Hardness. A HACH Nitrate and Nitrite Test Strip was rapidly dipped into the water sample. Once the color development occurred on the test strip, the reacted pad was compared to the chart printed on the bottle to read the value of the parameters.
Figure 23: HACH Nitrate and Nitrite Test Strip (H ACH 2007)
* Chloride - A HACH Chloride QuanTab@ Test Strips, 30-600 mg/L, was dipped into the water sample until the strip pad reacted and changed in color. The length of the color change was compared to the printed scale on the bottle to read the value of the parameter.
Figure 24: HACH Chloride QuanTab® Test Strip (Picture by Author)
2.4.2. Test results
The team tested the water quality of six ponds surveyed in Bisate and Kabatwa; the results are summarized in Table 6.
I
U
Table 6: Summary of the water quality of the ponds in Bisate and Kabatwa
Total
Ponds Hardness Alkalinity pH Nitrate Nitrite Chloride Conductivity Turbidity coliform E. coli
(ppm as CaCO3) (as CaCO3) - (ppm) (ppm) (ppm) (pS/cm) (NTU) (/100 mL) (/100 ml)
WHO No standard No < 8.5 for 10 ppm I ppm o N o standard <5 NTUfor 0 colonies 0 colonies
Standards standard chlorination standard Chlorination /100mL /1mL
Bisate 1 25 10 6.8 x x x 47 2.15 700 400 Kabatwa 1 0 0 6.2 1.5 0 <31 21 1.40 400 0 Kabatwa 2 0 0 6.4 0.15 0 <31 14 3.67 1300 0 Kabatwa 3 0 0 6.4 0.15 0 <31 36 2.35 1200 300 Kabatwa 4 <10 0 6.6 0.15 0 <31 32 2.01 4500 0 Kabatwa 5 <10 0 6.4 0.15 0 <31 44 3.19 4700 100
The results of the sample tests show that the water of the ponds of Bisate meets WHO standards (conductivity, hardness, alkalinity, pH, nitrate, nitrite and chloride). However, the results also showed that the water is generally contaminated with total coliform and, in 50% of the cases, E. coli.
The water samples from the rainwater tanks of Bisate showed that water is generally contaminated with total coliform, but not with E. coli. Comparing the results of the water from the tanks and the ponds, we can conclude that the water from the ponds is more contaminated by faecal bacteria than the water from the tanks.
The main difference between the two collecting systems is that tanks have a device to extract the water (generally situated at the bottom of the tank), while the excavated ponds do not. The higher level of contamination by faecal bacteria of the ponds could be caused by the different water extraction system. In fact, the owners of the ponds extract water manually with jerrycans or other type of containers. As shown in Table 5, these containers are not always clean, which is also true for their hands. Thus, dirty hands and containers are the primary sources of ponds' contamination.
Moreover, in most of the cases the ponds are located outside of the houses, at ground level. These conditions favor runoff entering directly into the pond, another source of water contamination. The runoff is often highly contaminated with faecal bacteria because of the ponds' proximity to open latrines. Location and elevation are other relevant sources of water contamination.
2.5.
Conclusion
From the water supply survey in Bisate and the experience in the village of Kabatwa, we observe two major problems: 1) the people of Bisate Village do not have sufficient water for drinking, cooking and washing; and 2) the "community water" is generally contaminated by total coliform. As mentioned earlier, we observed that the community water supply is limited and not homogenously distributed throughout the entire village. This situation leads to many families living far from the center of the village to walk long distances to fetch water. Women and children cannot transport large amounts of water for long distances, resulting in very small water consumption, sometimes less than 5 liters/day/person.
We also observed that almost all sources of water in the village of Bisate are contaminated by faecal bacteria. This situation carries the strong negative effect of a high number of people
suffering from intestinal diseases.
One of the possible solutions to these problems is offered by the experience of Kabatwa Village. There, families use the rainwater collected in household excavated ponds for almost the entire year. They have more water available and do not spend time traveling to fetch water. The implementation of this household rainwater catchment system could definitely improve the quality of life for the people of Bisate Village. If the excavated pond is improved with walls to stop surface runoff from entering into the pond, as well as a stronger cover and a hand pump to extract the water, the implementation of small scale rainwater harvesting system could significantly improve water supply and quality for the families of Bisate Village.