https://doi.org/10.4224/40002078
Vous avez des questions? Nous pouvons vous aider. Pour communiquer directement avec un auteur, consultez la première page de la revue dans laquelle son article a été publié afin de trouver ses coordonnées. Si vous n’arrivez pas à les repérer, communiquez avec nous à PublicationsArchive-ArchivesPublications@nrc-cnrc.gc.ca.
Questions? Contact the NRC Publications Archive team at
PublicationsArchive-ArchivesPublications@nrc-cnrc.gc.ca. If you wish to email the authors directly, please see the first page of the publication for their contact information.
https://publications-cnrc.canada.ca/fra/droits
L’accès à ce site Web et l’utilisation de son contenu sont assujettis aux conditions présentées dans le site
LISEZ CES CONDITIONS ATTENTIVEMENT AVANT D’UTILISER CE SITE WEB.
READ THESE TERMS AND CONDITIONS CAREFULLY BEFORE USING THIS WEBSITE. https://nrc-publications.canada.ca/eng/copyright
NRC Publications Archive Record / Notice des Archives des publications du CNRC :
https://nrc-publications.canada.ca/eng/view/object/?id=80bd0054-2c30-409d-9cc7-8df0aea6a4eb
https://publications-cnrc.canada.ca/fra/voir/objet/?id=80bd0054-2c30-409d-9cc7-8df0aea6a4eb
NRC Publications Archive
Archives des publications du CNRC
For the publisher’s version, please access the DOI link below./ Pour consulter la version de l’éditeur, utilisez le lien DOI ci-dessous.
Access and use of this website and the material on it are subject to the Terms and Conditions set forth at
Development of a winter road climate risk and vulnerability review
framework 2020-2021 update
National Research Council Canada
Development of a Winter Road Climate
Risk and Vulnerability Review Framework
2020-2021 Update
Prepared for:
Crown-Indigenous Relations and Northern Affairs Canada
& Transport Canada
Prepared by:
Merrina Zhang, Alireza Roghani, Larry Hill
Automotive and Surface Transportation Research Centre
&
Paul Barrette
Ocean, Coastal and River Engineering Research Centre
In collaboration with:
Sylvie Chenier, Chantal Edwards & Derek Morrell
Automotive and Surface Transportation Research Centre
2021-05-15
AST-2021-0034
Change Control
Version
Date
Description
Author
1.0
May 15, 2021
Initial Release
Merrina Zhang, Alireza Roghani,
Larry Hill, and Paul Barrette
Prepared by:
______________________________________
Merrina Zhang, P. Eng.
Senior Research Engineer
______________________________________
Alireza Roghani, PhD, P. Eng.
Research Officer, Geotechnical Research
______________________________________
Larry Hill, P. Eng.
Senior Project Engineer
______________________________________
Paul Barrette, PhD
Project Scientist
Reviewed and approved by:
______________________________________
Philip Marsh, P. Eng.
Director, Research and Development
Automotive and Surface Transportation Research Centre
© 2021 Her Majesty the Queen in Right of Canada, as represented by the National Research Council Canada.
Digitally signed by Zhang, Merrina DN: cn=Zhang, Merrina, c=CA, o=GC, ou=NRC-CNRC, email=merrina.zhang@nrc-cnrc.gc.ca Date: 2021.05.13 17:53:03 -04'00'
Zhang,
Merrina
Digitally signed by Hill, Larry
Date: 2021.05.14 09:41:39 -04'00'
Hill, Larry
Digitally signed by Barrette, PaulDN: cn=Barrette, Paul, c=CA, o=GC, ou=NRC-CNRC,
email=paul.barrette@canada.ca Reason: I am approving this document Date: 2021.05.14 14:10:39 -04'00'
Barrette,
Paul
Roghani,
Alireza
Digitally signed by Roghani, Alireza Date: 2021.05.17 14:00:47 -04'00'Digitally signed by Marsh, Philip DN: cn=Marsh, Philip, c=CA, o=GC, ou=NRC-CNRC, email=philip.marsh@canada.ca Date: 2021.05.31 13:59:59 -04'00'
Marsh,
Philip
Executive Summary
In Canada, there are approximately 8,000 km of official winter roads. Unlike roads that can be used all year round, winter roads are seasonally constructed, over frozen terrain and water bodies, such as lakes and rivers.
Winter roads are the lifelines of many northern and remote communities in Canada, which are totally disconnected from all-season roads. Winter roads are built every year, allowing a short time window (several weeks to a few months) to access the all-season road networks that connect the rest of the country. The winter road networks are often the only economical means for the transport of essential supplies such as food, fuel, medical supplies and construction materials, in addition to providing community members access for social and leisure activities, such as visiting relatives and friends in neighboring communities, and accessing employment and health care.
According to a scan of scientific literature by National Research Council Canada’s National Science Library [1], Canada has one of the largest networks of winter roads in the world.
Winter roads are highly vulnerable to a warming climate, since a sufficient number of cold days are required for the ground and bodies of water to freeze to the required depth to create a strong foundation for the safe passage of traffic.
A warming climate is reducing the operating window of these roads across northern Canada. In addition, it is likely that many segments of the current network will become progressively riskier and less reliable and will need to be replaced with alternatives in the future.
There is a need to examine the winter road network in Canada, the factors that affect safety, and to develop a method to review and quantify the impact of climate change across the network. This would allow for better identification of vulnerabilities within the network, prioritization of high risk segments based on key factors, and to support more evidenced-based decision making of the future of different segments of the network in the context of a changing climate.
During FY2020-2021, a literature review of 54 documents was completed to examine Canada’s winter road network, identify parameters that affect winter road safety, models that assess the impact of climate change on winter roads, and identify standards for climate risk assessment related to northern
infrastructure.
A framework to review and assess the climate risk and vulnerability of winter roads in Canada was developed. This framework is intended to evolve over time. The foundation of the framework is based on published scientific methods, field data from winter road operations, as well as stakeholder observation, experience and concerns. A case study of the current iteration of the framework was performed on the James Bay Winter Road in Northern Ontario. Consultations with winter road stakeholders within the federal and provincial governments were completed to better understand the unique challenges and perspectives of each stakeholder. An initial review of relevant and available data for the project was completed, and the gaps in data identified.
Table of contents
Glossary and Definitions ... 8
1 Introduction ... 9
1.1 A Changing Climate ... 10
1.2 Impacts of a Changing Climate on Winter Roads ... 15
1.3 Project Objectives ... 16
1.4 Linkages with Key Stakeholders within the Winter Road Community ... 16
1.5 Synergies with Other Research Initiatives ... 17
2 Background ... 19
2.1 Overview of the Winter Road Network South of the 60th Parallel ... 19
2.1.1 The Network in Ontario ... 19
2.1.2 The Network in Manitoba ... 19
2.1.3 The Network in Saskatchewan ... 20
2.1.4 The Network in Alberta ... 20
2.2 Winter Road Technical Overview ... 21
2.2.1 Types of Winter Roads ... 21
2.2.2 Winter Road Planning Considerations ... 23
2.3 Standards for Climate Risk Assessment ... 25
2.3.1 ASTM E3032 – Standard Guide for Climate Resiliency Planning and Strategy ... 25
2.3.2 ISO 14090 Adaptation to Climate Change – Principles, Requirements and Guidelines ... 26
2.3.3 ISO/FDIS 14091 - Adaptation to Climate Change – Guidelines on Vulnerability, Impacts and Risk Assessment ... 27
2.4 Examples of Climate Risk/Vulnerability Assessments as related to Winter Roads ... 28
3.1 Framework Overview ... 29
3.2 Establishment of Baseline Operating Conditions ... 30
3.2.1 Evaluation of Ice Thickness Estimation Models ... 33
3.3 Projections under Future Climate Scenarios ... 41
3.3.1 Overview of Projections under Future Climate Scenarios ... 44
3.4 Required Data Sets ... 47
4 Case Study - James Bay Winter Road (Ontario) ... 48
4.1 Establishment of Baseline Operating Conditions ... 49
4.2 Projections under Future Climate Scenarios ... 52
4.2.1 Step 2.1 Comparison of Historical Records with Predicted Historical Climate ... 52
5 Stakeholder Consultations ... 56
6 Conclusions ... 57
7 Next Steps and Recommendations ... 60
8 References ... 61
Appendix A: Winter Road Network in the Rest of the World as per Literature Scan ... 62
Appendix B: Maps of Winter Roads under Provincial Jurisdiction ... 64
List of tables
Table 1: Observed Changes in Annual and Seasonal Mean Temperature between 1948 and 2016 for Six Regions and for All Canadian Land Area ... 12 Table 2: Types of Winter Roads [modified after 7] ... 22 Table 3: Typical α Values for Stefan’s Equation as Recommended by US Army Corps of Engineers [23] 32 Table 4: Winter Road Vehicle Weight Limit from Provinces ... 33 Table 5: Winter Roads in the Rest of the World as per Literature Scan by NRC’s National Science Library
List of figures
Figure 1: An Example Winter Road Segment in Northern Ontario (From Google Street View and Maps, https://www.cbc.ca/news/canada/sudbury/winter-road-google-maps-1.5072359) ... 9 Figure 2: Trends in Annual Temperatures across Canada ... 11 Figure 3: Long Term Temperature Observation Sites across Canada (Red-Observes Temperature,
Blue-Observes Precipitation) ... 12 Figure 4: Trends in Seasonal Temperatures across Canada ... 13 Figure 5: Projected Temperature Changes for Winter Season ... 14 Figure 6: Example Winter Road Segment in Northern Ontario
(https://www.theglobeandmail.com/canada/article-the-thin-white-line-how-northern-ontarios-winter-roads-are-built-and/) ... 15 Figure 7: Schematic Representations of a Winter Road Segment Over Land and Over Ice ... 21 Figure 8: Winter Road Climate Risk and Vulnerability Review Framework Concept Map ... 29 Figure 9: Winter Road Climate Risk and Vulnerability Review Framework, Step 1 Baseline Operating
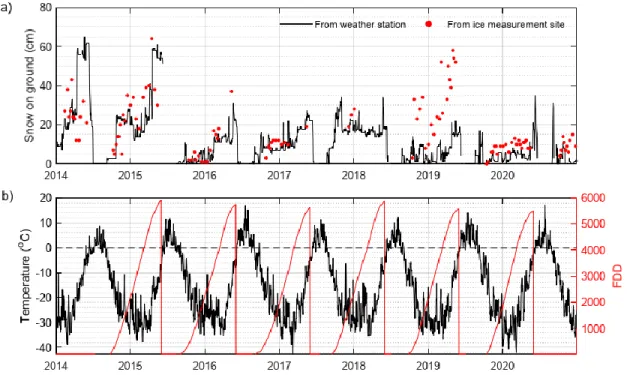
Conditions ... 31 Figure 10: Location of Weather Station that were Part of Government of Canada’s Ice Thickness Program (Green Arrows) ... 34 Figure 11: a) Plot Comparing Snow on Ground Recorded at the Alert Ice Site Measurements with Values
Recorded at the Alert Weather Station, and b) Variation of Mean Daily Temperature Recorded at the Alert Weather Station and the Calculated FDD ... 35 Figure 12: Plots Compare the Ice Thickness Measurements at the Alert Site with Ice Estimate using Eq. 1 with Snow Data from Ice Site and Snow Data from the Weather Station and Stefan’s Equation Using α=3.5 (No Snow) and α=1.7 (Average Lake/River) With Snow ... 36 Figure 13: a) Plot Comparing Snow on Ground Recorded at the Baker Lake Ice Site Measurements with
Values Recorded at the Baker Lake Weather Station, and b) Variation of Mean Daily Temperature Recorded at the Baker Lake Weather Station and the Calculated FDD ... 37 Figure 14: Plots Compare the Ice Thickness Measurements at the Baker Lake Site with Ice Estimate
using Eq. 1 with Snow Data from Ice Site and Snow Data from the Weather Station and Stefan’s Equation Using α=3.5 (No Snow) and α=1.7 (Average Lake/River) With Snow ... 38
Figure 15: a) Plot Comparing Snow on Ground Recorded at the Eureka Ice Site Measurements with Values Recorded at the Eureka Weather Station, and b) Variation of Mean Daily Temperature Recorded at the Eureka Weather Station and the Calculated FDD ... 39 Figure 16: Plots Compare the Ice Thickness Measurements at the Eureka Site with Ice Estimate using
Eq. 1 with Snow Data from Ice Site and Snow Data from the Weather Station and Stefan’s Equation Using α=3.5 (No Snow) and α=1.7 (Average Lake/River) With Snow ... 40 Figure 17: Plots Show the Sensitivity of Ice Thickness to a) Change in Air Temperature and b) Snow
Thickness (Note: The Baseline Model uses Ambient and Snow on Ground Values Recorded during Winter 2018-2019 at the Eureka Weather Station) ... 41 Figure 18: Graphical Representation of How Earth Systems Models are Built [2] ... 43 Figure 19: Graphical Representation of an Ensemble of Climate Models (Canada’s Climate Model is the
CanESM) [2] ... 43 Figure 20: Winter Road Climate Risk and Vulnerability Review Framework, Step 2.1, Step 2.2 and Step
2.3 ... 44 Figure 21: Graphical Comparison of the Resolutions of a Global Model versus a Regional Model [2] ... 45 Figure 22: Example of Predicted Historical Climate from Climate Models of a Location Near the Eureka
Weather Station, Nunavut (https://climatedata.ca) ... 45 Figure 23: Example of Projected Future Climate from Climate Models of a Location Near the Eureka
Weather Station, Nunavut (https://climatedata.ca) ... 46 Figure 24: James Bay Winter Road Northern Ontario (https://www.mndm.gov.on.ca/sites/default/files/en_-_northern_ontario_winter_roads_map_2019.pdf) ... 48 Figure 25: Location of Moosonee Weather Station ... 48 Figure 26: Variation of FDD at Moosonee Weather Station ... 49 Figure 27: Plots Show a) Mean Daily Temperature Recorded at Moosonee Weather Station and
Calculated FDD, b) Snow on Ground Measured at Moosonee Weather Station, c) Ice Thickness Estimate using Eq.1 and Eq. 2 with α=1.7 and 3.5, and d) Maximum Load Capacity of Ice using Eq. 4, and A=4.0. ... 50 Figure 28: Plot Shows the Number of Days after Dec. 1st of Each Year When Maximum Load Capacity of
Ice Reached 5, 10, 15, and 20 tonnes (According to Eq. 2, with α=1.7) and Compare Them with Observations from James Bay Winter Road Presented in Yukari Hori’s Paper [6]. ... 51 Figure 29: Examples of Gridded Cells near the Moosonee Weather Station from ClimateData.ca (10 km
Figure 30: Comparing the Average Monthly Temperature observed at Moosonee Weather Station with the Values Resulted from Climate Modelling (Data Extracted from https://climatedata.ca/) ... 53 Figure 31: Comparing Monthly Average Temperature Observed at the Moosonee Weather Station with
Projected Temperature under Each RCP Scenarios... 54 Figure 32: Projected Average Monthly Temperature at Moosonee Weather Station under Various RCPs
(Mean Values) from Climate Modelling (Data Extracted from https://climatedata.ca/) ... 55 Figure 33: Winter Road Network in Northern Ontario (Dashed Red Lines,
https://www.mndm.gov.on.ca/sites/default/files/en_-_northern_ontario_winter_roads_map_2019.pdf) ... 64 Figure 34: Winter Road Network in Southern Manitoba
(https://www.gov.mb.ca/mit/winter/pdf/reports/southern_dispatch_map.pdf)... 65 Figure 35: Winter Road Network in Northern Manitoba
(https://www.gov.mb.ca/mit/winter/pdf/reports/northern_dispatch_map.pdf) ... 65 Figure 36: Winter Road Network in Saskatchewan (Wollaston Lake Winter Road,
https://www.saskatchewan.ca/government/news-and-media/2007/february/08/ice-road-construction-underway-in-far-north) ... 66 Figure 37: Winter Road Network in Saskatchewan (Athabasca Winter Road,
https://www.saskatchewan.ca/government/news-and-media/2007/february/08/ice-road-construction-underway-in-far-north) ... 66 Figure 38: Winter Road Network in Alberta (Fort Chipewyan Winter Road, La Loche Winter Trail, Lac La
Biche Winter Trail, https://www.rmwb.ca/en/roads-and-construction/resources/Documents/winter-roads-map.PDF) ... 67 Figure 39: Winter Road Network in Alberta (Little Red River Cree Nation Winter Roads) ... 68
Glossary and Definitions
60th Parallel Latitude 60 degrees north of earth’s equator (in Canada, the 60th parallel is the approximate boundary line separating the provinces and the territories) AST Automotive and Surface Transportation Research Centre (NRC) CCCS Canadian Center for Climate Services
CIRNAC Crown-Indigenous Relations and Northern Affairs Canada CMIP Coupled Model Intercomparison Project
CDF Cumulative distribution function
ECCC Environment and Climate Change Canada
ESCER Ouranos consortium and the Centre pour l’étude et la simulation du climat à l’échelle régionale
FDD Freezing degree days
FY Fiscal year
GIS Geographical information system
GPR Ground penetrating radar
GPS Global positioning system
IPCC Intergovernmental Panel on Climate Change IAAC Impact Assessment Agency of Canada
ISC Indigenous Services Canada
MNDM Ministry of Northern Development and Mines (Ontario) NRC National Research Council Canada
NWT Northwest Territories
OCRE Ocean Coastal and River Engineering (NRC) RCP Representative Concentration Pathway
TC Transport Canada
UBC University of British Columbia U of T University of Toronto
1 Introduction
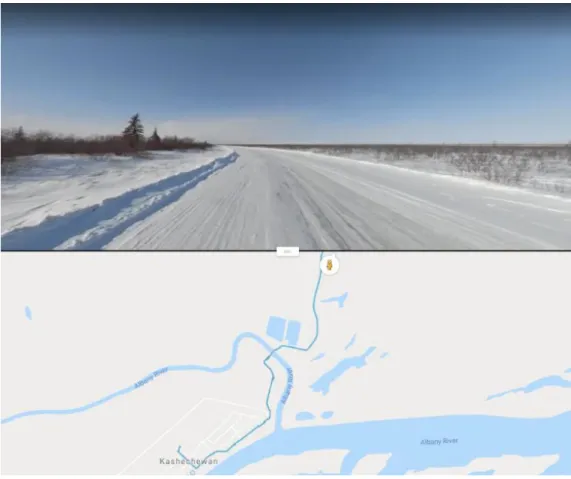
In Canada, there are approximately 8,000 km of official winter roads (an example is shown in Figure 1). Unlike roads that can be used all year round1 (i.e. highways, city streets and country roads), winter roads are seasonally constructed, over frozen terrain and water bodies, such as lakes and rivers.
Figure 1: An Example Winter Road Segment in Northern Ontario (From Google Street View and Maps, https://www.cbc.ca/news/canada/sudbury/winter-road-google-maps-1.5072359)
Winter roads are the lifelines of many northern and remote communities in Canada, which are totally disconnected from all-season roads. Winter roads are built every year, allowing a short time window (several weeks to a few months) to access the all-season road networks that connect the rest of the country. The winter road networks are often the only economical means for the transport of essential supplies such as food, fuel, medical supplies and construction materials, in addition to providing community members access for social and leisure activities, such as visiting relatives and friends in neighboring communities, and accessing employment and health care.
According to a scan of scientific literature by National Research Council Canada’s (NRC) National Science Library [1], Canada has one of the largest networks of winter roads in the world. A detailed list of winter roads generated from the scan is found in Appendix A (Table 5).
1.1 A Changing Climate
Canada’s Changing Climate Report [2] provided the following information with regards to the climate in Canada and in a global context:
There is overwhelming evidence that the Earth has warmed during the Industrial Era… This
evidence includes increases in near-surface and lower-atmosphere air temperature, sea surface temperature, and ocean heat content.
Because air in the Earth’s atmosphere and water in the global oceans flow freely, Canada’s
climate is intimately linked to the global climate. Thus, changes in Canada’s climate are a manifestation of changes in the global system, modulated by the effects of Canada’s mountains, coastlines, and other geographical features.
There is no doubt that Canada’s climate has warmed. Temperature has increased in all regions
of the country and in the surrounding oceans. Annual and seasonal mean temperatures2 across
Canada have increased (Figure 2) at roughly double the global mean rate3, with Canada’s mean
annual temperature having risen about 1.7ºC over the 1948– 2016 period.
Temperature is observed across Canada, though the distribution of temperature observation site
is uneven with more sites in the populated portion of southern Canada, and more sparse observations for much of Canada, especially northern Canada (Figure 3), and very few observation sites predate 1948. As a result, the analysis of past changes in temperature for Canada as a whole is limited to the period since 1948, while 1900 can be used as a starting point for records in southern Canada (Figure 2).
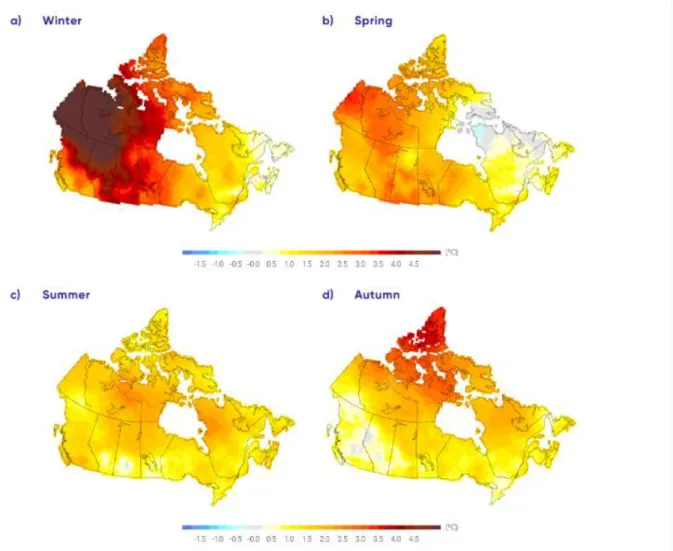
Warming was not uniform across seasons, with considerably more warming in winter than in
summer. The mean temperature increased by 3.3ºC in winter, 1.7ºC in spring, 1.5ºC in summer, and 1.7ºC in autumn between 1948 and 2016 (Table 1, Figure 4).
As well, warming was unevenly distributed across the country. Annual mean temperature over
northern Canada increased by 2.3ºC from 1948 to 2016, or roughly three times the global mean warming rate. Warming was much weaker in the southeast of Canada, where average
temperature increased by less than 1ºC in some maritime areas.
2 Temperatures refer to surface air temperatures, typically measured at 2 m above the ground.
3 0.8ºC increase for 1948–2016 is the global average according to the global mean surface temperature dataset produced by the
Figure 2: Trends in Annual Temperatures across Canada4
4 Observed changes (ºC) in annual temperature between (a) 1948 and 2016 and (c) 1900 and 2016. Changes are computed based
on linear trends over the respective periods. Annual temperature anomalies (departures from baseline means) are expressed relative to the mean for the period 1961–1990 (b) for Canada as a whole and (d) for southern Canada (south of 60º north latitude); the black lines are 11-year running means. Estimates are derived from the gridded station data. There are insufficient data in northern Canada to confidently calculate warming trends from 1900 to 2016.
Figure 3: Long Term Temperature Observation Sites across Canada (Red-Observes Temperature, Blue-Observes Precipitation)
Table 1: Observed Changes in Annual and Seasonal Mean Temperature between 1948 and 2016 for Six Regions and for All Canadian Land Area5
5 Changes are represented by linear trends over the period. Estimates are derived from the gridded station data. There is a lack of
Figure 4: Trends in Seasonal Temperatures across Canada6
The Changing Climate Report [2] provided the following information with regards to the future climate in Canada:
Canada’s climate will warm further, with warming projected in all seasons.
Projected warming for Canada as a whole is almost double that of the global average, regardless
of the emission scenario. Country-wide annual average temperature projections for the late century (2081-2100) range from an increase of 1.8ºC for a low emission scenario (Representative Concentration Pathways (RCP) 2.6 to 6.3ºC for a high emission scenario (RCP8.5). Emission
scenarios are discussed in more detail in section 3.3.
Projected warming under both low and high emission scenarios show a general pattern of change
in the winter (Figure 5). Consistent across scenarios, the smallest changes are projected for southernmost Canada and the largest changes are projected for Hudson Bay (and the Arctic).
6 Observed changes in seasonal mean temperature between 1948 and 2016 for the four seasons. Estimates are derived based on
Figure 5: Projected Temperature Changes for Winter Season7
7Maps and time series of projected temperature change (ºC) for December, January, and February, as represented by the median of
the Coupled Model Intercomparison Project (CMIP) 5 multi-model ensemble. Changes are relative to the 1986–2005 period. CMIPs
1.2 Impacts of a Changing Climate on Winter Roads
Unlike most other surface transportation systems, winter roads are mostly a product of the natural environment as seen in Figure 6, including the geology of the terrain, the gradient and characteristics of the waterways.
Winter roads are also highly dependent on air temperature, precipitation (snow), wind and solar radiation. As a result, they are highly vulnerable to a warming climate, since a sufficient number of cold days are required for the ground and bodies of water to freeze to the required depth to create a strong foundation for the safe passage of traffic.
Figure 6: Example Winter Road Segment in Northern Ontario (https://www.theglobeandmail.com/canada/article-the-thin-white-line-how-northern-ontarios-winter-roads-are-built-and/)
A warming climate is reducing the operating window of these roads across northern Canada. In addition, it is likely that many segments of the current network will become progressively riskier and less reliable and will need to be replaced with alternatives in the future.
There is a need to examine the winter road network in Canada, the factors that affect safety, and to develop a method to review and quantify the impact of climate change across the network. This would allow for better identification of vulnerabilities within the network, prioritization of high risk segments based on key factors, and to support more evidenced-based decision making of the future of different segments of the network in the context of a changing climate.
1.3 Project Objectives
The objectives of this project are as follows:
Complete a literature review to examine Canada’s winter road network, identify parameters that affect winter road safety, models that assess the impact of climate change on winter roads, and identify standards for climate risk assessment related to northern infrastructure
Develop a framework to review and assess the climate vulnerability of winter roads in Canada Consult with stakeholders to better understand the challenges within the winter roads community Identify and gather relevant data available in the public domain8
Identify data gaps
1.4 Linkages with Key Stakeholders within the Winter Road
Community
This project directly supports the priorities and mandates of the following stakeholders within the winter road community:
NRC
Automotive and Surface Transportation Research Centre’s (AST) Resilient Ground Transportation Program, which focuses on research and development activities and technology development for the improvement of productivity, efficiency, and safety of the Canadian on/off-road transportation system.
Ocean Coastal and River Engineering (OCRE) Research Centre‘s ice engineering research, through its Arctic Program (2014-2021), to address the over ice segments of winter roads and their vulnerability to climate change, as these are often weak links in a road and present a significant risk to life in case of breakthroughs. Over the years, OCRE has been instrumental in building a stakeholder network, including federal, provincial and territorial governments, and universities in Canada and the United Kingdom, to address the needs of the infrastructure built over ice.
Crown-Indigenous Relations and Northern Affairs Canada (CIRNAC)
First Nation Adapt Program, which provides funding to First Nation communities located below the 60th parallel to assess and respond to climate change impacts on community infrastructure and emergency management. The program prioritizes First Nation
communities most impacted by climate change related to sea level rise, flooding, forest fires, drought, fisheries and winter road failures. The winter road climate risk and vulnerability review framework will form the foundation for the winter road module of CIRNAC’s Climate Risk Index Tool, as well as future winter road climate risk review, assessment and mediation efforts.
Transport Canada (TC)
TC’s Strategic Policy and Innovation team and the Northern Transportation Adaptation Initiative team. The winter road climate risk and vulnerability review framework and the knowledge generated by the project will enable the TC teams to advance two of their core objectives, including developing new knowledge about how climate change is affecting transportation systems in the north and develop tools and practices to respond to these effects.
This project supports the following stakeholders within the winter road community through better
identification of vulnerabilities within the network, prioritization of high risk segments based on key factors, and to support more evidenced-based decision making for the future of different segments of the network in the context of a changing climate:
CIRNAC’s Climate Change Preparedness in the North Program, Indigenous Community-Based Climate Monitoring Program, and Environmental Impact Assessment Program
Indigenous Services Canada (ISC)’s Regional Infrastructure Delivery Branch, Manitoba Regional Office, Ontario Regional Office, Alberta Regional Office, Northwest Territory Regional Office, and Emergency Management Assistance Program
Provincial governments Territorial governments
Communities served by the winter road networks
Private sector organizations building, maintaining and using the winter road networks
1.5 Synergies with Other Research Initiatives
NRC has been investigating winter roads since the 1960’s. One of the most significant outcomes of this work is referred to as ‘Gold’s formula’ [3], which estimates the bearing capacity of the over ice segments of the winter road network based on the thickness of the ice and breakthrough observations. Gold’s formula is alluded to, either implicitly or explicitly, in virtually all official winter road guidelines in Canada9. In recent years, NRC has actively engaged with winter road stakeholders in Canada to better understand their respective needs and challenges. These efforts have revealed that the winter road transportation systems in Canada are poorly understood in the following aspects:
Information on the physical elements of these networks (i.e. location, routing, characterization, etc.) is minimal, fragmented and not uniform across provincial and territorial boundaries. Currently, there is no coordination nor knowledge-sharing between the various jurisdictions,
although guidelines have begun to align, such as the case between the Northwest Territories and the Provinces of Alberta and Ontario.
9 Gold’s formula is integrated into the proposed winter road climate risk and vulnerability framework, which is discussed in more
Information on road usage, goods movements, intermodal connectivity, access to health care and employment, is lacking, particularly in the Province of Ontario, which has the country’s largest network of winter roads. As a result, decision-makers are unable to assess community vulnerability, especially in the context of a changing climate.
In order to address the data gap, NRC initiated the following two research activities, both focusing on the Territorial North (north of the 60th parallel):
A tool to optimize the effectiveness of the winter road network in the Canadian North, is a project led by the University of Toronto (U of T) and funded by Transport Canada's National Trade Corridor Fund10. It is a five year project (May 2020 to April 2025) aimed at developing a user-friendly, web-based portal that will centralize critical information including transportation network technologies, climate data and simulations, logistics and transportation operational data, physical, socio-economic and cultural aspects of winter road and trail networks in the Northwest Territories (NWT) and Nunavut. Stakeholder engagement, community outreach and aboriginal consultations are an important part of the project’s planned activities. The ultimate outcome is to improve transportation to and from northern communities, address capacity constraints and bottlenecks, increase their resiliency to a changing climate, and support safety and economic development. Building a Multimodal Transportation Network Database and Exploring Data Collection Methods
to Support Transportation Operations in the Canadian North, is a project led by the University of
British Columbia (UBC) and funded by NRC’s Artificial Intelligence for Logistics Program11. It is a three year project (September 2020 to August 2023) to examine how winter road networks fit within the multimodal transportation network in the NWT and Yukon. This project will examine how winter roads are operated and used (leveraging the U of T project), in addition to
characterizing and gathering data for connecting facilities (all-weather roads, marine) and hubs (aerodromes). It will also investigate technologies for automated data collection on remote transportation facilities operating in harsh and remote environments, and identify potential opportunities to fill critical data gaps. Lastly, the project will prepare information collected and/or created for secure transfer and integration into the NRC’s logistics data vault. It is anticipated that this data can complement other data in the vault, to better understand the Canadian freight network.
Team members from this project, the U of T project and the UBC project are working together and leveraging resources, knowledge, technology and methods from each project. The three projects currently focus on different parts of the country, with this project focusing on the winter road network south of the 60th parallel, while the U of T project focusing on NWT and Nunavut, and the UBC project focusing on NWT and Yukon. Together, the research outcome will provide a more complete
understanding of Canada’s winter road network, unique regional differences, as well as common challenges that will support future adaptation efforts for both the provinces and the territories.
10 https://tc.canada.ca/en/programs/funding-programs/national-trade-corridors-fund
11
2 Background
2.1 Overview of the Winter Road Network South of the 60
thParallel
In Canada, winter roads are generally grouped into three main categories, based on their management structure [4]:
Provincial/Territorial – funded, built and maintained by the provincial or territorial governments. These winter road networks generally abide by standard procedures for construction,
maintenance and quality assurance, including the monitoring of vehicle weights and ice thickness. The operators may be from the local communities.
Local communities – managed by the local communities to service their needs including access to work, school, health care, air strips, fishing and hunting grounds, and leisure activities. Included within this category are privately-owned ice crossings. Operations run by local communities may not be as consistent as those managed by governments and the industrial sector in terms of construction and maintenance procedures, rules-of-the-road and safety monitoring. Also, communities may or may not have the required funding or resources to fix or accommodate critical problems causing road closures.
Industrial sector – independently funded, built and maintained by the private sector, such as mining, pulp & paper and hydro power companies. These roads are normally built for industrial usage (with heavy loads such as 40+ tonnes), for which in-depth analysis of load distribution (i.e. for axle spacing) and ice bearing capacity is often conducted by specialized firms. Because of the higher loads and traffic density, industrial winter roads generally have a higher level of monitoring and control. Local communities may be given access to these roads.
2.1.1 The Network in Ontario
The winter road network in Ontario consists of 30 individual operations that connect 31 First Nations communities in northern Ontario to all-season roads or railway networks12 (Appendix B, Figure 33) [5]. Of the 31 communities, 22 of the communities are reliant on diesel fuel for power generation. The cumulative network length is about 3,160 km (2019-2020 season), which is the longest network in Canada. Ontario’s winter road season typically starts in mid-December and lasts until spring thaw. The roads are jointly funded by Ontario’s Ministry of Northern Development and Mines (MNDM) and ISC.
2.1.2 The Network in Manitoba
The winter road network in Manitoba is funded jointly by the province’s Department of Transportation and ISC13. Divided into a southern section (Appendix B, Figure 34) and a northern section (Appendix B, Figure 35), its cumulative length is about 2,383 km, with 60 ice crossings. There are 18 First Nations communities in Manitoba that rely on winter roads, four of the 18 are reliant on diesel fuel for power
12
https://www.mndm.gov.on.ca/en/northern-development/transportation-support/northern-ontario-winter-roads#simple-table-of-contents-3
generation. This network is used primarily by heavy traffic delivering bulk goods, but also by community members in smaller vehicles. Ice crossings must be able to withstand a weight of up to about 40 tonnes. Vehicles heavier than 7 tonnes have a speed limit of 15 km/h at a distance of at least 1 km from each other. Manitoba’s winter road season is typically from mid-January to mid-March. Road conditions are updated via Manitoba 511 (http://www.manitoba511.ca/en/).
2.1.3 The Network in Saskatchewan
The winter road network in Saskatchewan is constructed and maintained by private organizations contracted by the Ministry of Highways and Infrastructure [6]. There are two main segments, the Wollaston Lake Winter Road (Appendix B, Figure 36) and the Athabasca Winter Road14 (Appendix B, Figure 37) with a total length of approximately 217 km, as well as an ice crossing (Riverhurst, 2.1 km15). The winter road network services three First Nations communities, none of which are diesel dependent. Saskatchewan’s winter road season is typically from early February to the end of March. Road conditions are updated via http://roadinfo.telenium.ca/iceroads.html.
2.1.4 The Network in Alberta
Within the Province of Alberta, the Regional Municipality of Wood Buffalo in northern Alberta maintains three winter roads or trails16 (Appendix B, Figure 38):
The Fort Chipewyan Winter Road (184 km) La Loche Winter Trail (57 km)
Lac La Biche Winter Trail (11 km)
The information related to what distinguishes a ‘winter trail’ from a ‘winter road’ was not uncovered during initial reviews in fiscal year (FY) 2020-2021. Historically, a winter trail is defined as being narrower than a winter road, and can be built in a single pass by a vehicle fitted with a blade [7, 8]
Little Red River Cree Nation builds and operates two winter access to their community (Appendix B, Figure 39):
Peace River Ice bridge17 (40 km crossing of the Peace River)
Southern (secondary) Access (58 km crossing of Wabasca River and Little Red River)
Parks Canada operates the Fort Smith Winter road (228 km) in Wood Buffalo National Park18. The road is usually open from mid-December to mid-March, depending on the winter conditions.
14 Also known as the Fond du Lac Winter Road.
15 https://www.dangerousroads.org/north-america/canada/3236-riverhurst-crossing.html
16 https://www.rmwb.ca/en/roads-and-construction/winter-roads.aspx#How-long-are-the-winter-roads 17 Partially funded by ISC.
2.2 Winter Road Technical Overview
Unlike most surface transportation systems, where humans exercise a greater degree of control in the design, and selection of materials and foundation, winter roads are heavily dependent on the natural environment, including the climate and physical environment. Often referred to as ice roads, winter roads can be constructed over land, or over ice as shown in Figure 7. Most winter road segments in Canada, though not all, have both over land and over ice segments.
Figure 7: Schematic Representations of a Winter Road Segment Over Land and Over Ice
Winter roads differ from other engineered transportation systems in Canada since they are not built, maintained, managed, nor regulated in a consistent fashion across, and even within jurisdictions. Further, they vary substantially in the type of foundation, the width (right-of-way), grade, cross-slope, orientation, radius of curvature, over ice versus over land ratios, nature of shore-crossings, amongst other factors. These factors result in potential weak links in the network, which when coupled with a warming climate can result in mid-season closures or early season closures.
2.2.1 Types of Winter Roads
Table 2 provides an example of a classification for winter roads. It should be noted that the terminologies used by winter road stakeholders in Canada are not uniform. For instance, ‘ice road’ and ‘ice bridge’ are often used to designate a winter road segment on floating ice [e.g. 8].
Terrain Road type Category Description
Over land Compacted snow roads C1 Road surface composed of compacted natural snow
Ice-capped snow roads C2 Compacted natural snow that is ice capped using water
Aggregate ice roads C3 Building ice surfaces by flooding with water or harvesting and flooding ice chips (aggregate)
Over ice Floating ice road C4 Roads that follow floating ice covers on lakes or rivers
Grounded ice road C5 Roads that follow ice covers grounded on a lake or river bottom
Table 2: Types of Winter Roads [modified after 7]
Compacted snow road (C1) is where the natural snow has been compacted enough to allow trafficability. It is the least expensive road to build. Compaction is done in a variety of ways, including with rollers and steel frame drags. In the years where snow fall is lower than usual, additional snow may be hauled from nearby locations. C1 roads are vulnerable to warm temperature and exposure to sunlight.
Over land ice-capped snow road (C2) involve surface flooding and allow for the passage of heavier vehicles than C1 roads. The reason is that an icy surface is stronger and more resistant to wear than a snow surface. In places, the sub-grade can be directly overlain with that ice layer (i.e. without a snow layer). However, adding water to the compacted snow complicates the logistics – water tankers or trucks have to be involved and nearby sources of water have to be available. The operators may require permission from environmental authorities to use the water. Lower traction on C2 roads has to be taken into account in road planning, for instance when considering grades and vehicle capabilities.
Over land aggregate ice roads (C3) can accommodate the highest vehicle weights and passage
frequency, and are suitable for uneven terrains. An additional step in building them is the recourse to ice chips that are flooded with water. The road builder makes use of tractors equipped with rippers. The ice is hauled and dumped at the location (as would be done with gravel for an all-season road). The ice chip surface is then packed and saturated with water. This accelerates the rate of sub-grade thickening where it is required. C3 roads do not need a snow layer. Logistically, they are even more involved than C2 because they rely on the availability of water and ice, and may also require permission from environmental authorities to access both.
Floating ice roads (C4) are built over frozen water surfaces, which are very practical media for surface transportation. They are flat, require minimum maintenance and may run in a straight line (as opposed to over land segments, which must take into account the topography and vegetation. The limiting factor is climate, mainly the air temperature and the amount of snow fall, since these factors control the rate of ice growth. Human intervention can help to increase the rate, such as removing the snow cover, and
breakthrough19 in C4 roads remain a concern for winter road operators. Risk mitigation measures include adequate traffic management, ice thickness monitoring and quality inspection.
Grounded ice roads (C5) lie directly on the river or lake bed, typically near the shorelines. The ice can be fastened to the bottom. Alternatively, at shoals (i.e. in shallow lake areas), and where the ice cover has been thickened to a sufficient extent by surface flooding, the ice can sink down and end up resting on the lake’s bottom. C5 roads are generally capable of supporting higher loads than C4 roads.
2.2.2 Winter Road Planning Considerations
There are a number of different guidelines in Canada for the construction, maintenance and usage of winter roads. [9], [7] and [10] are considered the most recent and comprehensive sources. Systematic comparisons between some of the guidelines are also available [7, 11, 12, 5].
The following list includes winter road planning requirements and considerations [4] [7]: Schedule and operating windows - the target road opening and closure dates, and the
parameters that control these dates
Road opening is controlled by the maximum weight the road is expected to carry (for example some roads are meant to carry tractor trailers while others only handle light vehicles) and a sufficient number of cold days required to allow the ground20 to freeze sufficiently/ice21 to achieve a safe thickness. In November or December of each winter road season, depending on the location, the road may be first open to light vehicles, then to heavier vehicles. Air temperatures below freezing point, often measured in freezing-degree days (FDD), are required throughout the winter to keep the road surface strong enough.
Temporary road closures may happen during the season, when a weak link in the network becomes unusable/unsafe and a detour is not possible. [6]
Official road closure happens when an operation ceases its activities. This varies from year to year. Road closure can be due to the deterioration of the over land segments and their transition to the over ice segments, for example, where the road is darkened by the soil. Because of the lower albedo, sun rays are absorbed, contributing to the increased melting. Softening of the over ice surfaces can also be a factor. Some operators may close their road because there is no longer a need for it, such as cases when
communities have received all shipments of essential fuel and materials. [6] [13]
Each winter road operation is different and there can be a number of factors contributing to its opening, mid-season or end of season closures.
Traffic type and volume – the types of vehicles (weight, size, axel load distribution) and the number of passages expected
The road right-of-way – road type, width, number of lanes, location, and type of work involved (servicing communities, mines, seismic program, etc.…)
19 There is a gap in data related to statistics of breakthroughs and fatalities.
20 For overland segments, snow is left in place and compacted. This preserves a high albedo and accelerates ground freezing, as
well as providing a uniform surface. Albedo in this context refers to the amount of sunlight reflected by the ice/snow. If the ice/snow surface becomes dirty, for instance when it incorporates sand, it absorbs the sunlight, which accelerates melting because of stored heat.
21 As discussed in section 2.2.1, C4 roads, ice growth can be accelerated by snow removal, as well as with flooding to artificially
Environmental and regulatory requirements - factors such as the amount of water extraction, disturbance of aqueous wildlife and chemical or fuel spills need to be considered
Over land route options – topography, water and snow requirements and the nature of the terrain, for example dry mineral soil is desirable while muskeg is not
Muskeg is mostly a mixture of organic material that is either alive (e.g. moss) or decomposing in an anaerobic environment (low oxygen). Its water table – the ground water upper surface – is near the surface and is therefore exposed to freezing in the winter. Its ability to sustain a vertical load depends on its composition – to avoid failure, one needs to ensure freezing depth is sufficient for the planned loads. In places, muskeg can be affected by water circulation. Moreover, because of extensive bacterial activity, whereby anaerobic conditions promote fermentation, muskeg is a methane-generating environment [14]. This gas is poorly soluble in water, and may contribute to the increase of ice porosity in the muskeg and a corresponding decrease in strength. Initial ice growth in muskeg is more sensitive to mild winters. Overall, the behavior of muskeg is
mechanically unlike mineral soil. Winter road routing over this terrain requires careful consideration to avoid breakthroughs.
Permafrost, which is often associated with muskeg, is mostly found north of the 60th parallel. It is very sensitive to disturbance and weather patterns, and is also affected by climate change [15]. Permafrost can be several hundred years old. It is divided into two layers: an active layer that undergoes yearly freeze-thaw cycles, and a permanently frozen layer, extending several hundred meters in the colder regions, to a few meters where it is warmer. Permafrost is classified according to its distribution in terms of surface area it occupies at any given location into continuous (> 80%), discontinuous (30-80%), and sporadic (<30%). Even where it is discontinuous or sporadic, given this terrain’s sensitivity, it is a significant factor in winter road management. Because winter roads are not used in the summer, they do not face the same engineering challenges of all-season roads, which have to contend with a thawing active layer. In other words, the active layer below a winter road is always frozen, thereby protecting the permanent layer below. Nonetheless, in these areas, it is recommended to [7] avoid ground known to be rich in ice, avoid peat deposits and muskeg, plan the route so it runs over coarse grained soils, such as moraines and outwash areas, and in areas of discontinuous permafrost, consider routing over south-facing slopes, which may be devoid of permafrost.
Temperature and snow fall for over land segments - historical records of freezing degree days (FDD, section 3.2) and snow fall are critical parameters. [7] mentions that a FDD of 300 as a minimum for ground freezing, and 5-10 cm of snow to support traffic
Over ice options – water currents (if any), availability of portages (over land bridge between lakes) and bathymetry, and water influx from nearby streams. Shallow areas and shoals can be problematic, for instance, to address issues related with vehicle speed
Over ice segments correspond to winter road C4 type. In wooded sectors, these roads may be more exposed to the sun compared to over land segments, since the latter may be sloping toward the north or benefit from the shade from evergreen vegetation. They may also be affected by the wind and, in places, water currents, bearing in mind the foundation – frozen water – is thin relative to the water column below it.
From a road construction and maintenance perspective, early snow removal “represents the greatest risk of a possible breakthrough” [7]. Breakthroughs also happen for a number of other reasons. Further, since the mechanical strength and elastic behavior of an ice cover is influenced by air temperature and solar radiation [e.g. 16, 17], higher risks are also associated with surface trafficability late in its operational time window.
Ice conditions - similarly, historical ice thickness data should be consulted, along with freeze-up dates and ice cover disintegration/break-up dates.
Climate change – better integration of warming trends will allow better planning and anticipate future winter road operating windows.
2.3 Standards for Climate Risk Assessment
A scan by NRC’s National Science Library on international standards related to the assessment of risk due to climate identified the following three main standards:
ASTM E3032 – Standard guide for climate resiliency planning and strategy
ISO 14090 – Adaptation to climate change – principles, requirements and guidelines
ISO/FDIS 14091 - Adaptation to climate change – guidelines on vulnerability, impacts and risk assessment
This section provides a summary of relevant items from the three standards.
2.3.1 ASTM E3032 – Standard Guide for Climate Resiliency Planning and Strategy
This standard [18] provides a generalized, systematic approach to voluntary assessment and risk
management of extreme climate related events and conditions. The standard outlines a risk management process as follows:
Establish the context – state the objectives, define which extreme weather scenarios will be used to inform the risk assessment, identify stakeholders, their objectives and how they will be
engaged, define the external and internal factors that may give rise to climate risks or influence vulnerability, define the risk criteria to be used to assess likelihood and consequence, and define the scope, purpose and structure of the particular risk management activity.
Risk identification – create a comprehensive list of risks based on available climate information that might significantly affect the settlement or infrastructure. This helps to better understand whether these risks may lead to beneficial or detrimental outcomes.
Risk analysis – develop an understanding of the risk.
Risk evaluation – used to help decide which risks need to be treated and their priority.
Risk treatment – a range of possible options for treating each risks is required to allow the most appropriate actions to be selected.
In the simplest of terms, the standard is a guide for the process of identifying the risks for the objectives, prioritizing those risks, identifying the potential loss, and developing plans or measures to mitigate the risks.
The approach outlined by this standard has been specifically developed for the United States (US). The country is divided into eight different climate assessment regions, where each region has its susceptibility to certain types of extreme climatic events. A table is included in the standard that provides examples of extreme climatic events and identifies which events should be given priority in each region. The extreme climatic examples given are, but are not limited to:
Extreme Temperature (hot or cold), Drought
Fire Flood Storms
Land Movement Subsidence Sea Rise and Tidal Effects
2.3.2 ISO 14090 Adaptation to Climate Change – Principles, Requirements and
Guidelines
This standard [19] specifies the principles, requirements and guidelines for an organization to adapt to climate change. The document outlines how to integrate adaptation within or across an organization, how to identify and understand the impacts and uncertainties of climate change, and how to make informed decisions.
The document outlines a structured approach which includes: Pre-planning
Assessing impacts including opportunities Adaptation planning
Implementation
Monitoring and evaluation Reporting and communication
Preplanning is a process that prepares the organization to implement the structured approach outlined in this standard. Pre-planning involves assessing, and where necessary establishing, the capability of the organization to undertake this structured approach as well as identifying interested parties and how it engages with them.
For assessing climate change impacts including opportunities, the organization shall:
Assess how its activities, products and services might be impacted by climate change Access the organization’s existing adaptive capacity to the impacts of climate change Identify opportunities that can arise from climate change
Identify the uncertainties in climate scenarios, climate projections and data used in the decision making process and how this uncertainty can influence the results.
The standard identifies three methods to assess impacts: Risk assessment
Vulnerability assessment Thresholds analysis
The organization should adopt the method(s) best suited to their needs. For adaptation planning, the organization shall:
Assemble an adaptation plan from varied sources of knowledge, information and data, in the context of existing policies, strategies, planning and decision-making processes
Incorporate and embed climate change adaptation into its policies, strategies and plans Develop a decision making process and a mechanism for feedback and learning from the
decisions made
For implementation, the organization shall prepare an implementation plan that:
Documents the processes, including inputs and outputs, that ensure the actions identified in the adaptation plan are delivered
Sets out contingencies in order to attain successful implementation where actions are found to be incapable of delivering the desired outputs
Provides for adjustment where new learning and/or circumstances are recognized
Monitoring and evaluation are used to assess, inform and review the adaptation plan so that satisfactory progress is confirmed and indications of unsatisfactory progress are highlighted early enough, triggering when additional action is needed and allowing corrective action to be taken. The organization shall prepare a monitoring and evaluation plan that assesses progress against the implementation plan. The monitoring and evaluation plan should include an assessment of actions, inputs, outputs, resources, roles and responsibilities, processes, capacities and any other relevant aspects. Monitoring and evaluation is used to inform the organization about the progress of its climate change adaptation. It can generate knowledge, learning and evidence that can then inform adaptive management.
For reporting and communication, an organization may communicate its climate change adaptation to interested parties external to the organization. When an organization makes an external climate change adaptation communication it shall be supported by a climate change adaptation report that is easily accessible to any interested party and is free of charge.
2.3.3 ISO/FDIS 14091 - Adaptation to Climate Change – Guidelines on
Vulnerability, Impacts and Risk Assessment
This standard [20] belongs to an emerging family of standards on adaptation to climate change under the umbrella of ISO 14090 “Adaptation to climate change — principles, requirements and guidelines” (section 2.3.2).
This standard is part of the second list item from section 2.3.2 under ‘assessing impacts including opportunities’. Risk assessment made using the approach in this standard provides a basis for the subsequent elements of ISO 14090, including adaptation planning, implementation, and monitoring and evaluation.
This standard provides guidance for assessing the risks related to the potential impacts of climate change. It describes how to understand vulnerability and how to develop and implement a sound risk assessment in the context of climate change.
Climate change risks differ from other risks. Often little can be said about their short term or long term probability so a conventional risk assessment which uses statistical probabilities can be ineffective. For this reason, various approaches have been developed for assessing climate change risks and this document is a guide to the use of screening level assessments and impact chains. The screening level approach can serve as a stand-alone, simplified risk assessment for a straight forward system at risk or those with a limited budget, or serve as a pre-assessment prior to the use of impact chains.
The document defines the components for risk assessment as: The hazard
Exposure of a given system to the hazard Sensitivity of the system to the hazard
Risk with adaptation (in the future)
The document defines the steps of a risk assessment process and expands upon each of the following: Preparing a climate change risk assessment
Establishing the context
Identifying objectives and expected outcomes Establishing a project team
Determining the scope and methodology Setting the Time Horizon
Gathering relevant information Preparing an implementation plan Ensuring transparency
Implementing a climate change risk assessment Screening impacts and developing impact chains Identifying indicators
Acquiring and managing data
Aggregating indicators and risk components Assessing adaptive capacity
Interpreting and evaluating the findings Analysing cross-sectoral interdependencies
Reporting and communicating climate change risk assessment results Climate change risk assessment report
Communication of climate change risk assessment results and outcomes Reporting findings as a basis for appropriate adaptation planning
The standard provides several annexes as to how to apply this method.
2.4 Examples of Climate Risk/Vulnerability Assessments as related to
Winter Roads
The project team attempted to located examples of climate related risk/vulnerability assessments in literature on winter roads. 22 documents were reviewed in search of examples on winter roads either in Canada or internationally.
During FY2020-2021, no true example was located of a risk assessment or vulnerability assessment that follows the procedures outlined in ISO 14090, related to pre-planning, assessing impacts including opportunities, adaptation planning, implementation, monitoring and evaluation, and reporting and communication.
3 Proposed Winter Road Climate Risk and
Vulnerability Review Framework
The development of the framework to review winter road climate risk and vulnerability is intended to be a process that will evolve over time. The foundation of the framework is based on published scientific methods, field data from winter road operations, as well as stakeholder observation, experience and concerns. This section describes the iteration of the framework as of FY2020-2021.
3.1 Framework Overview
The key factors that significantly impact the performance of winter roads, as identified from the scientific literature and technical documents and reports produced by winter road stakeholders, are broadly organized into four categories, including climate factors, road characteristics, operational characteristics and socioeconomic factors22, as illustrated in the framework concept map in Figure 8.
Figure 8: Winter Road Climate Risk and Vulnerability Review Framework Concept Map23
22 Referring to factors related to (but not limited to) cultural, economic, community living and ecological.
23 Yellow coloured items are incorporated into this iteration of the framework; Orange coloured items are incorporated into this
iteration of the framework; Red coloured items have been identified as important, but have not been incorporated into this iteration of the framework; Grey coloured items have not been incorporated into this iteration of the framework.
As of FY2020-2021, the factors related to climate, road characteristics and operational characteristics are incorporated into the framework.
Within the category of climate factors, air temperature and snow have been incorporated into the framework, as these parameters have emerged as the most significant factors for winter road construction, operations and maintenance. This was consistent with the literature review as well as through the consultations with provincial government officials. Within operational characteristics, since the weight of vehicles travelling across the network establishes the load limits the roads need to sustain, it is one of the first parameters incorporated into the framework. Consultations with provincial governments also revealed that the controlling parameter for being able to open road segments is whether the over ice segments have accumulated sufficient thickness to carry the designated load limits, while the over land segments are often the controlling parameter for mid-season interruptions, as well as season closures. The work completed during FY2020-2021 (this report) focused on incorporating models for over ice segments, as well as integrating the road season opening into the framework. Opening date is a very important parameter when assessing present and future road effectiveness, and historical information on this parameter is available from many operations.
There are two key steps within the winter road climate risk and vulnerability review framework: 1. Establishment of baseline operating conditions
2. Project operational conditions using future climate models
2.1 Compare observed climate data with the predicted historical climate by climate models to determine calibration/transfer function (this step is usually referred to as statistical downscaling), and integrate calibration/transfer function into future climate projections 2.2 Down scale calibrated future climate projections from monthly averages to daily
temperatures
2.3 Project future operating conditions using downscaled future daily temperature data and parameters from baseline operating conditions
The steps are discussed in detail in the sections that follow.
3.2 Establishment of Baseline Operating Conditions
The method to establish baseline operating conditions is illustrated Figure 9. The framework proposes to examine the known weak links within each network in detail. Depending on the location of the weak link, whether it is over ice or over land, the proposed analytical method is different due to the differences in operating conditions.
As mentioned in the previous section, the parameters incorporated to date focus on integrating models for the on-ice segments of the network, which are the controlling factors for determining winter road season opening, since the over ice segments are the slowest within winter road networks to accumulate sufficient thickness to carry the designated load limits.
Figure 9: Winter Road Climate Risk and Vulnerability Review Framework, Step 1 Baseline Operating Conditions
The primary model for the over ice portion of the network is the formula to estimate ice thickness growth (#1 in Figure 9), as proposed by [21], which incorporates air temperature and snow. The formula estimates ice growth by balancing the heat flux from the ice surface to air with the heat flux required for the heat of fusion of ice as follows:
𝑑ℎ𝑖 𝑑𝑡
=
1 𝜌𝑖𝜆𝑇𝑚−𝑇𝑎 ℎ𝑠 𝑘𝑠+ ℎ𝑖 𝑘𝑖+ 1 𝐻𝑎 Eq. 1 where,
𝜌𝑖 is the density of ice (taken as 917 kg/m3)
𝜆 is the latent heat of fusion for ice (taken as 3.34×10⁵ J/kg) 𝑘𝑖 is the thermal conductivity of ice (taken as 2.24 W/m·°K)
𝑘𝑠 is the thermal conductivity of snow (taken as 3.2 × 10⁻⁶𝜌𝑠2, where 𝜌𝑠 is the density of snow and
ranging from 180 to 300 kg/m3)
ℎ𝑖 and ℎ𝑠24 are the thickness of the ice and snow cover, respectively
𝑇𝑚 and 𝑇𝑎 are the temperature at the ice/water interface(0°C) and air temperature some distance
above the snow surface, respectively
𝐻𝑎25 is a heat-transfer coefficient between the snow surface and air (taken as 25 W/m2 oK)
24 Parameter drops out of equation if there’s no snow data. 25 Parameter drops out of equation if there’s no snow data.
t is time
In other words, for ice growth to occur, heat needs to be removed from the water at the interface with the ice along the bottom surface. The heat gets transferred upward through the ice cover, then through the snow cover (if there is one). These two layers have different heat transfer capabilities. The main driving mechanism is the difference in temperature between the air and that at the ice/water interface. This process is captured by Eq. 1.
In the absence of snow data, Eq.1 becomes the following (also known as Stefan’s equation):
ℎ = 𝛼 √𝐹𝐷𝐷 Eq. 226
𝐹𝐷𝐷 = ∑(−𝐴𝑣𝑒𝑟𝑎𝑔𝑒 𝑑𝑎𝑖𝑙𝑦 𝑡𝑒𝑚𝑝𝑒𝑟𝑎𝑡𝑢𝑟𝑒) Eq. 3 where,
h is ice thickness in cm
𝐹𝐷𝐷 is freezing degree days, also known as the freezing index. It’s a common method used to quantify the severity of a given winter [22]. FDD is defined as the sum of the degrees of the number of days below 0⁰C, as per Eq. 3
𝛼 is an empirical coefficient (when using the above-mentioned values for ice density, thermal conductivity of ice, and latent heat of fusion for ice. α = 3.5 for when there is no snow, and the US Army Corps of Engineers recommends a number of 𝛼 values for different locations and snow conditions as shown in Table 3)
Condition Typical value for 𝜶
Windy lake with no snow 2.7 Average lake with snow 1.7-2.4 Average river with snow 1.4-1.7 Sheltered small river 0.7-1.4
Table 3: Typical α Values for Stefan’s Equation as Recommended by US Army Corps of Engineers [23]
The ice thickness (h) calculated from Eq. 1 or Eq. 2 (correlated and refined with historical data) is applied to Gold’s formula (Eq. 4) to calculate the maximum vehicle weight permitted as follows:
𝑃 = 𝐴ℎ2 Eq. 4
where,
P is the maximum allowable vehicle weight based on the ice thickness, in kg
A is an empirical coefficient, based on breakthrough observations (correlated with ice thickness). In Canada, a range of A is used depending on jurisdiction, road conditions, and operational requirement, from more conservative values of 3.5 to less conservative values of 7. A=4 has been selected for the purpose of this work, based on consultations with provincial government officials, in kg/cm2
h is ice thickness in cm