The application of “Decision Aids for
Tunneling (DAT)” to the Sucheon tunnel
in Korea
bySangyoon Min
Bachelor of Engineering in Mining and Mineral Engineering (1999) Inha University, Korea
Submitted to the Department of Civil and Environmental Engineering in Partial Fulfillment of the Requirements for the Degree of
Master of Science in Civil and Environmental Engineering at the
Massachusetts Institute of Technology September 2003
© 2003 Massachusetts Institute of Technology All rights reserved
Signature of Author………... Department of Civil and Environmental Engineering August 15, 2003
Certified by………. Herbert H. Einstein Professor of Civil and Environmental Engineering Thesis Supervisor
Accepted by………... Prof. Heidi Nepf Chairman, Department Committee on Graduate Studies
The application of “Decision Aids for
Tunneling (DAT)” to the Sucheon tunnel
in Korea
bySangyoon Min
Submitted to the Department of Civil and Environmental Engineering on August 15, 2003 in Partial Fulfillment of the Requirements for the Degree of
Master of Science in Civil and Environmental Engineering Abstract
The Decision Aids for Tunneling (DAT) allow engineers to simulate tunnel construction considering uncertainties in geology and construction processes for a given tunnel project and to obtain, as a result, distributions of the total cost and duration of tunnel construction. The DAT can be applied to every tunnel situation and can deal with any condition regarding a particular tunnel. The research presented in this thesis demonstrates the applicability and suitability of the DAT for the Sucheon tunnel in Korea.
For this study, several developments or modifications of the program, SIMSUPER (the computer code of the DAT) were made and many simulations were run with several case studies and some parametric studies. The different time-cost distributions and other results reflecting differences in tunnel construction were analyzed.
A new development of the DAT in form of calendars in SIMSUPER was made to be able to keep track of specific and real calendar dates.
This study on the DAT application to the real tunnel project in Korea can be a model for the future DAT applications in tunnel projects and this will also lead and accelerate further applications of the DAT to other tunnel projects.
Thesis Supervisor: Herbert H. Einstein
Acknowledgments
I would like to give special thanks to Prof. Einstein for all of his support and guidance. It has been my great honor to work with him.
I would like to thank Claude Indermitte for his help and patient explanations about the program during course of my research.
I also would like to thank Cedric Marzer and Christoph Haas for providing me with creative ideas for my research.
I am grateful to the KRRI and SKEC for providing financial support for this research and especially I wish to thank to Dr. Jun-Suk Lee and Dr. Taek-Kon Kim who provided me with some excellent engineering practices and advice.
I would like to thank my officemates, Jean Louis and Karim Karam for being such excellent officemates. My special appreciation is extended to my Korean colleagues and Geotech. colleagues: Yun, Taeyoung, Phillseung, Sunghwa, Joonsang, Brian and Pong for being my friends and making my life here enjoyable.
Finally, I owe my deepest gratitude to my parents in Korea. They have provided unconditional love and support.
Most importantly, I would like to give special thanks and love to my wife, Heeok Jung and my son, Henry Min for all the love, support and encouragement.
Table of Contents
Chapter 1. Introduction ...12
Chapter 2. The Sucheon tunnel project ...14
2-1. Tunnel Geology ... 17
2-2. Tunnel layout and geometries ... 21
2-3. Tunnel construction methods ... 23
Chapter 3. DAT simulations ...24
3.1. DAT simulation with initial data (study I)... 24
3-1-1. Geologic inputs ... 25
3-1-2. Tunnel geometries... 27
3-1-3. Tunnel construction inputs... 28
3-1-4. Simulations ... 30
3-1-4-1. The location of the chemical plant ... 30
3-1-4-2. The lining process... 32
3-1-4-3. Crossover tunnels ... 34
3-1-5. Initial simulation results and analyses for study I... 38
3-2. DAT simulation with follow-up data (study II)... 41
3-2-1. Additional information and modifications of input data... 41
3-2-2. Simulation results for study II ... 46
3-3. Study III – Final simulation with modifications of study II... 47
Chapter 4. Simulation results and analyses...52
4-1. Observation of the major sources of uncertainty in the Sucheon tunnel construction ... 53
4-1-1. Geology simulations and the uncertainty about geology... 53
4-1-2. Construction simulations and the uncertainty about construction methods ... 55
4-1-2-1. Variations of the method variables ... 55
4-1-2-2. Correlation of the method variables of the construction methods.. 57
4-1-2-3. Simulations with daily fluctuations (“each cycle”) or long-term averages (“one time”) ... 59
4-2. Analyses of the simulation results of the Sucheon tunnel considering two major
sources of uncertainty... 61
4-3. Analyses of the time-cost distributions of the Sucheon tunnel ... 69
4-3-1. Time-cost distributions of the left side of the main tunnel ... 69
4-3-2. Time-cost distributions of the right side of the main tunnel ... 74
4-3-3. Time-cost distributions of the lining tunnel ... 78
4-3-4. Time-cost distributions of the entire Sucheon tunnel ... 81
4-4. Time vs. position graphs ... 83
Chapter 5. Calendars ...86
5-1. Calendars in SIMSUPER ... 86
5-2. The structure of the “calendars”... 87
5-3. Calendar entries... 90
Chapter 6. Conclusions and perspectives...94
6-1. Conclusions ... 94
6-2. Critique and future extensions ... 97
Bibliography ...99
Appendix (Input data for DAT simulations) ...101
A. Definition of Areas and Zones... 102
B. Input for Parameter Sets and Parameters ... 105
C. Input for Deterministic Generation Mode ... 108
D. Input for Markov Generation Mode ... 113
E. Ground Class Distributions ... 132
F. Association of Geometries, Ground Classes and Methods... 137
G. Definition of Methods ... 142
H. Input for Activities... 152
List of Figures
Figure 1. Project area... 15
Figure 2. Plan view of the Sucheon tunnel... 16
Figure 3. Geology of the Sucheon tunnel ... 18
Figure 4. Geologic profile and tunnel layout of the Sucheon tunnel... 19
Figure 5. Tunnel layout... 20
Figure 6. Cross-sectional view of main tunnel ... 21
Figure 7. Cross-sectional view of emergency parking place... 22
Figure 8. Cross-sectional view of crossover for vehicles... 22
Figure 9. Location of the chemical plant... 31
Figure 10. “Heading and Bench” process used to model excavation and lining... 32
Figure 11. Tunnel network with a dummy and lining tunnel ... 33
Figure 12. Construction of crossover tunnels (cases 1 and 2) ... 35
Figure 13. Construction of crossover tunnels (cases 3 and 4) ... 37
Figure 14. Construction time distributions for case 1 and case 4... 40
Figure 15. Tunnel network for the DAT simulation in study II ... 45
Figure 16. Tunnel network for the DAT simulation – Study III ... 49
Figure 17. Construction of crossover tunnels... 51
Figure 18. Generated ground class profiles in the Sucheon tunnel ... 54
Figure 19. Relation between advance rate and cost for each construction method... 58
Figure 20. Setting A... 65
Figure 21. Setting B... 66
Figure 22. Setting C... 67
Figure 23. Setting D ... 68
Figure 24. Construction methods applied to the specific part of the left side of the main tunnel ... 71
Figure 25. Time-cost scattergrams for the left side of the main tunnel using “one time” simulation ... 72
Figure 26. Time-cost scattergrams for the left side of the main tunnel using “one time” simulations (if two tunnels have same length... 73
Figure 27. Time-cost scattergrams for the right side of the main tunnel using “one time”
simulation ... 76
Figure 28. Time-cost scattergrams for the right side of the main tunnel using “one time” simulation (if two tunnels have the same length ... 77
Figure 29. Time-cost scattergrams for the right side of the main tunnel using “one time” simulation (without lining) ... 79
Figure 30. Time-cost scattergrams for lining tunnels using “one time” simulation ... 80
Figure 31. Time-cost scattergrams for the Sucheon tunnel using “one time” simulation .... 82
Figure 32. Time vs. position graph (simulation with “each cycle”) ... 84
Figure 33. Time vs. position graph (simulation with “one time”)... 85
Figure 34. Structure of calendars... 88
Figure 35. Relationship between calendars and activities... 89
Figure 36. Calendar system ... 89
List of Tables
Table 1. Definition of the rock classification ... 17
Table 2. Construction methods “Patterns”... 23
Table 3. Areas ... 25
Table 4. Ground parameter states and ground parameter states ... 26
Table 5. Ground classes (*RC: rock classification)... 27
Table 6. Information on method variables in Study I (1: assumed values) ... 29
Table 7. The results of each case study in terms of time distribution... 38
Table 8. Range of values for the method variables... 41
Table 9. Method variables for “initial data” and “follow-up data” ... 43
Table 10. Results of the simulations for study II ... 46
Chapter 1. Introduction
Tunneling usually involves high degrees of uncertainty in geology and in the construction process. These uncertainties in tunneling need to be considered in decision making and they affect tunnel construction cost and time as well as resources.
The Decision Aids for Tunneling (DAT) allow engineers to simulate tunnel construction considering uncertainties in geology and construction processes for a given tunnel and obtain, as a result, distributions of the total cost and duration of tunnel construction.
In the application of the DAT for the Sucheon tunnel, we will demonstrate the applicability and suitability of the DAT for tunnel construction in Korea.
This study is conducted in three phase: 1. DAT simulation with present information. 2. Feedback from Korean client. 3. Final simulation.
The study in phase 1 was again divided into two parts; Study I: DAT simulation with initial data (see section 3-1) Study II: DAT simulation with follow-up data (see section 3-2)
Study III was performed in phase 3 considering the feedback from the Korean client including specific information on the construction processes and on some parameters. The thesis is structured as follows: Chapter 2 gives a brief description of the project and information for the DAT simulation. In Chapter 3, studies I, II and III will be presented with several cases and parametric studies and details on the simulation process. In Chapter 4, the results and analyses of the final simulations (study III) will be studied in more
DAT using calendars in SIMSUPER. Finally the conclusions drawn from this research and the perspectives for future research are developed in Chapter 6.
Chapter 2. The Sucheon tunnel project
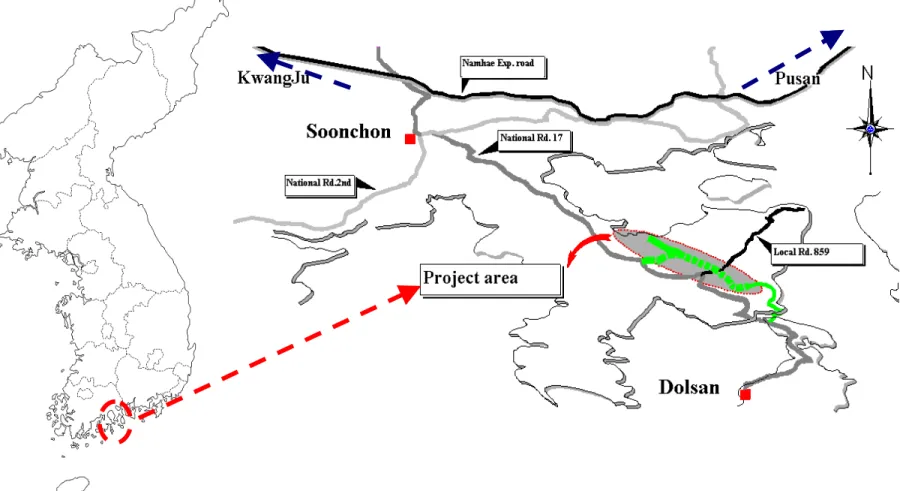
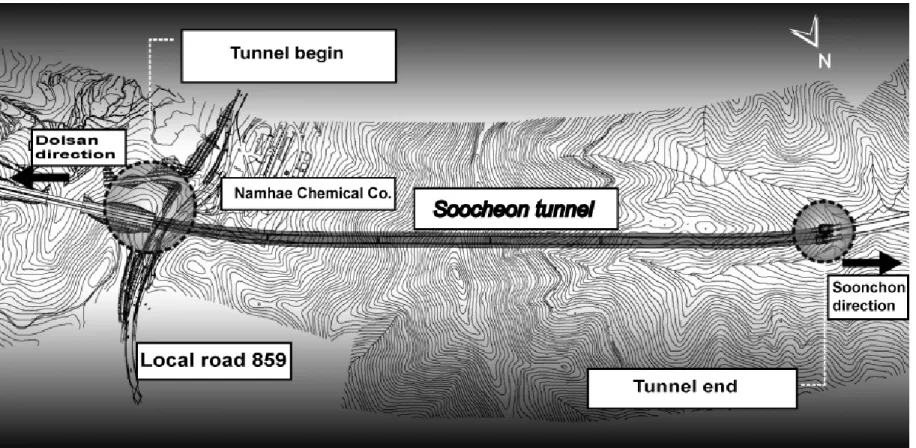
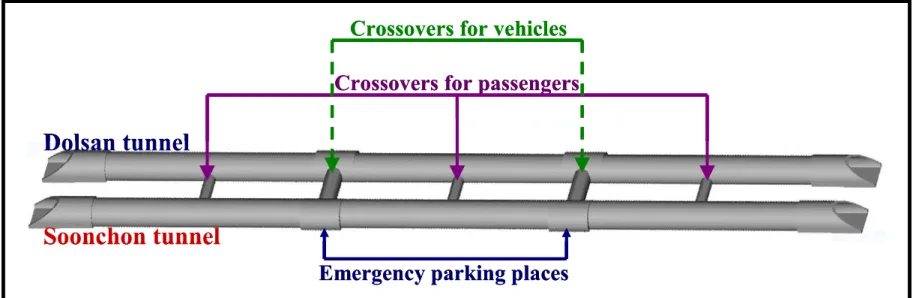
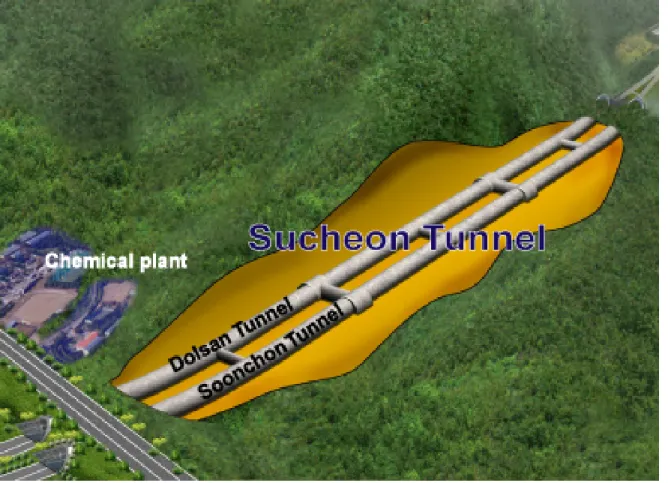
In this chapter, a brief description of the Sucheon tunnel project and information for the DAT simulation are presented. This includes the location of the Sucheon tunnel, tunnel layout, overall geology and tunnel support patterns. The project area is shown in Figure 1. The Sucheon is located between Dolsan and Soonchon in Korea as shown in Figure 1. The tunnel is a road tunnel and consists of two parallel tunnels (2 lane tunnels). One is built in the direction of Soonchon (the Soonchon tunnel) and the other is built in the direction of Dolsan (the Dolsan tunnel) as shown in Figure 2. The total length of the Sucheon tunnel is 1910m and the Dolsan tunnel is 1900m long.
2-1. Tunnel Geology
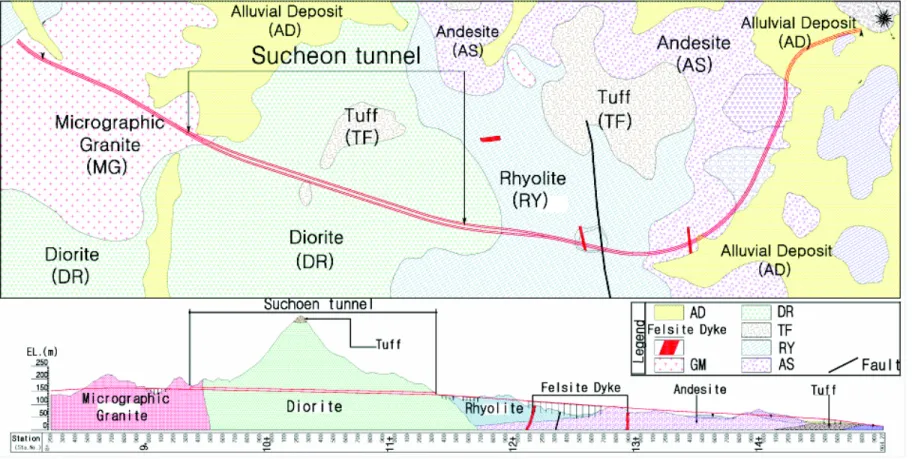
The geological conditions at the Sucheon tunnel are generally uniform and good. The geology of the Sucheon tunnel has been investigated using different methods such as borehole drilling, electrical resistivity surveys and seismic exploration. The geology of the Sucheon tunnel consists of two types of rock, namely “Micrographic Granite” and “Diorite”(Figure 3). Generally, both rock types have high strength.
As shown in Figure 3, “Diorite” is widely distributed throughout the entire tunnel area except in the tunnel portal area, where “Micrographic Granite” exists.
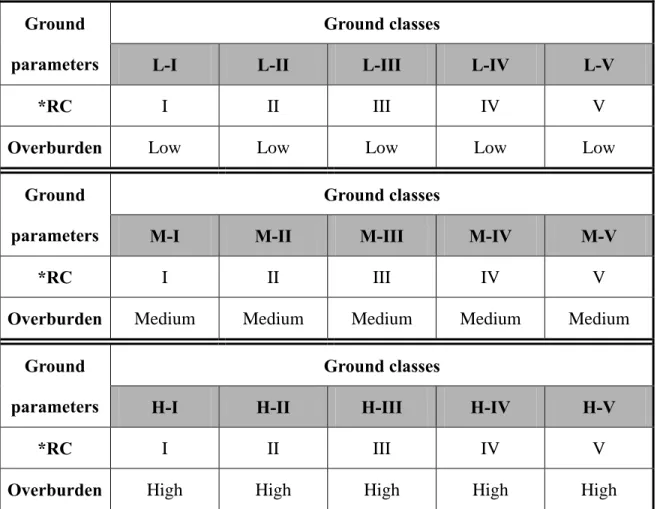
The geologic profile is shown in Figure 4. This also shows that the rock classification and overburden are the main geologic parameters for this tunnel. The rock classification shown in this figure was developed by Korean engineers and their assessment of the rock classification is based on the Electrical resistivity, RMR and Q values as shown in Table 1.
Ground parameter Ground parameter states
Rock classification I II III IV V RMR > 81 80 ~ 61 60 ~ 41 40 ~ 21 < 20 Resistivity (Ωm) > 3,000 1,000~3,000 300~1,000 100 ~ 300 < 100
Q-value > 40 4 ~ 40 1 ~ 4 0.1 ~ 1 < 0.1 Table 1. Definition of the rock classification
Crossovers for vehicles
Crossovers for passengers
Dolsan tunnel
Soonchon tunnel
Emergency parking places
Crossovers for vehicles
Crossovers for passengers
Dolsan tunnel
Soonchon tunnel
Dolsan tunnel
Soonchon tunnel
Emergency parking places
2-2. Tunnel layout and geometries
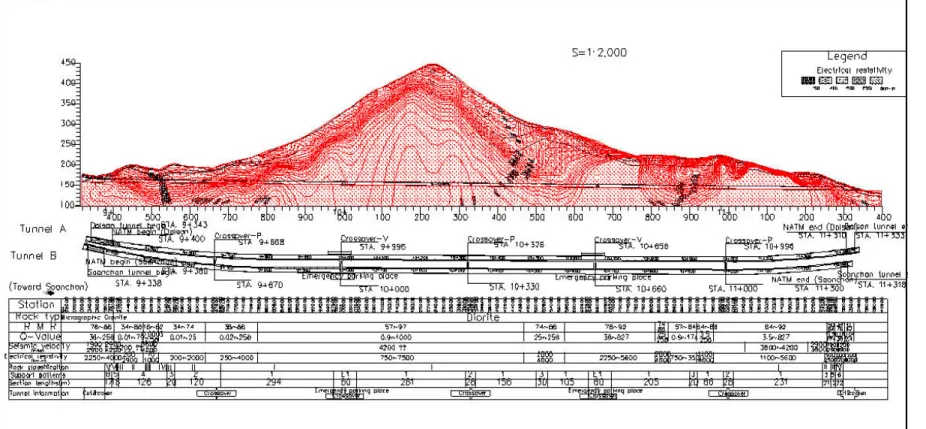
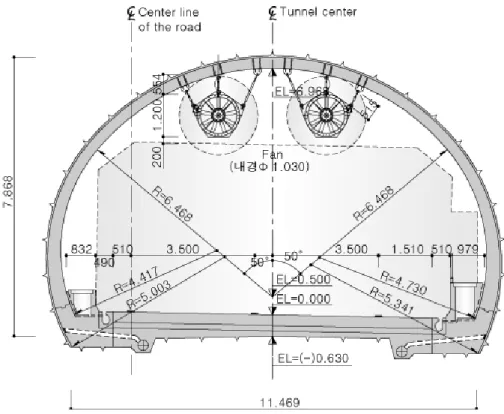
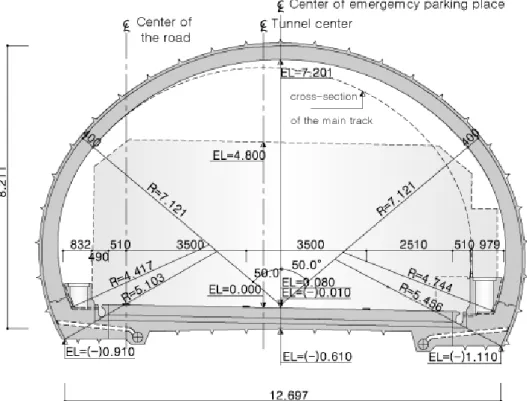
The tunnel layout is shown in Figures 4 and 5. The Sucheon tunnel consists of two parallel tunnels. There are five crossovers (two for the vehicles and three for the passengers) which are located between two parallel tunnels and two emergency parking places at STA. 10+100 and STA. 10+660. Basically, each tunnel has same geometry. The cross-sectional views of each tunnel, crossovers and emergency parking places are shown in Figures 6, 7 and 8. The two tunnels (the Dolsan/Soonchon tunnel) will be built along the same geologic profiles and with the same cross-sections.
Figure 7. Cross-sectional view of emergency parking place
2-3. Tunnel construction methods
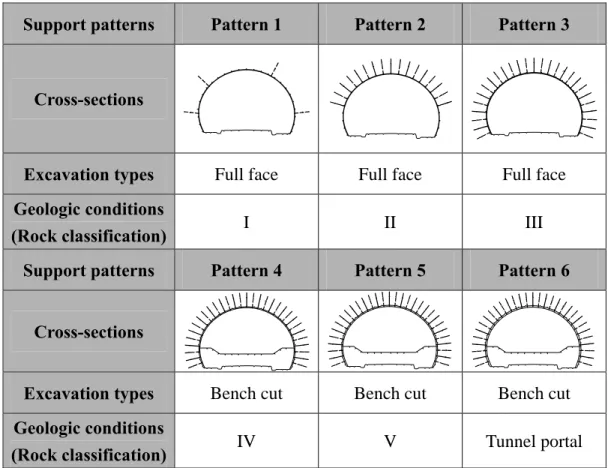
The NATM with drilling and blasting is used in the Sucheon tunnel. There are several tunnel support patterns, and they are selected considering the geologic conditions and geometries. Table 2 shows the cross-sections, excavation types and support patterns for tunnel construction, as well as geologic conditions such as rock classification or specific areas in which the specific support patterns are applied.
Support patterns Pattern 1 Pattern 2 Pattern 3
Cross-sections
Excavation types Full face Full face Full face Geologic conditions
(Rock classification) I II III
Support patterns Pattern 4 Pattern 5 Pattern 6
Cross-sections
Excavation types Bench cut Bench cut Bench cut Geologic conditions
(Rock classification) IV V Tunnel portal
Table 2. Construction methods “Patterns” (include tunnel support patters and excavation types)
Chapter 3. DAT simulations
In this study, the applicability and suitability of the DAT for tunnel construction in Korea is demonstrated. As mentioned earlier the study is conducted in three phases: 1. DAT simulation with present information. 2. Feedback from Korean client. 3. Final simulation. The study in phase 1 was again divided into two parts;
Study I: DAT simulation with initial data (see section 3-1) Study II: DAT simulation with follow-up data (see section 3-2)
Study III was performed in phase 3 considering the feedback from the Korean client including specific information on the construction processes and on some parameters such as method variables.
Each of three studies will be presented in this chapter.
3.1. DAT simulation with initial data (study I)
In this section, the DAT simulation with initial data will be presented. The initial information provided by the Korean client was relatively limited, especially some detailed information on geologic parameters, construction methods and their advance rates and unit costs, tunnel construction sequences and tunnel dimensions were not available. Therefore, several assumptions were made regarding these unknown data. Also since information on construction costs was not provided, tunnel construction simulation and the analyses of the
The basic input data for the simulations are summarized in the following sections 3-1-1 to 3-1-3, and the simulation process will be explained in section 3-1-4. Details on geology and construction input data for the Sucheon tunnel are attached at the end of this thesis (See Appendix).
3-1-1. Geologic inputs
The geology of the Sucheon tunnel is divided into 8 so-called “areas” which are the top level of input data for the geologic simulations (Table 3) in the DAT. The “NATM start” and “NATM end” sections were introduced to represent slow advance rates regardless of the geology which was the same as in the adjacent main tunnel section; this is facilitated by assigning separate areas to these sections. Similar reasons led to assigning separate areas to each of the crossover tunnels.
Area name (Length) Description
1. Begin (L = 85m) NATM start section 2. Soonchon-Dolsan (L = 1,835m) Main tunnel section 3. End (L = 50m) NATM end section
4. Co1_P (L = 18.2m) Crossovers for passengers 5. Co2-V (L = 17.6m) Crossovers for vehicles 6. Co3_P (L = 18.2m) Crossovers for passengers 7. Co4-V (L = 17.6m) Crossovers for vehicles 8. Co3_P (L = 18.2m) Crossovers for passengers
The 8 areas in turn are subdivided into 23 zones considering the geology. The zone is the basic unit of geology in the DAT and the extent of each zone is defined deterministically in this study. The zones are defined here by assigning a ground parameter set to each; a ground parameter set in turn is defined by two parameters, namely overburden (high, medium and low) and rock classification (I~V) with the parameter states shown in Table 4. The rock classification parameters and parameter states are probabilistically defined. With the geology input, one can obtain the ground classes which are a particular combination of parameter states (see Table 5) and resulting ground class profiles that describe the ground conditions along the tunnel. These ground classes will ultimately be used to determine the construction methods that are used to construct a tunnel.
Ground parameter Ground parameter states
Rock classification I II III IV V RMR > 81 80 ~ 61 60 ~ 41 40 ~ 21 < 20 Resistivity (Ωm) > 3,000 1,000~3,000 300~1,000 100 ~ 300 < 100
Q-value > 40 4 ~ 40 1 ~ 4 0.1 ~ 1 < 0.1
Overburden Low Medium High
Elevation (m) 200< 200~250 >250
Table 4. Ground parameter states and ground parameter states
Ground classes Ground
parameters L-I L-II L-III L-IV L-V
*RC I II III IV V
Overburden Low Low Low Low Low
Ground classes Ground
parameters M-I M-II M-III M-IV M-V
*RC I II III IV V Overburden Medium Medium Medium Medium Medium
Ground classes Ground
parameters H-I H-II H-III H-IV H-V
*RC I II III IV V
Overburden High High High High High
Table 5. Ground classes (*RC: rock classification)
3-1-2. Tunnel geometries
Construction methods are determined by the combination of a particular ground class and tunnel “geometry”. 10 tunnel “geometries” are defined for the DAT simulation. A separate “geometry” is assigned to the main tunnels, the start and end of the tunnels, the emergency parking places, the crossover tunnels and the lining. The assignment of different tunnel “geometries” for the same geology allows one to specify different construction methods for the same geology (e.g. the start and end of the tunnel and lining). In some special cases, the
tunnel “geometry” can be used to consider environmental effects (e.g. the existence of the chemical plant near the specific part of the Dolsan tunnel). This case will be explained in section 3-1-4-1.
3-1-3. Tunnel construction inputs
A construction method specifies method variables such as the round (cycle) length, advance rate and cost. The mean values of advance rates for each construction method are shown in Table 6. The cross-sections and excavation types of construction methods, “patterns 1~6” were shown in Table 2. “Patterns 2-1, 2-2 and 2-3” have the same cross-sections and excavation types as “pattern 2” has but they have different advance rates than “pattern 2”. “Pattern EPP” is a construction method for the emergency parking places, and the cross-section of emergency parking places was shown in Figure 7. “Crossover_v” and “Crossover_p” are construction methods for crossovers for vehicles and passengers, respectively, and they have different geometries and method variables (the cross-section of the crossover for vehicles was shown in Figure 8).
However, the advance rates for “pattern 2-2, 2-3, Crossover_v and Crossover_p” were not available in study I and hence they were assumed. The costs for each construction methods were not available in study I as well.
Method variables Method variables Construction
methods
Mean adv. Rate
(meter/day)
Mean cost
(cost/meter)
Construction methods
Mean adv. Rate
(meter/day)
Mean cost
(cost/meter)
Pattern 1 3.61 N/A Pattern 4 (Bench cut) 1.91 N/A
Pattern 2 3.50 N/A Pattern 5 (Bench cut) 0.58 N/A
Pattern 2-1 3.16 N/A Pattern 6 (Bench cut) 1.44 N/A
Pattern 2-2 1
N/A(1.2) N/A Pattern EPP 3.08 N/A Pattern 2-3 1
N/A(1.0) N/A Lining 10/3 N/A
Pattern 3 2.92 N/A
Crossover_v
Crossover_p
1
N/A(2.0) N/A
3-1-4. Simulations
Several developments of the program (SIMSUPER) were made for this project. They are related to three issues:
Existence of a chemical plant near the Dolsan tunnel Representing the lining process
Construction of 5 crossover tunnels
Several cases studies were carried out to consider these three factors.
3-1-4-1. The location of the chemical plant
As the chemical plant is located near the left side of the Dolsan tunnel (See Figure 9), the cycle lengths and explosive charge per hole have to be reduced to minimize blasting vibration and noise due to tunnel construction. Considering this, different construction methods (i.e. “patterns 2-2 and 2-3”), which have lower advance rates than “patterns 2 and 2-1” that are applied in the corresponding part of the tunnel in the Soonchon direction, have to be applied in this section of the Dolsan tunnel. Since the advance rates of “patterns 2-2 and 2-3” were not provided, we assumed that “pattern 2-2 and 2-3” have lower advance rates than “patterns 2 and 2-1” as shown in Table 6.
Since construction methods can be specified by a combination of ground class and geometry, different construction methods can be used in tunnel sections that have the same geologic conditions (i.e. ground class) by specifying different geometries. Therefore, an
neighborhood of the chemical plant. As a consequence, the Dolsan tunnel has a greater total construction time than the Soonchon tunnel.
3-1-4-2. The lining process
Since the Sucheon tunnel (Soonchon/ Dolsan tunnel) is relatively short, we assume that the lining will be built after the entire tunnel is excavated. Two different ways can be used to represent the lining process in a tunnel. First, this can be dealt with by using the “Heading and bench” feature of the DAT. This assumes that a tunnel cross section is divided into two parts with one part (the “main tunnel”) driven ahead of the other (the “lining tunnel”) as shown in Figure 10. In order to perform the lining process after the entire main tunnel is excavated, one has to define the minimum and the maximum distance between the leading heading and the following heading (“distance x” in Figure 10) as the total length of the main tunnel. As a consequence, the following heading, the “lining tunnel” will start after the leading heading, the “main tunnel” is excavated.
“Main tunnel” (Leading heading) “Lining tunnel” (Following heading) Distance x “Main tunnel” (Leading heading) “Lining tunnel” (Following heading) “Main tunnel” (Leading heading) “Lining tunnel” (Following heading) Distance x Distance x
One can also represent the lining process by defining it as a different construction method in an imaginary “lining tunnel”. As shown in Figure 11, the lining tunnel is connected by a “dummy tunnel” to the main tunnel. The lining tunnel will be driven after the main tunnel is excavated. The second approach has been chosen for representing the lining process in this study because the main tunnel consists of several sub-tunnels and the second approach is simpler to simulate.
3-1-4-3. Crossover tunnels
The simulation of crossover tunnel construction is another important factor that needs to be considered. Four case studies were performed with different approaches to simulate the construction of the five crossovers, which connect the Dolsan tunnel with the Soonchon tunnel as show in Figure 5.
• Cases 1 and 2
In case 1, five crossover tunnels are connected to the end of the lining tunnel in the Dolsan direction (see Figure 12). Each crossover tunnel consists of a crossover tunnel, a dummy tunnel and lining tunnel. Also each crossover tunnel has a different construction method depending on the ground classes where each tunnel is driven. In case 2, the structure of the tunnel network is similar to case 1. If all crossover tunnels have the same construction method regardless of the geology where they are driven and the construction of all crossover tunnels starts at the same time, one “crossover tunnel” can represent all 5 crossover tunnels. This case makes the tunnel network much simpler than the one used in case 1 as shown in Figure 12. Both case 1 and case 2 represent cases in which the crossover tunnels are built after the main tunnel is excavated and lined.
<Case 1>
<Case 2>
<Case 1>
<Case 2>
• Cases 3 and 4
In these cases, each crossover tunnel is simulated at its actual location between the Dolsan tunnel and the Soonchon tunnel. It is assumed that the construction of each crossover tunnel advances toward the tunnel in the Soonchon direction as shown in Figure 13. Each crossover tunnel should reach nodes 1~5 respectively after the tunnel in the Soonchon direction reaches each node. There are two ways to make this possible. First, one can allocate a time delay or position delay to each crossover tunnel to make sure each crossover tunnel reaches nodes 1~5 after the tunnel in the Soonchon direction reaches each node. One can also change the locations of the beginning point of each crossover tunnel toward the right (about the length of 30m is added to the actual locations of each crossover tunnel). This would delay the construction of crossover tunnels and this is shown with 5 oblique lines representing the crossover tunnels in case 3 (Figure 13).
However, as discussed before, the Dolsan tunnel does have a greater construction time compared to the Soonchon tunnel due to the existence of the chemical plant. Given this fact and the fact that crossover construction time is relatively short, such an “artificial” delay may not be necessary and the simulation can be done without any manipulation as represented by the orthogonal lines for the crossover tunnels in case 4 (Figure 13).
In each of the cases, 3 and 4, the activity network for each crossover tunnel has a “two heading option”. The leading heading represents the tunnel excavation process and the following heading represents the lining process.
<Case 3>
<Case 4>
<Case 3>
<Case 4>
3-1-5. Initial simulation results and analyses for study I
Several simulations were performed to consider all the factors mentioned in sections 3-1-4-1 to 3-3-1-4-1-4-3, namely the location of the chemical plant adjacent to the Dolsan tunnel, the lining process and several possible tunnel networks with different crossover simulations. Even if the initial input data are quite limited, one can simulate tunnel construction and analyze the result in terms of construction duration. Table 7 shows the results of 400 simulations for cases 1, 2 and 4. The effect of the chemical plant and the lining process were considered in the same way in all cases. The total construction times are tabulated and compared in terms of minimum, mean and standard deviation values. Case 3 was not considered because the “artificial” delay of case 3 was not necessary.
Construction duration (days) Case Number of
simulations Min. Mean Max. Stdev.
Case 1 400 1221 1316 1449 39
Case 2 400 1190 1310 1427 43
Case 4 400 1153 1300 1436 42
Since the results of the simulation do not include the total construction cost of the tunnel, one can analyze the simulation results only in terms of the tunnel construction duration. The time-frequency histograms for cases 1 and 4 are shown in Figure 14 and these two histograms show the construction time distribution. The time distribution for each case can be used to determine the probability of completing the project within a specific time. Hence, this figure could be used to compare each case with a completion deadline.
Supposing that the completion deadline is 1300 days (the expected completion deadline was not provided by the Korean client), the probability of completing the construction with case 1 within 1300 days is 0.38 and this probability for case 4 is 0.52. Therefore, case 4 has a greater chance to complete the tunnel construction within 1300 days. If a case cannot meet the completion deadline, one needs to find ways to accelerate the construction.
3-2. DAT simulation with follow-up data (study II)
In study II (phase 1), additional and important information such as cost for each construction method, construction-related variables, tunnel excavation directions and sequencing of tunnel construction were provided by the Korean client. With this information, one could obtain not only the construction time distribution but also the construction cost distribution. Some modifications of the input data had to be made for this study.
3-2-1. Additional information and modifications of input data
• The geologic input data were not changed since no additional geologic information was provided (see Appendix for details on geologic input data).
• Cost information for each construction method is now available and has been defined probabilistically within the DAT. Table 8 shows how the minimum and the maximum values of the cost variables and advance rates for each construction method are defined.
Type of variables Minimum values Maximum values Cost variables (cost/meter) 95% of the mode values 105% of the mode values
Advance rate (meter/day) 95% of the mode values 115% of the mode values Table 8. Range of values for the method variables
• The comparisons of method variables between initial data (study I) and follow-up data (study II) are shown in Table 9. As shown in Table 9, all cost information became available and most of advance rates were changed in study II compared to study I. Advance rates for the upper (heading) and lower (bench) part of the patterns 4, 5 and 6 are provided as well. As mentioned in section 3-1-3, “patterns 2-1, 2-2 and 2-3” have the same cross-section as “pattern 2” but each of them has different advance rates from “pattern 2”. “Pattern EPP” is used for emergency parking places. The advance rates and costs for “Crossover_v” and “Crossover_p” were available in study II as shown in Table 9.
• Actual advance rates for the tunnel support patterns 2-2 and 2-3 were provided as shown in Table 9. Before this information was available i.e. in study I (refer to section 3-1-4-1), it was assumed that tunnel support patterns 2-2 and 2-3 would have lower advance rates based on given information on cycle lengths. This was done because patterns 2-2 and 2-3 were the construction methods in the Dolsan tunnel which consider the location of the chemical plant.
Therefore, in study I, the total construction time of the Dolsan tunnel was a bit greater than that of the Soonchon tunnel. However, the new advance rates for patterns 2-2 and 2-3 are greater than the values that we assumed earlier. In other words, even if the physical cycle lengths (meter/cycle) of these methods are short, the advance rates (meter/day) of these methods are not low as assumed in study I. This is because 2 or 3 sets of blasting can be done in a day without affecting the chemical plant. More details will be given in Chapter 4.
Initial data (study I) Follow-up data (study II) Construction
methods Mean advance rate (meter/day)
Mean cost (won/meter)
Mean advance rate (meter/day) Mean cost (won/meter) Pattern 1 3.61 N/A 3.60 6,848,009 Pattern 2 3.50 N/A 3.51 7,570,405 Pattern 2-1 3.16 N/A 3.12 7,570,405 Pattern 2-2 1 N/A (1.2) N/A 2.94 7,570,405 Pattern 2-3 1 N/A(1.0) N/A 2.78 7,570,405 Pattern 3 2.92 N/A 2.96 7,969,888 2.68 (heading) Pattern 4
(bench cut) 1.91 N/A 6.56 (bench)
10,140,761 2.40 (heading) Pattern 5 (bench cut) 0.58 N/A 4.73 (bench) 11,194,954 2.18 (heading) Pattern 6
(Bench cut) 1.44 N/A 4.31 (bench)
11,944,117 2 Pattern EPP 3.08 N/A 3.12 7,202,979 Lining 10/3 N/A 313.32 4 Crossover_v 1 N/A (2.0) N/A 6.03 2,603,867 Crossover_p 1 N/A (2.0) N/A 8.64 2,603,867 Table 9. Method variables for “initial data” and “follow-up data”
1: assumed values, 2: patterns for emergency parking places, 3: 6.67m/day for study III
• The crossover tunnels will be built together with the main tunnel as shown in Figure 15. Hence crossover tunnels in the DAT simulation are represented at their actual locations as in case 4 in study I. Lengths of each crossover tunnel and advance rates of the crossover tunnels were specified according to the new information in study II (see Table 9). The two types of crossover tunnels (vehicles/ passengers) have different geometries (e.g. cross-sections and lengths) and different advance rates and costs from each other. These facts are considered in the DAT simulation.
• The simulation of the lining tunnel was also changed. The actual construction of the lining is divided into 4 parts performed simultaneously with an advance rate of 3.33 meter/day. Hence the estimated time for the lining construction was 4 times smaller than the time in study I. Instead of having 4 separate lining tunnels in the tunnel network, one lining tunnel with the advance rate that is 4 times greater (13.32 meter/day) than the actual advance rates (3.33 meter/day) is used. However, based on new information, this lining tunnel itself needs to be divided into several sub-tunnels in the DAT simulation because each construction method has a slightly different lining method (each lining method has the same mean value of advance rate (13.32 meter/day), but different mean values of cost). In study I, only one construction method was assigned to the entire “lining tunnel”.
Lining tunnels Lining tunnels Dolsan tunnel Soonchon tunnel STA. 9+720 Dummy tunnel Dummy tunnel Crossover tunnels Lining tunnels Lining tunnels Dolsan tunnel Soonchon tunnel STA. 9+720 Dummy tunnel Dummy tunnel Crossover tunnels
Figure 15. Tunnel network for the DAT simulation in study II
• The information for study I showed that the both tunnels (the Dolsan/ Soonchon tunnel) would be excavated in one direction and the tunnel network was structured correspondingly. The new information, however, shows that both tunnels will be excavated from both ends and the two sides of the tunnel will meet at STA. 9+720 as shown in Figure 15. During construction, if one side of tunnels reaches this point this tunnel will not be excavated any further. Considering construction from both ends, the total construction time will be reduced compared to that of study I.
3-2-2. Simulation results for study II
Table 10 shows the result of 900 simulations in study II.
Minimum Mean Maximum
Total construction time (days) 627 646 673
Total construction cost (won) 32,508,212,367 32,703,345,453 33,321,817,213 Table 10. Results of the simulations for study II
* The client’s estimation: total construction time: 605 days; total construction cost:30,476,527,822 won
Because of the fact that the tunnel will be excavated from both ends and based on the new information that the estimated time for the lining construction is 4 times smaller than that of study I, the total construction time is considerably reduced compared to the total construction time obtained from study I. Total construction time and cost can be compared with the client’s estimation. Both the total construction time and the total construction cost estimated with the DAT are greater compared to the Korean client’s estimation.
3-3. Study III – Final simulation with modifications of study II
There was some new information and feedback from Korean client in phase 2 which were considered in study III. Study III was done based on study II, however, there are some modifications of input data in study III and several features of the DAT have been modified in study III. Also, some parametric studies have been done in study III. Details will be explained in the following section and Chapter 4.
• The location where the two sides of the tunnel will meet has been changed from STA. 9+720 to STA. 10+010. As a consequence, the tunnel network for the final simulation is slightly changed as shown in Figure 16. One can notice that there are two crossover tunnels at the left side of the main tunnel while there was only one crossover tunnel at the left side of the main tunnel in study II.
• The lining process was considered differently in studies I and II. In study I, one lining tunnel was built from one end of the main tunnel to the other with the advance rate of 3.33 meter/day, in study II, however one lining tunnel with the advance rate of 13.32 meter/day, which was 4 times greater than the actual advance rate; was built to simulate the case in which the actual lining construction is performed at 4 different locations.
According to the new information in study III, the lining tunnel will be built from both ends with the actual advance rate of 3.33 meter/day (the actual advance rate for the lining is same for all studies). Since each lining method has the same advance rate, if the advance
rate for the all lining methods is doubled (6.66 meter/day), this can reflect the fact that the lining tunnel is built from the both ends. Hence the lining tunnel will be simulated in one direction (red-dashed lines) with a doubled advance rate in the final simulation (study III) as shown in Figure 16.
Dolsan tunnel
Soonchon tunnel
Crossover
tunnels
STA. 10+010 Lining tunnels Lining tunnels Lining direction Dummy tunnel Dummy tunnelDolsan tunnel
Soonchon tunnel
Crossover
tunnels
STA. 10+010Dolsan tunnel
Soonchon tunnel
Crossover
tunnels
Dolsan tunnel
Soonchon tunnel
Crossover
tunnels
STA. 10+010 Lining tunnels Lining tunnels Lining direction Dummy tunnel Dummy tunnel• In study I, it was assumed that the Dolsan tunnel has a greater construction time than the Soonchon tunnel due to the effect of the chemical plant and as a consequence, any artificial delay was not necessary. However, as mentioned before, the main tunnel is divided into two parts and in fact, there is little effect of the chemical plant on the advance rates of the construction methods that are applied to the specific part of the Dolsan tunnel (see section 3-2-1 and Chapter 4). Therefore, the “position delay” needs to be applied at the beginning of each crossover tunnel to make sure that the Soonchon tunnel reaches each node, “a~e” (Figure 17) before each crossover tunnel reaches it (The “position delay” can delay construction of a specific tunnel at a specific location of this tunnel for a given duration of delay). Durations of the delays for each crossover tunnel are determined by the time to reach “1~5 (the beginning of the crossover tunnels)” in the Dolsan tunnel and time to reach “a~e (the end of the crossover tunnels)” in the Soonchon tunnel (Figure 17). Larger duration delays need to be applied to two crossover tunnels in “part A” compared to the three crossover tunnels in “part B” because the left side of the Soonchon tunnel begins 20 meter ahead (is 20 meter longer) of the left side of the Dolsan tunnel in “part A” (Figure 17) and there is little effect of the chemical plant (the left side of the Soonchon tunnel reaches nodes a and b much later than the left side of the Dolsan tunnel reaches nodes 1 and 2 while the right side of the Dolsan tunnel reaches nodes c, d and e later than the right side of the Soonchon tunnel reaches nodes 3, 4 and 5).
Dolsan tunnel
Soonchon tunnel
Crossover
tunnels
Lining tunnels Lining tunnelsPart A
Part B
1
2
3
4
5
a
b
c
d
e
Dolsan tunnel
Soonchon tunnel
Crossover
tunnels
Lining tunnels Lining tunnelsDolsan tunnel
Soonchon tunnel
Crossover
tunnels
Dolsan tunnel
Soonchon tunnel
Crossover
tunnels
Lining tunnels Lining tunnelsPart A
Part B
1
2
3
4
5
a
b
c
d
e
Chapter 4. Simulation results and analyses
In this chapter, the results and analyses of the final simulations (study III) will be studied. First, two major sources of uncertainty (the uncertainty about geology and about the construction methods) will be studied to find out how these two sources of uncertainty contribute to the overall uncertainty in the time-cost distributions of the Sucheon tunnel. Four different sets of simulations will be analyzed and compared to each other in this regard. Finally, the time-cost distributions for each side of the main tunnel and the lining tunnel will be examined separately before the overall simulation results for the Sucheon tunnel are discussed.
4-1. Observation of the major sources of uncertainty in the
Sucheon tunnel construction
There are two major sources of uncertainty in the DAT: z the uncertainty about geology
z the uncertainty about construction methods
Of these two sources of uncertainty, the former is associated with the uncertainty in zones or ground parameter states which are defined using the Markov mode or the Semi-deterministic mode and the latter is related to the variations of method variables (e.g. advance rates and cost per length). In addition, there are also tunnel-related uncertainties such as “delays” and “fixed costs”; in this study, however, this source of uncertainty is not considered.
4-1-1. Geology simulations and the uncertainty about geology
The uncertainty about geology can be observed by looking at the results of the geology simulations. The ultimate goal of the geology simulation is to generate the ground class profiles. The ground class profiles implicitly involve the uncertainty about geology which is mainly caused by the uncertainty in zone lengths or the Markov parameters. Hence, it is possible to determine how much the uncertainty about geology contributes to the overall uncertainty in tunnel construction (e.g. the distributions of the total construction time and cost) by examining the generated ground class profiles.
Figure 18 illustrates the possible portions of ground class profiles in the Sucheon tunnel (since all geology input data for studies I, II and III are same, the generated ground class profiles are applicable to any of three studies). This figure shows that there is a large variability in the generated ground class profiles. For instance, the ground class, “H-I” can be generated with the probabilities of 8.44% to 26.33%.
Min, Mean and Max percentages of ground classes generations (the Sucheon tunnel)
6.99 2.61 5.12 0.51 5.37 7.95 0.95 8.44 11.22 0.46 11.44 8.13 8.37 1.55 13.20 15.26 3.21 18.62 18.30 1.60 15.94 14.14 12.21 2.38 20.53 24.14 6.05 26.63 29.06 4.69 0.31 0.00 0.00 0.00 0.00 0.53 0.00 5.00 10.00 15.00 20.00 25.00 30.00 35.00
L-I L-II L-III L-IV L-V M -I M -II M-III M -IV M -V H-I H-II H-III H-IV H-V
Ground classes Pe rc e n ta g e ( % ) Min Mean Max
Figure 18. Generated ground class profiles in the Sucheon tunnel (Refer to Table 5 in section 3-1-1 for the definition of each ground class)
4-1-2. Construction simulations and the uncertainty about construction
methods
There are several factors that are associated with the uncertainty about construction methods:
• Variations of the method variables • Correlation of the method variables
• Simulations with daily fluctuations (“each cycle”) or long-term averages (“one time”) Each of these three factors can be specified for the construction simulation in the DAT. In the following sections 4-1-2-1 ~ 4-1-2-3, each of these factors will be explained in detail.
4-1-2-1. Variations of the method variables
The uncertainty about construction methods is mainly caused by the uncertainty in the method variables such as advance rate and cost per length. Since construction will be simulated through the generated ground class profiles, the construction methods which are applied to a particular geologic condition change as the generation of the ground class profiles varies. However, if the geology is fixed (or deterministic), the construction methods which are applied to the given geologic condition are also fixed but the method variables may vary. This can be considered as a case in which only the uncertainty about the construction method variables is considered. In other words, the ranges of values for the method variables are the only source of uncertainty.
As shown in Table 8 (see section 3-2-1), for the Sucheon tunnel, the range of values for advance rates is greater than the range of values for costs per length for every construction method. As a consequence, if only the uncertainty of the method variables is considered for the simulation, the uncertainty in the total construction time (i.e. the time distribution) would be greater than the uncertainty in the total construction cost (i.e. the cost distribution).
4-1-2-2. Correlation of the method variables of the construction methods
The correlation of the method variables in a specific construction method can be specified in the DAT. For example, time-related variables (e.g. advance rates) and cost-related variables (e.g. cost per length) can be positively or negatively correlated or can be uncorrelated. E.g. if advance rates and cost per length (meter) are negatively correlated, the time increases with cost. For this study, the advance rate and cost per length (meter) for every construction method are negatively correlated.
In addition, generally, if a specific construction method has a higher cost and lower advance rate than others or vice versa, the total construction cost is proportional to the total construction time. The relation between advance rates and costs for each construction method in the Sucheon tunnel shows this correlation as shown in Figure 19. As a consequence, one can expect that the total construction time would increase with the total construction cost.
As a result, the two facts mentioned above will affect the trend of time-cost scattergrams for a given tunnel construction.
4-1-2-3. Simulations with daily fluctuations (“each cycle”) or long-term averages (“one time”)
The values of method variables (e.g. advance rates and cost per length) are usually subject to daily fluctuations. This is, however, only one source of the uncertainty. The average value around which they fluctuate can be also uncertain. In fact, the effect of daily fluctuations in long tunnels cancels out and only the uncertainty about the long-term average is important. On the other hand, in short tunnels, the effect of daily fluctuations can outweigh the uncertainty about the long-term average.
The DAT can accommodate both situations for the construction simulation and hence, the DAT can evaluate the values of the method variables in two ways.
If one simulates tunnel construction with the daily fluctuation option called “each cycle”, the simulator plays a lottery for the method variables in every round of the simulations anew. Therefore, the distributions for these variables represent the range of fluctuations from cycle to cycle. The cost-related methods variables (e.g. cost per length) and time-related method variables will average out in the same manner during every single simulation.
If tunnel construction is simulated with the long-term averages option called “one time” in the program, the simulator plays lottery for the method variables only once at the beginning of each simulation. Therefore, during any particular simulation, the advance rates and cost per length associated with any cycle of such a construction method remain constant. This describes the uncertainty about the long-term average. One of these two options can be
chosen for each tunnel individually. Therefore, it is possible to use “each cycle” option for a short shaft tunnel and “one cycle” options for a long main tunnel.
The effect of the “each cycle” option and “one time” option can be compared directly only when the uncertainty about the geology is not involved in the overall uncertainty in the time and cost distributions (e.g. when a given geologic condition is the same or fixed). This is so because the uncertainty in the time or cost distribution of the simulations with the two options are affected in the same way by the uncertainty about geology and therefore, the uncertainty in the time or cost distribution (or both) which is caused by the uncertainty about geology can outweigh the effect of the “each cycle” option.
4-2. Analyses of the simulation results of the Sucheon tunnel
considering two major sources of uncertainty
It is interesting to analyze and compare the simulations results (e.g. the time and cost distributions) considering the two sources of uncertainty (e.g. uncertainty about geology and uncertainty about construction methods). Four different settings for the simulations are used in order to find out how each of these two sources of uncertainty contributes to the overall uncertainty in the time-cost distributions of the Sucheon tunnel. These four different simulations were run based on information and input data used in study III. Table 11 shows the four different simulation settings.
settings Options for the method variables Number of geology simulations Number of construction simulations Uncertainty about geology Uncertainty about construction methods A “one time” 1000 1 Yes Yes B “one time” 1 1000 No Yes C “each cycle” 1000 1 Yes No D “each cycle” 1 1000 No No
Setting A includes all sources of uncertainty. Setting B includes only uncertainty about construction method (e.g. method variables) since all construction simulations are run with the same geologic condition. Setting C includes only uncertainty about geology.
Setting D excludes all source of uncertainty since all construction simulations are run with the same geology and if simulations are run with the “each cycle” option, all method variables are considered to represent daily fluctuations and they will almost perfectly average out during every single simulation. Therefore, one can assume that every simulation uses the same values of the method variables.
If only uncertainty about construction methods is considered for the simulations (e.g. “setting B” in Figure 21), the time distribution is greater than the cost distribution. Since all construction simulations are run with the same geologic condition, the uncertainty in time and cost depends on the variability of values of method variables. As mentioned in section 4-1-2-1, since the variability of values for advance rates is greater than the variability of values for cost per length, there is a greater uncertainty in the time distribution than in the cost distribution. However, if only uncertainty about geology is considered for the simulations (e.g. “setting C” in Figure 22), the cost distribution dominates the time distribution. Since all geology simulations are run with the same construction simulation, the uncertainty about the time and cost depends on the differences between method variables of different construction methods which are related to the range of possible geologic conditions. Since the difference between costs of different construction methods is considerable while the difference between advance rates of different construction methods is fairly small, there is a greater uncertainty in the cost distribution than in the time
distribution.
If all sources of uncertainty are considered in the simulations (e.g. “setting A” in Figure 20), the time distribution follows the time distribution as in “setting B” which involves only uncertainty about construction methods. On the other hand, the cost distribution is similar to the cost distribution in “setting C” which represents uncertainty about geology.
Both “setting A” and “setting B” represent the simulations with the “one time” option. Since the uncertainty about construction methods is considered in both simulation settings, the time distributions of the two settings are about the same. However, since “setting A” also considers the uncertainty about geology, the cost distribution of “setting A” is greater than that of “setting B”
Both “setting C” and “setting D” represent the simulations with the “each cycle” option. The difference between the two settings is that the uncertainty about geology is considered in the “setting C” . Since the 1000 simulations were run with the “each cycle” option for “setting D”, all method variables average out and hence, it is assumed that the uncertainty about construction methods is not considered in the simulations. Figure 22 and Figure 23 show that the uncertainty about geology causes the greater uncertainty in the cost distribution than the time distribution.
In order to make a true comparison between the simulation with the “each cycle” option and with the “one time” option, the geologic condition has to be same. Among four different simulation settings, “setting B” and “setting D” can be compared in this regard. This is because two simulations (setting B and setting D) were run with the same geologic condition and with the same number of construction simulations (1000 construction
simulations). Both time and cost distribution for the “setting B (one time)” are greater than those for the “setting D (each cycle)”. This comparison shows that the uncertainty in the time and cost distribution for the “setting D (each cycle)” averages out compared to the “setting B (one time)”.
One time Min Mean Max Stdev COV
Time 629 644 660 5.06 0.79%
Cost 31996722191 32786673442 33826274239 303826309 0.93%
Figure 20. Setting A
One time Min Mean Max Stdev COV
Time 626 643 662 5.00 0.78%
Cost 32402069148 32745272485 33051437783 101471361 0.31%
Figure 21. Setting B
Each cycle Min Mean Max Stdev COV
Time 636 641 646 1.74 0.27%
Cost 31898494106 32777438742 33732793964 270965857 0.83%
Figure 22. Setting C
Each cycle Min Mean Max Stdev COV
Time 637 640 644 1.02 0.16%
Cost 32694100636 32744542595 32794522097 16195607 0.05%
4-3. Analyses of the time-cost distributions of the Sucheon tunnel
In this section, time-cost distributions, which are obtained from the final simulation in study III, for each side of the main tunnel, the lining tunnel and the entire Sucheon tunnel will be examined separately.
4-3-1. Time-cost distributions of the left side of the main tunnel
Figure 25 and Figure 26 show the simulation results for the left side of the main tunnel (“part A” in Figure 17) in terms of the time-cost scattergrams, which show the results of multiple simulations (2500 simulation in this study; 50 geology simulations and 50 construction simulations) all in one graph (each time-cost pair from each simulation appears as a point on the graph). Tables below each figure show the total construction time and cost in terms of the minimum, mean, maximum, standard deviation and coefficient of variation.
Figure 25 shows two 2500 simulations runs with the “one time (long-term average)”. This illustrates the time-cost scattergrams for the left side of the Dolsan tunnel and left side of the Soonchon tunnel in one graph.
As shown in Figure 25, the trend and distribution of the left side of the Dolsan tunnel (purple cloud) and the Soonchon tunnel (blue cloud) are slightly different from each other. The time-cost scattergram of the left side of the Soonchon tunnel (blue cloud) lies above and is shifted to the right of the scattergram for the left side of the Dolsan tunnel (purple
cloud). This trend indicates that the total construction time and cost for the left side of the Soonchon tunnel is greater than those for the left side of the Dolsan tunnel. This is mainly because the left side of the Soonchon tunnel is 20 meters longer than the left side of the Dolsan tunnel.
Figure 26 shows that an imaginary case in which the left side of each tunnel has same length. Since the two parallel tunnels (the Soonchon and the Dolsan tunnel) are driven along the same geologic profiles, the time-cost scattergrams for the left side of each tunnel should be similar to each other.
However, as shown in Figure 26, they are slightly different even if the left side of each tunnel has the same length (the left side of the Soonchon tunnel has a lower mean construction time but greater mean construction cost compared to the left side of the Dolsan tunnel). This is due to the effect of the chemical plant. The construction methods, “patterns 2-1, 2-2 and 2-3” are applied to the specific section near the chemical plant of the left side of the Dolsan tunnel while “patterns 1, 2-1 and 3” are applied in this part of the left side of the Soonchon tunnel as shown in Figure 24.
As mentioned earlier, even if there is little effect of the chemical plant on the advance rates of the construction methods, “patterns 2-2 and 2-3” still have slightly lower advance rates than “patterns 1, 2-1 and 3” (see Table 9 in section 3-2-1). This leads to a greater total construction time for the left side of the Dolsan tunnel than that of the left side of the Soonchon tunnel. One of the reasons that the left side of the Soonchon tunnel still has a greater mean construction cost is that “pattern 3” is applied in this section of the Soonchon tunnel and it has a higher mean cost than “patterns 2-1 and 2-2”. All this explains why the
left side of the two tunnels shows different distributions in this imaginary case (Figure 26).
Dolsan tunnel Soonchon tunnel
Chemical plant
Main construction methods: Patterns 2-1, 2-2 and 2-3
Main construction methods: Patterns 1, 2-1 and 3
Dolsan tunnel Soonchon tunnel
Chemical plant
Main construction methods: Patterns 2-1, 2-2 and 2-3
Main construction methods: Patterns 1, 2-1 and 3
Figure 24. Construction methods applied to the specific part of the left side of the main tunnel
The trend of the time-cost scattergram shown in Figure 25 also shows that the total construction time is almost independent of the total construction cost. The main construction methods for the left side of the main tunnel are “patterns 1, 2, 2-1, 2-2, 2-3, 3 and 4”; “patterns 2-1, 2-2 and 2-3” have all same cost but different advance rates. This is one of the reasons why the trend of the time-cost scattergram of the left side of the main tunnel does not show that cost increases as time increases.
Left Soonchon Min Mean Max Stdev COV
Time 186 200 214 3.97 1.99%
Cost 5448786281 5828714393 6417217502 163175841 2.80%
Left Dolsan Min Mean Max Stdev COV
Time 183 195 206 3.39 1.74%
Cost 4884310885 5267690780 5577394887 118734150 2.25%
Left Soonchon Min Mean Max Stdev COV
Time 179 192 206 3.79 1.97%
Cost 5091153670 5414547035 5902620723 142420465 2.63%
Left Dolsan Min Mean Max Stdev COV
Time 183 195 206 3.39 1.74%
Cost 4884310885 5267690779 5577394887 118734150 2.25%
Figure 26. Time-cost scattergrams for the left side of the main tunnel using “one time” simulations (if two tunnels have same length
4-3-2. Time-cost distributions of the right side of the main tunnel
Figure 27 and Figure 28 show the simulation results for the right side of the main tunnel with time-cost scattergrams. Since the lining tunnels are connected to the right side of the main tunnel, the total construction time and cost for the right side of the main tunnel include the total construction time and cost for the lining tunnels.
Figure 27 shows two 2500 simulations run with the “one time” simulation illustrating the time-cost scattergrams for the right side of the Dolsan tunnel (purple cloud) and the right side of the Soonchon tunnel (blue cloud) in one graph.
As shown in Figure 27, the trend and distribution of the right side of the Dolsan tunnel and the Soonchon tunnel are very close to each other. Since the two tunnels are driven along the same geologic profiles and with the same tunnel geometries, the differences in the time-cost distributions between two tunnels only depend on the lengths of each tunnel.
The time-cost scattergram of the right side of the Dolsan tunnel lies above and is slightly shifted to the right of the scattergram for the right side of the Soonchon tunnel because the right side of the Dolsan tunnel is 10 meters longer.
Figure 28 shows an imaginary case in which the right side of the two tunnels has the same length. As shown in Figure 28, the two scattergrams are almost identical.
From Figure 27 and Figure 28, one can conclude that the differences in the time-cost distribution between two tunnels only depend on the length differences between them. As already mentioned in section 4-1-2-2, if the cost-related variables and the time-related variables are inversely related to each other, the trend of time-cost scattergram is that the
total construction time increases as the total construction cost increases.
Since the total construction time of the left side of the main tunnel is much smaller than that of the right side of the main tunnel, the total construction time of the entire tunnel, the Sucheon tunnel will be determined by the total construction time of the right side of the main tunnel and the lining tunnel.
Right Soonchon Min Mean Max Stdev COV
Time 617 640 659 6.36 0.99%
Cost 10226345468 10595626386 10919607108 91951751 0.87%
Right Dolsan Min Mean Max Stdev COV
Time 620 641 660 6.18 0.96%
Cost 10476053813 10831582899 11112393218 88965674 0.82%
Right Soonchon Min Mean Max Stdev COV
Time 616 642 663 6.58 1.03%
Cost 10391860113 10827934082 11115516403 93660589 0.87%
Right Dolsan Min Mean Max Stdev COV
Time 620 641 660 6.18 0.96%
Cost 10476053813 10831582899 11112393218 88965674 0.82%
Figure 28. Time-cost scattergrams for the right side of the main tunnel using “one time” simulation (if two tunnels have the same length