Publisher’s version / Version de l'éditeur:
Langmuir, 33, 32, pp. 8002-8011, 2017-07-18
READ THESE TERMS AND CONDITIONS CAREFULLY BEFORE USING THIS WEBSITE. https://nrc-publications.canada.ca/eng/copyright
Vous avez des questions? Nous pouvons vous aider. Pour communiquer directement avec un auteur, consultez la première page de la revue dans laquelle son article a été publié afin de trouver ses coordonnées. Si vous n’arrivez pas à les repérer, communiquez avec nous à PublicationsArchive-ArchivesPublications@nrc-cnrc.gc.ca.
Questions? Contact the NRC Publications Archive team at
PublicationsArchive-ArchivesPublications@nrc-cnrc.gc.ca. If you wish to email the authors directly, please see the first page of the publication for their contact information.
NRC Publications Archive
Archives des publications du CNRC
This publication could be one of several versions: author’s original, accepted manuscript or the publisher’s version. / La version de cette publication peut être l’une des suivantes : la version prépublication de l’auteur, la version acceptée du manuscrit ou la version de l’éditeur.
For the publisher’s version, please access the DOI link below./ Pour consulter la version de l’éditeur, utilisez le lien DOI ci-dessous.
https://doi.org/10.1021/acs.langmuir.7b01717
Access and use of this website and the material on it are subject to the Terms and Conditions set forth at
Ensemble and single particle fluorescence characterization of
dye-labeled cellulose nanocrystals
Leng, Tianyang; Jakubek, Zygmunt J.; Mazloumi, Mahyar; Leung, Alfred C.
W.; Johnston, Linda J.
https://publications-cnrc.canada.ca/fra/droits
L’accès à ce site Web et l’utilisation de son contenu sont assujettis aux conditions présentées dans le site LISEZ CES CONDITIONS ATTENTIVEMENT AVANT D’UTILISER CE SITE WEB.
NRC Publications Record / Notice d'Archives des publications de CNRC:
https://nrc-publications.canada.ca/eng/view/object/?id=a259497f-3a90-434f-bf8d-5328e444e29e https://publications-cnrc.canada.ca/fra/voir/objet/?id=a259497f-3a90-434f-bf8d-5328e444e29e
Ensemble and Single Particle Fluorescence Characterization of
Dye-Labeled Cellulose Nanocrystals
Tianyang Leng,
†,‡Zygmunt J. Jakubek,
†Mahyar Mazloumi,
†Alfred C. W. Leung,
§and Linda J. Johnston
*
,†,‡†
Measurement Science and Standards, National Research Council Canada, 100 Sussex Drive, Ottawa, ON K1A 0R6, Canada ‡
Department of Chemistry, University of Ottawa, Ottawa, ON K1N 6N5, Canada §
Aquatic and Crop Resource Development, National Research Council Canada, Montreal, QC H4P 2R2, Canada
*
S Supporting InformationABSTRACT: Cellulose nanocrystals (CNCs) have been
covalently labeled with both fluorescein and rhodamine and studied by a combination of UV−vis absorption spectroscopy and ensemble and single molecule fluorescence spectroscopy. For all samples, the fluorescence anisotropy and lifetimes were consistent with effects expected for covalently bound dye molecules. Low dye loading levels (∼0.1 dye/particle) were estimated for the fluorescein-labeled CNC which coupled with the strong pH dependence make this a less suitable fluorophore for most applications. Rhodamine-labeled CNCs were prepared from both sulfated and carboxylated CNCs and had loading levels that varied from 0.25 to ∼15 dye molecules/ CNC. For the sulfated samples, the absorption due to
(nonfluorescent) dimeric dye increased with dye loading; in contrast, the carboxylated sample, which had the highest rhodamine content, had a low dimer yield. Single particle fluorescence studies for two of the rhodamine-labeled CNCs demonstrated that individual particles are readily detected by their stepwise blinking/bleaching behavior and by polarization effects. Overall, the results indicate the importance of understanding the effects of loading on dye photophysics to select an optimal dye concentration to maximize sensitivity while minimizing the effect of the dye on the CNC behavior. The results also demonstrate that CNCs with relatively low dye loadings (e.g., ∼1 dye/particle) are readily detectable by fluorescence and should be adequate for use in fluorescence-based biological assays or to probe the distribution of CNCs in composite materials.
■
INTRODUCTIONCellulose nanocrystals (CNCs) are one member of a family of cellulose nanomaterials that have significant potential for commercial applications.1−6 They are an abundant,
biodegrad-able, and sustainable biobased material which, based on the properties of conventional cellulose and the data available so far, do not appear to have negative health or environmental effects.7−9CNCs can be generated from many types of cellulose
biomass, and their properties vary depending on the source material.6 Commonly used preparation methods involve a
mechanical step that breaks down the biomass into fibers that are then subjected to either an acid hydrolysis or oxidation step to degrade disordered cellulose and liberate the nanocrystals from the larger fibers.2These methods typically produce CNCs with negatively charged surface groups such as sulfate half esters or carboxylates, facilitating the formation of stable aqueous colloidal suspensions. CNCs are rod-shaped crystals that have a high crystalline content, have high mechanical strength, and assemble to give chiral nematic liquid crystals. Their many attractive properties lead to applications in a diverse range of areas, including nanocomposites,
biodiagnos-tics, paints and thin films, rheology modifiers, and optical films.1,4,10
There is increasing interest in methods to conjugate dyes, polymers, and biomolecules to the surface of cellulose nanocrystals and cellulose-derived nanostructures for bioimag-ing, nanocomposites, and biodiagnostic applications. A number of dye-labeled CNCs have been prepared and used for different purposes. One of the earlier examples used a three step procedure to label CNCs with fluorescein isothiocyanate (FITC), achieving a labeling efficiency of ∼30 μmol/g.11 Isothiocyanates were also used to label CNCs with either Rhodamine B or fluorescein for cell uptake and cytotoxicity experiments,12 to doubly label CNCs for ratiometric pH sensing applications,13 and to study the interaction of CNCs with diblock copolymers.14An alternate synthetic method used 5-(4,6-dichlorotriazinyl) amino fluorescein (DTAF), which had been employed previously to label cellulose microfibrils and Received: May 22, 2017
Revised: July 6, 2017
Published: July 18, 2017
Article
pubs.acs.org/Langmuir
Published 2017 by the American Chemical
Society 8002 DOI:10.1021/acs.langmuir.7b01717
bacterial cellulose, to generate dye-labeled CNCs and examine their dispersion in polymer composites.15−17 Subsequently, a
number of other studies have reported the conjugation of Alexa Fluor 546, quinolone, coumarin, rhodamine and anthracene moieties to CNCs for a variety of bioimaging and biosensing applications.18−22 Most previous studies have functionalized
sulfated CNCs, although a few examples have employed carboxylated CNCs. Very recently, carboxylated CNCs have also been functionalized with both quantum dots and carbon quantum dots for use as cytocompatible bioimaging probes and for thin film applications.23−25Dye loading levels ranging from
∼32 to <0.1 μmol/g have been reported, usually based on UV− vis absorption spectroscopy. Few studies have examined the fluorescence behavior in detail. Finally, in addition to CNCs, dye labeling approaches have been reported for studies of cellulose nanofibril (CNF) distribution in composites and uptake and localization in cells.26−28
The design of fluorescent CNCs presents several challenges. One is the importance of quantitative measurements as a function of dye loading to optimize the performance of the dye. This will ensure that optimal photophysical performance can be achieved with a minimum amount of dye, reducing the potential of the added fluorophore to modify the CNC behavior. We have examined the photophysical parameters of dye labeled CNCs in detail using a combination of ensemble and single particle fluorescence methods. Two dyes (RBITC and DTAF) that have been successfully used for bioimaging and pH sensors were selected for labeling sulfated CNCs and carboxylated CNCs were labeled with rhodamine B using a different synthetic procedure. These dyes are inexpensive, readily available and compatible with relatively simple synthetic chemistry that does not require prior functionalization of the CNC surface, advantages compared to some of the methods used in the literature. The photophysical properties of the rhodamine B labeled CNCs were examined in detail using UV− vis absorption and fluorescence spectroscopy for dye/CNC ratios that varied by a factor of ∼60. The main goal was to determine the most appropriate labeling efficiency to maximize the ability to detect individual CNCs while minimizing the amount of dye used to avoid modifying the CNC properties. Two of the dye-labeled CNC samples were characterized using single particle fluorescence and atomic force microscopy (AFM) measurements demonstrating that CNCs can be readily detected even at a low average loading level of ∼1 dye/CNC particle. The combination of photophysical characterization methods gives a more complete assessment of the performance of the dye-labeled CNC than UV−vis absorption which is usually the only method used to assess performance and dye loading. The utility of the dye-labeled CNCs for probing the homogeneity of CNC−polymer film composites will be reported elsewhere.
■
EXPERIMENTAL SECTIONGeneral.CNC suspension (sulfated, 11.5 wt %, never-dried) was produced by the USDA Forest Products Laboratory and purchased from University of Maine Process Development Center; carboxylated CNC was prepared by persulfate oxidation of softwood pulp according to a literature method.29 The sulfate half ester and carboxylate contents were 0.31 and 0.98 mmol/g, respectively, and both CNCs were sodium exchanged. Lissamine rhodamine B ethylenediamine (LRBED) was obtained from Thermo-Fisher Scientific. 5-(4,6-Dichlorotriazinyl) amino fluorescein (DTAF), Rhodamine B iso-thiocyanate (RBITC), poly-L-lysine (molecular weight 70 000−
150 000), and all reagents for synthesis were purchased from
Sigma-Aldrich. Deionized water (Milli-Q water purification system, 18.2 MΩ cm) was used throughout.
Synthesis of Dye-Labeled CNCs. Sulfated CNCs were labeled with DTAF which reacts directly with hydroxyl groups via a literature procedure using CNC suspensions with two different mass fractions, as summarized in theSupporting Information.15−17A similar one-pot reaction that has been used to label microcrystalline cellulose and CNCs by reaction of RBITC with hydroxyl groups to form a thiocarbamate bond was employed to synthesize rhodamine-labeled sulfated CNCs.13,30Concentrations and reaction times were varied to produce CNCs with three different loading levels (RB-1, CNC-RB-2, and CNC-RB-3), as detailed in the Supporting Information. Carboxylated CNC was labeled with rhodamine using LRBED to give CNC-RB-4.22,31All labeled CNCs were purified by a combination of centrifugation/washing steps and extensive dialysis. Complete removal of unattached dye was verified by checking the absorbance of the dialysis water and/or the CNC suspension after purification. Suspension concentrations were determined gravimetrically after freeze-drying a fraction of the sample. All spectroscopy and microscopy experiments were carried out using suspensions after purification and dilution (ie, not freeze-dried and redispersed) for most samples. For CNC-RB-4, both the never-dried suspension (0.02 wt %) and samples redispersed at 0.14 wt % with 5000 J/g sonication energy32were studied by absorption and fluorescence spectroscopy.
UV−Vis Absorption and Fluorescence Spectroscopy. Ab-sorption spectra were measured using a Cary 5000 UV−vis-NIR spectrometer at room temperature in either 2 mm or 1 cm path length quartz cuvettes. Before each measurement, the instrument was zero and baseline corrected using Milli-Q water in a cuvette as a 100% transmittance standard and a beam block as a 0% transmittance standard. The extinction coefficients of the two rhodamine dyes were determined from the slope of plots of absorbance of aqueous solutions of dye vs concentration: RBITC, 67 000 cm−1 M−1 at 558 nm and
LRBEN, 61 200 cm−1 M−1 at 569 nm. The absorbance of multiple
samples with concentrations that varied by a factor of 5−10 times was measured to calculate the dye loading for each CNC sample, assuming the same extinction coefficient as in aqueous solution. The absorbance values for all CNC samples were corrected for scattering.
Fluorescence of dye-labeled CNCs was measured using a Horiba Jobin Yvon Fluorolog Tau 3 spectrofluorometer with a photo-multiplier tube detector (R928P, Hamamatsu Photonics). The spectra were corrected for variation of the excitation light intensity with excitation wavelength using a reference detector. For comparison of fluorescence intensities for the various dye-labeled CNCs, plots of concentration vs intensity were measured for a dilution series for each sample and compared to a similar plot for RBITC (or LRBEN) in aqueous solution. Only data in the low absorbance range where emission intensity increased linearly with concentration were used. The frequency-domain method was used for lifetime measurements. A
60 nm silica nanoparticle suspension was used as the scattering reference material and the same intensity (±5%) was used for both sample and reference.
Emission anisotropy was measured for free dye solutions and dye-labeled CNC suspensions across emission bands. To account for instrumental polarization effects, four combinations of vertical and horizontal polarization of excitation and emission detection were measured.
Total Internal Reflection Fluorescence Microscopy (TIRFM). TIRF images were measured using an Olympus IX81 microscope with an Evolve 512 Delta EMCCD camera (Photometrics) and an Olympus 150× 1.45 NA U Apo TIRF objective. The objective was used with Cargille Type DF immersion oil. RB-labeled CNCs were excited at 543 nm with emission collected at 570−616 nm with a Cy3 filter set (Semrock). A 543 nm zero-order quarter-wave plate (Thorlabs) was used to give circularly polarized excitation for all the TIRF imaging experiments, except for the experiment where the effects of varying the polarization were examined. In this case a 546 nm zero-order half-wave plate (Thorlabs) was used to control the linearly polarized excitation beam.
Coverslips (Number 1, Fisher Scientific) used for imaging were cleaned with piranha solution (3:1 mixture of 98% sulfuric acid and 30% hydrogen peroxide) to remove organic residue and render the surface hydrophilic. The slides were coated with poly-L-lysine (PLL)
by incubation with a 0.01% solution for 30 min, followed by washing with deionized water. Then 50 μL of a dilute CNC suspension (either 105- or 106-fold dilution of 1.3 wt % CNC-RB-3, 0.9 × 10⁻⁶wt %
CNC-RB-4) was deposited on the PLL-coated cover slide, incubated for 1 min, and washed with a stream of water. The sample was dried in a stream of nitrogen gas.
Typically, sequences of 500 images were acquired for each sample at several areas of interest with an exposure time of 100 ms/frame. Images were analyzed with ImageJ (NIH) using a set of custom written macros. For each sequence, an intensity averaged image was created, its background determined, and local fluorescence maxima with values exceeding three standard deviations of the background identified. Next, for 3 by 3 pixel regions of interest for each such local maximum and a nearby background area, traces of intensity variation across the sequence were plotted. The traces were reviewed and corresponding image areas examined. Fluorescence maxima which were identified to correspond to aggregates or have intensity too weak to observe bleaching steps were excluded from further analysis.
Atomic Force Microscopy (AFM). Freshly cleaved mica (Ted Pella Inc. Hi-Grade Mica, grade V2, 25 mm × 25 mm) was incubated with 50 μL of 0.01 M PLL for 30 min and then washed with water. Dye labeled CNC suspension was diluted (CNC-RB-3, 106 fold
dilution), and 50 μL was deposited on PLL coated mica, incubated for 1 min, washed with water to remove unadsorbed CNCs, and dried in a stream of nitrogen.
Tapping mode (intermittent contact mode) AFM imaging was performed at room temperature in air using the JPK NanoWizard II AFM and MikroMasch HQ: DEP-XCS-11 cantilever B (typical spring constant of 2.7 N/m, resonance frequency of 80 kHz, platinum
coated). The AFM images were analyzed using Gwyddion v 2.41. Only individual CNCs were analyzed for size measurement, excluding particles touching the side of the image and aggregates. CNC length and height were measured manually using the “extract profiles” tool in Gwyddion.
■
RESULTSFluorescein-Labeled CNCs. Sulfated CNCs were labeled with fluorescein using a one-step literature procedure in which DTAF reacts directly with the hydroxyl groups.33 The
photophysical properties of the fluorescein labeled CNCs (CNC-Fl) were measured by absorption and fluorescence spectroscopy using a diluted CNC sample at pH 8.5 and compared to a reference sample of DTAF (2 mg/L) in 0.4 mM NaOH. Note that both the absorption and fluorescence for the DTAF dianion are maximal at pH 8.5, but decrease significantly at lower pH due to a mixture of dianion and monoanionic forms.34Both the absorption and emission maxima (Table 1,
Figure S1) show a small shift between CNC-FL and DTAF in water. The anisotropy is over ten times higher for dye-labeled CNCs, compared to the free dye, providing evidence for restricted rotational mobility of the dye attached to the CNC surface. Fluorescence lifetime measurements using the frequency domain method indicated that CNC-FL gave the best fit to a double exponential with lifetimes of 3.8 (58%) and 1.3 (42%) ns and an average lifetime of 2.8 ns. By contrast, DTAF in aqueous solution decayed with single exponential kinetics with a lifetime of 2.5 ns. This is consistent with a change of environment and possibly with two distinct environments or a heterogeneous environment for the dye on the CNC surface. The dye loading efficiency was estimated by measuring the absorbance of two samples at different dilutions after correction for scattering and using the measured extinction coefficient for DTAF (Table 2).
Rhodamine Labeled CNCs. Three rhodamine-labeled CNCs were prepared from sulfated CNCs by conjugation of hydroxyl groups to an isothiocyanate using conditions designed to give different levels of dye loading (CNC-RB-1, CNC-RB-2 and CNC-RB-3; see Experimental Section and Supporting Information). Characterization of the purified CNC-RB samples by dynamic light scattering and AFM indicated similar morphology and size distribution to the CNCs used for synthesis (Figure S2). For comparison, carboxylated CNCs were also labeled with rhodamine using lissamine rhodamine B ethylenediamine (CNC-RB-4). It was anticipated that a higher labeling efficiency would be achieved for the carboxylated CNCs and it was of interest to determine whether the different Table 1. Photophysical Parameters for Dye-Labeled CNCs Compared to Free Dyes in Aqueous Solution
sample absorption maximum, nm fluorescence maximum, nm anisotropy fluorescence lifetime, ns
DTAF, pH 8.5 490 513 0.02 2.54 CNC-Fl 494 517 0.20 2.8a RBITC, pH 4.9 558 580 0.06 1.2 CNC-RB-1, pH 5.3 568 583 0.19 2.3 CNC-RB-2, pH 5.5 562 584 0.27 2.5 CNC-RB-3, pH 5.4 568 585 0.29 2.2 LRBEN 569 586 0.05 1.60 CNC-RB-4 574 590 0.14 2.2b
aAverage lifetime from double exponential fit with 3.8 ns (0.58) and 1.3 ns (0.42) component lifetimes (numbers in parentheses indicate the fraction
of the component lifetime).bAverage lifetime from double exponential fit with 4.9 ns (0.32) and 0.9 ns (0.68) component lifetimes (numbers in
parentheses indicate the fraction of the component lifetime).
Langmuir Article
DOI:10.1021/acs.langmuir.7b01717
Langmuir2017, 33, 8002−8011
(longer and more flexible) linker would impact the photo-physical behavior of the fluorophore.
The four rhodamine-labeled CNCs were characterized by UV−vis absorption and fluorescence spectroscopy. RBITC has a maximum absorption at 558 nm and a small shoulder near 520 nm that coincides approximately with the maximum for H-dimer absorption reported in the literature.35,36The absorption spectra for the RBITC-labeled CNCs (Figure 1a) are similar to the free dye, with a maximum emission that shifts to the red by up to ∼10 nm with increasing dye loading. The intensity of the shoulder at 520 nm also changes with dye loading, with shoulder-to-peak intensity ratios increasing from approximately 0.37 for RBITC to 0.53, 0.66, and 0.68 for RB-2, CNC-RB-3 and CNC-RB-1, respectively. These results are consistent with a higher fraction of dimers or aggregates as the dye loading increases. Rhodamine dimers are frequently observed in organized environments such as clays, lipid monolayers or bilayers and silica nanoparticles.37−41Although only the
blue-shifted H-dimer (head-to-head or parallel dimer) absorption is observed in solution, red-shifted absorption bands due to the head-to-tail J-dimers and/or aggregates are also observed in organized environments. The blue-shifted dimer/aggregate absorption has also been observed previously for RBITC-labeled CNCs and for RB covalently attached to microcrystal-line cellulose.12,42
LRBED has an absorption maximum at 569 nm in aqueous solution with a small shoulder at 531 nm (Figure 1b). CNC-RB-4 has a similar red-shifted and broadened spectrum with a
maximum at 574 nm and a shoulder at 538 nm. The ratio of shoulder-to-peak intensity is only slightly larger for CNC-RB-4 (0.39 vs 0.34), indicating that dye dimerization is minimal for CNC-RB-4.
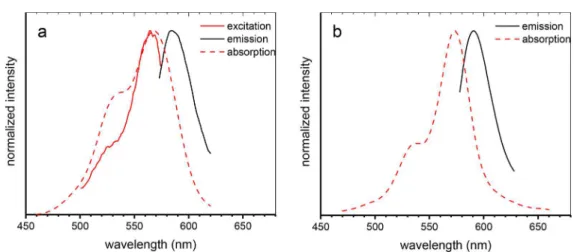
The absorption, fluorescence excitation, and emission spectra of CNC-RB-3 are shown in Figure 2. Although both the 538 nm shoulder and the main peak at 568 nm are clearly visible in the absorption spectrum, the fluorescence excitation spectrum shows only a single peak at 566 nm with a small shoulder near 530 nm. This suggests that the dimer has weak emission, consistent with literature reports.35,36,41However, it should be noted that the excitation spectrum was detected at the monomer fluorescence maximum, which favors monomer detection and will suppress detection of dimer fluorescence should it be present. The emission and absorption maxima for RB-4 are red-shifted as compared with those for CNC-RB-3 by 5 and 6 nm, respectively (Figure 2andTable 1).
The photophysical parameters (absorption and emission wavelengths, fluorescence anisotropy, and lifetime) for each sample are shown in Table 1. The anisotropy of dye labeled CNCs is between 3 to 5 times higher than the anisotropy for the dye in aqueous solution, consistent with decreased rotational mobility due to attachment of the dye to the CNC surface. The dye is covalently attached to the surface via a flexible linker. Assuming that dye molecules are bound to an average-sized CNC particle32modeled as a cylinder 96 nm long and 4 nm in diameter and using the measured lifetime values, it can be shown that restricted rotational diffusion of a dye molecule relative to a host CNC particle is responsible for fluorescence depolarization and motion of CNC is not expected to play a major role. The fluorescence decays of RBITC labeled CNCs (CNC-RB-1, 2, 3) all gave adequate fits to single exponentials with lifetimes that are approximately twice as large as the lifetime of the free dye, which also suggests that the dye is covalently attached to the CNC. In contrast, CNC-RB-4 decayed with biexponential kinetics with one component shorter than the dye in aqueous solution and one longer.
The dye loading efficiency for the four rhodamine labeled CNCs was estimated from plots of absorbance vs concentration for CNC samples after correction for scattering due to CNC particles and assuming that the extinction coefficient of the dye absorption maximum (RBITC or LRBEN) is not altered by conjugation to the CNC. It should be noted that plots of absorbance vs concentration were only linear at low Table 2. Dye Concentration (μmol/g CNCs and Dye
Molecules per CNC Particle) for Fluorescein and Rhodamine-Labeled CNCs As Determined by Absorption Spectroscopya
dye loading
sample μmol/g dye/particle fluorescence efficiency
CNC-Fl 0.08 0.1
CNC-RB-1 5.1 5.8 0.3
CNC-RB-2 0.21 0.25 0.8
CNC-RB-3 1.2 1.4 1.2
CNC-RB-4 12.6 14.7b 0.4
aFluorescence efficiencies relative to free dye in solution are also listed. bSimilar values were obtained for a redispersed sample (12.8 and 4.9
dye/particle from absorption and fluorescence methods, respectively).
Figure 1.Absorption spectra of RBITC and CNC-RB-1, 2, 3 (a) and LRBED and CNC-RB-4 (b) in water normalized to the same maximum absorbance. The spectra for RB-labeled CNCs were corrected for scattering.
concentrations and absorbance values (Figure S3), indicating the importance of working at appropriate dilutions to obtain reliable assessments of dye loading. There was no correction for absorption by dimers on CNC particles. Since the absorption maximum of nonfluorescing dimers is blue-shifted compared to monomers, only a fraction of dye molecules present in dimer (or aggregated) form on the CNC surface is accounted for. The dye concentrations (μmol/g CNC) are summarized inTable 2. The dye concentration in μmol/g CNC (Table 2) was used to estimate the number of dye molecules per CNC particle, based on the CNC density and average particle size. AFM measurements of the CNC starting material used for synthesis of the labeled materials gave an average length of 96 nm and an average height of 4 nm.32 The average volume/particle, assuming a perfect cylinder, and the density of cellulose (1.6 g/cm3)43were then used to calculate the number of particles for suspensions with a known wt % CNC. The estimated numbers of dye/CNC particle are listed inTable 2. The dye loading varies by a factor of approximately 25 for the 3 RBITC-labeled samples (from 0.2 to ∼5), while CNC-RB-4 has the highest dye loading (∼14 dyes/CNC). It should be noted that these estimates of dye/particle ignore the fact that CNCs show a relatively broad size distribution. Similar dye loading levels were obtained for never-dried CNC-RB-4 and for a sample that was freeze-dried and then redispersed.
The effect of dye loading on the fluorescence efficiency for the RB-labeled CNCs was assessed by measuring the variation
of fluorescence intensity as a function of sample dilution and comparing to a similar relationship for the dye in aqueous solution (Figure S3). This method will only quantify fluorescent monomers, but not dyes that are part of either dimers or aggregates. Some literature studies of RB-labeled nanoparticles have shown decreased fluorescence efficiency compared to the free dye in solution, effects which are generally attributed to quenching by a fluorescence resonance energy transfer (FRET) mechanism.40 Other studies have observed enhanced fluorescence efficiency that is attributed to an increased radiative rate for dyes attached to a surface.41 The relative efficiencies for the various samples are shown inTable 2. The two samples with lower dye loading have fluorescence efficiencies that are similar to the free dye in solution. This is consistent with reduction of the nonradiative decay rate for CNC-bound RB in proportion to the reduction of the radiative rate (by approximately a factor of 2 in this case). The reduction of the nonradiative rate is a consequence of the reduced density of states of the covalently bound dye molecules resulting from restricted dye mobility. However, the fluorescence efficiency decreases significantly for both CNC-RB-1 and CNC-RB-4, which have on average ∼6 and ∼15 dyes/CNC. This decreased fluorescence efficiency is similar to effects that have been observed previously for RB in silica nanoparticles with variable levels of dye loading and may indicate a FRET quenching mechanism. It is also possible that the increased dye loading results in an increased propensity for CNC aggregation.
Figure 2.Normalized absorption, fluorescence excitation, and emission spectra of CNC-RB-3 (a) and absorption and emission spectra of CNC-RB-4 (b), both in water.
Figure 3.TIRF images for CNC-RB-3 deposited on glass coverslips at two different dilutions of the stock suspensions: (a) 105-fold and (b) 106-fold
dilution. The inset at the bottom right corner for image (b) shows an expanded view of the fluorescent feature in the center of the image.
Langmuir Article
DOI:10.1021/acs.langmuir.7b01717
Langmuir2017, 33, 8002−8011
Single Particle Fluorescence. Total internal reflection fluorescence microscopy (TIRFM) was used to study two of the rhodamine-labeled CNCs. CNC-Fl and CNC-RB-2 for which we estimated an average of ∼0.1 and 0.25 dyes/particle were not examined since at this low dye loading level a large fraction of the particles will not have a dye attached and will be nonfluorescent. After excluding the sample with the lowest rhodamine loading, we elected to investigate CNC-RB-3 which has a relatively low dye concentration of ∼1 dye/particle and CNC-RB-4 which has the highest dye loading level (∼15 dyes/ CNC). Typical TIRFM images of CNC-RB-3 are shown in
Figure 3for a sample (∼1.3 wt % CNCs) prepared with two different dilutions. The less dilute sample (Figure 3a; 105-fold dilution) has a number of large bright features that are due to CNC aggregates as well as less bright spots that may be single CNCs. The density of spots and the presence of aggregates indicate that the concentration of this sample is too high for single particle fluorescence studies. Samples that were diluted 106times had a more suitable density for single particle imaging
(Figure 3b).
The effects of laser polarization were examined for the more dilute sample to assess feasibility of using dye-labeled CNCs as reporters of CNC dispersion in transparent or semitransparent matrices. The probability of excitation is dependent on the alignment of the electric field vector of the light and the absorption dipole of the fluorophore.44 To assess the polarization effect, linearly polarized light with the polarization direction controlled using a 543 nm rotating half wavelength plate was used to excite the dye labeled CNCs. For each region of interest, a series of ten images was taken where the polarization angle was adjusted from 0° to 180° in 20° steps. Small cropped regions from two of these images are shown in
Figure 4a and b. The intensity for individual particles varied
with the laser polarization.Figure 4d shows intensity variation of a selected particle (number 5 in panel 4c) as a function of polarization rotation. With the polarization angle near 0° or 180°, fluorescence of the spot vanishes, which is possible with only a single dye molecule (or multiple molecules with well-aligned dipole moments, which is much less likely) present in the spot area and the excitation light polarization direction perpendicular to the dye molecule excitation dipole moment. For all the seven spots observed in Figure 4c, fluorescence reduces to background for some polarization direction, which indicates that each of the spots is a single dye molecule. An average image of the polarization rotation sequence is shown in
Figure 4c. In this image, which is equivalent to an image obtained with circularly polarized excitation, all the dye molecules can be observed, even though their dipoles are oriented at different angles with respect to the polarization of light. Neither light polarized linearly nor circularly in the sample plane will excite molecules with their absorption dipoles oriented in the axial direction; off-axis illumination with a nonzero p-polarization component is required in that case.
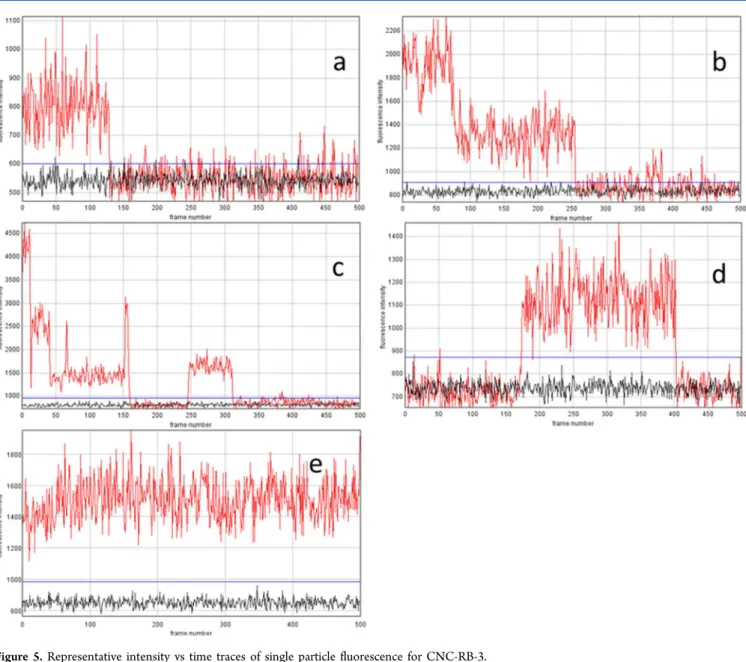
Representative intensity vs time traces for individual features for the sample used to record the image inFigure 3b are shown inFigure 5. A typical one dye bleaching trace is shown inFigure 5a andFigure 5b shows an example with 2 dyes, one of which blinks briefly before it is bleached. A more complex trace is shown inFigure 5c; 3 dyes are active at the beginning of the trace and are sequentially bleached. After a delay, an additional dye molecule appears although it is unclear whether this is the one of the initial three active dyes or a different molecule.
Figure 5d shows an example where the dye is off initially but appears midway through the acquisition and is then bleached. In a few cases intensity traces with no dye bleaching were observed (Figure 5e). In these cases the number of dyes/
Figure 4. Fluorescence intensity variation of CNC-RB-3 as a function of excitation polarization. (a, b) Images recorded with approximately orthogonal polarization with the electric field vector direction shown by arrows. (c) Synthetic average intensity image for a sequence of images with polarization direction in the 0°−180° range. (d) Fluorescence intensity variation as a function of polarization direction for the particle number 5 indicated in panel (c). Images are color enhanced using Fire lookup table.
feature was assigned based on an estimated average intensity of approximately 500 for individual dyes. In total 752 features from over 20 image sequences were analyzed and the number of dyes/feature assigned; 25% of the features that were above
background were deemed ambiguous and unanalyzed. The histogram of dyes/fluorescent feature is shown inFigure 6: the percentage of features assigned to single dye molecules, 2 dyes and ≥3 dyes is 69%, 28%, and 3% respectively.
Figure 5.Representative intensity vs time traces of single particle fluorescence for CNC-RB-3.
Figure 6.Bar charts showing the distribution of fluorophore count per TIRFM feature for CNC-RB-3 (a) and CNC-RB-4 (b).
Langmuir Article
DOI:10.1021/acs.langmuir.7b01717
Langmuir2017, 33, 8002−8011
AFM was used to examine the level of aggregation for a CNC-RB-3 sample deposited on mica at the same dilution used for the TIRFM experiment. The dilute sample used for single particle fluorescence is far from ideal for AFM due to the relatively low particle density, as illustrated by the representa-tive image shown in Figure 7. Nevertheless, it is possible to distinguish both individual and agglomerated particles in the image. The number of clustered and individual particles was measured for 10 images for a total of 68 counts that included 40 single CNCs and 28 agglomerates. Although the limited statistics make this at best a qualitative estimate, it is clear that, even at this very low sample density, there are aggregates of CNC which will be difficult to distinguish from individual particles in the TIRFM images. It is interesting to note that, despite the limited AFM statistics, the fraction of agglomerated CNCs is similar to the fraction of multiple dye features in the TIRFM experiment. Although in principle one can distinguish individual and agglomerated CNCs using correlated AFM/ TIRFM imaging, the small CNC size and the very low particle density required for TIRFM make this a very challenging experiment.
Similar TIRFM experiments were also carried out for CNC-RB-4 deposited on PLL-coated coverslips from a 0.9 × 10⁻⁶wt
% suspension. The representative intensity traces shown in
Figure S4 indicate that some features show clear multistep bleaching; seeFigure S4aand b for single and 3 step bleaching. However, other particles show less well-defined bleaching steps (Figure S4c and d) that are indicative of a larger number of fluorophores. The histogram based on analysis of 10 image sequences for this sample is shown inFigure 6. The fraction of single fluorophore features is 50% for CNC-RB-4, considerably lower than for CNC-RB-3, although much higher than would be expected based on the average number of dyes/particles estimated from absorption measurements (seeTable 2). The number of fluorescent features with 3 or more dyes is also considerably larger for CNC-RB-4 (19% vs 3% for CNC-RB-3). This behavior is consistent with quenching by adjacent fluorophores reducing the number of emissive fluorophores, similar to the 3-fold reduction in fluorescence efficiency observed in ensemble measurements for CNC-RB-4 compared to CNC-RB-3 (Table 2).
■
DISCUSSION AND CONCLUSIONSCNCs functionalized with both fluorescein and rhodamine-based fluorophores have been examined using a combination of UV−vis absorption and ensemble fluorescence spectroscopy. In all cases, the absorption and fluorescence spectra showed only modest changes in wavelength maxima, compared to solution spectra for the free dye used for the conjugation reaction. However, the changes in fluorescence lifetime and increase in anisotropy are consistent with covalent attachment of the dye to the CNC surface. For CNC-Fl, the dye loading was relatively low, independent of reaction conditions, similar to previous observations of loading levels of 4−50 nmol/g (based on fluorescence intensities) when DTAF was used to functionalize CNCs with varying levels of surface sulfate groups.15The low efficiency for the DTAF conjugation reaction may be a limitation for some applications where it is desirable to have at least one dye/particle (eg, for bioimaging). However, low labeling levels may be desirable for other applications, as for example in the previous study using DTAF-labeled CNCs to examine the dispersion of CNCs in polymer composites15Note that higher levels of fluorescein conjugation (2.8 μmol/g) have been reported using FITC.13 The strong pH dependence for fluorescein emission, however, is a considerable limitation since the maximal fluorescence emission is for the dianion form at relatively high pH (typically between pH 8 and 10, depending on the pKaof the fluorescein derivative),34conditions that may
be incompatible with specific applications.
Absorption spectra for the rhodamine-labeled CNCs indicated the presence of dimers or aggregates on the CNC surface. For the three sulfated CNCs functionalized with RBITC, the fraction of nonfluorescent dimer/aggregate increased with dye loading, which significantly reduces the potential to achieve a higher detection sensitivity by increasing the dye loading. By contrast, carboxylated CNCs to which RB was attached using different conjugation chemistry had a much lower dimer fraction, similar to what is observed for the free dye in solution, despite the high dye loading (∼15 dyes/ particle). This change may be due to either the longer linker or the different distribution of carboxylate and hydroxyl groups on the particle surface. The fluorescence efficiency for the rhodamine-labeled CNCs was similar to that for free dye in solution at low dye loading, but decreased significantly for the
two samples with loading above ∼5 dyes/particles. This observation and the increased yield of dimer for RBITC-labeled CNCs demonstrate that increased dye loading does not necessarily lead to increased sensitivity for fluorescence detection. This illustrates the importance of full characterization of the dye-labeled materials to select the optimal combination of loading level and photophysical performance. Previous studies of rhodamine-labeled CNCs have reported loading levels that varied from 2 to 20 μmol/g based on absorption spectroscopy but had not characterized the fluorescence behavior in detail.13,18 Finally, it should be stressed that comparisons of dye loadings from absorbance values and of relative fluorescence efficiencies should always be based on a range of concentrations to ensure that one is working in a linear range.
The single particle fluorescence studies for two of the rhodamine-labeled CNCs indicate that individual particles are readily detected via their stepwise blinking/bleaching and polarization behavior, even at low dye loadings. Two very recent studies have also investigated dye-labeled cellulose nanomaterials using single molecule fluorescence methods. In one example, fluorescence correlation spectroscopy was used to examine the dye loading of individual cellulose fibrils diffusing in aqueous solution. The average brightness was much higher than that for free dye in solution; this plus the larger hydrodynamic radius of the diffusing particles were consistent with significant levels of fibril aggregation under the conditions of this experiment.28In a second example, Alexa Fluor labeled CNCs were imaged in the absence and presence of a cellulose enzyme, demonstrating that it was possible to see changes in the number of individual fluorescent particles as a function of enzyme activity.20 This study and our work indicate that routine experiments for CNCs labeled with very low number of dye/particle are feasible, minimizing potential effects of dye on the behavior of the CNCs.
■
ASSOCIATED CONTENT*
S Supporting InformationThe Supporting Information is available free of charge on the
ACS Publications website at DOI: 10.1021/acs.lang-muir.7b01717.
Additional information on synthetic procedures and figures with fluorescence, UV−vis, and AFM results (PDF)
■
AUTHOR INFORMATION Corresponding Author *E-mail: Linda.Johnston@nrc-cnrc.gc.ca. ORCID Linda J. Johnston:0000-0002-9136-4920 NotesThe authors declare no competing financial interest.
■
ACKNOWLEDGMENTSThis work was supported in part by a research grant from the Natural Sciences and Engineering Research Council.
■
REFERENCES(1) Eichhorn, S. Cellulose nanowhiskers: Promising materials for advanced applications. Soft Matter 2011, 7, 303−315.
(2) Moon, R. J.; Martini, A.; Nairn, J.; Simonsen, J.; Youngblood, J. Cellulose nanomaterials review: structure, properties and nano-composites. Chem. Soc. Rev. 2011, 40, 3941−3994.
(3) Klemm, D.; Kramer, F.; Moritz, S.; Lindstrom, T.; Ankerfors, M.; Gray, D.; Dorris, A. Nanocelluloses: A new family of nature-based materials. Angew. Chem., Int. Ed. 2011, 50, 5438−5466.
(4) Dufresne, A. Nanocellulose: a new ageless bionanomaterial. Mater. Today 2013, 16, 220−227.
(5) Shatkin, J. A.; Wegner, T. H.; Bilek, E. M.; Cowie, J. Market projections of cellulose nanomaterial-enabled products- Part 1: Applications. TAPPI J. 2014, 13, 9−16.
(6) Trache, D.; Hussin, M. H.; Haafiz, M. K. M.; Thakur, V. K. Recent progress in cellulose nanocrystals: sources and production. Nanoscale 2017, 9, 1763−1786.
(7) Roman, M. Toxicity of cellulose nanocrystals: a review. Ind. Biotechnol. 2015, 11, 25−33.
(8) Camarero-Espinosa, S.; Endes, C.; Mueller, S.; Petri-Fink, A.; Rothen-Rutishauser, B.; Weder, C.; Clift, M. J. D.; Foster, E. J. Elucidating the potential biological impact of cellulose nanocrystals. Fibers 2016, 4, 21.
(9) Shatkin, J. A.; Kim, B. Cellulose nanomaterials: life cycle risk assessment, and environmental health and safety roadmap. Environ. Sci.: Nano 2015, 2, 477−499.
(10) Jorfi, M.; Foster, E. J. Recent advances in nanocellulose for biomedical applications. J. Appl. Polym. Sci. 2015, 2015, 41719.
(11) Dong, S.; Roman, M. Fluorescently labeled cellulose nanocryst-als for bioimaging applications. J. Am. Chem. Soc. 2007, 129, 13810− 13811.
(12) Mahmoud, K. A.; Mena, J. A.; Male, K. B.; Hrapovic, S.; Kamen, A.; Luong, J. H. T. Effect of surface charge on the cellular uptake and cytotoxicity of fluorescent labeled cellulose nanocrystals. ACS Appl. Mater. Interfaces 2010, 2, 2924−2932.
(13) Nielsen, L. J.; Eyley, S.; Thielemans, W.; Aylott, J. W. Dual fluorescent labeling of cellulose nanocrystals for pH sensing. Chem. Commun. 2010, 46, 8929−8931.
(14) Haghpanah, J. S.; Tu, R.; Da Silva, S.; Yan, D.; Mueller, S.; Weder, C.; Foster, E. J.; Sacui, I.; Gilman, J. W.; Montclare, J. K. Bionanocomposites: differential effects of cellulose nanocrystals on protein diblock copolymers. Biomacromolecules 2013, 14, 4360−4367. (15) Abitbol, T.; Palermo, A.; Moran-Mirabal, J. M.; Cranston, E. D. Fluorescent labeling and characterization of cellulose nanocrystals with varying charge content. Biomacromolecules 2013, 14, 3278−3284.
(16) Helbert, W.; CHanzy, H.; Husum, T. L.; Schulein, M.; Ernst, S. Fluorescent cellulose microfibrils as substrate for the detection of cellulase activity. Biomacromolecules 2003, 4, 481−487.
(17) Luterbacher, J. S.; Walker, L. P.; Moran-Mirabal, J. M. Observing and modeling BMCC degradation by commercial cellulase cocktails with fluorescently labeled trichoderma reseii Cel7A through confocal microscopy. Biotechnol. Bioeng. 2013, 110, 108−117.
(18) Endes, C.; Mueller, S.; Kinnear, C.; Vanhecke, D.; Foster, E. J.; Petri-Fink, A.; Weder, C.; Clift, M. J. D.; Rothen-Rutishauser, B. Fate of cellulose nanocrystal aerosols deposited on the lung cell surface in vitro. Biomacromolecules 2015, 16, 1267−1275.
(19) Filpponen, I.; Argyropoulos, D. S. Regular Linking of Cellulose Nanocrystals via Click Chemistry: Synthesis and Formation of Cellulose Nanoplatelet Gels. Biomacromolecules 2010, 11, 1060−1066. (20) Grate, J. W.; Mo, K.-F.; Shin, Y.; Vasdekis, A.; Warner, M. G.; Kelly, R. T.; Orr, G.; Hu, D.; Dehoff, K. J.; Brockman, F. J.; Wilkins, M. J. Alexa Fluor-labeled fluorescent cellulose nanocrystals for bioimaging solid cellulose in spatially structured microenvironments. Bioconjugate Chem. 2015, 26, 593−601.
(21) Huang, J.-L.; Li, C.-J.; Gray, D. G. Cellulose nanocrystals incorporating fluorescent methylcoumarin groups. ACS Sustainable Chem. Eng. 2013, 1, 1160−1164.
(22) Zhou, J.; Butchosa, N.; Jayawardena, H. S. N.; Park, J.; Zhou, Q.; Yan, M.; Ramström, O. Synthesis of multifunctional cellulose nanocrystals for lectin recognition and bacterial imaging. Biomacro-molecules 2015, 16, 1426−1437.
Langmuir Article
DOI:10.1021/acs.langmuir.7b01717
Langmuir2017, 33, 8002−8011
(23) Abitbol, T.; Marway, H. S.; Kedzior, S. A.; Yang, X.; Franey, A.; Gray, D. G.; Cranston, E. D. Hybrid fluorescent nanoparticles from quantum dots coupled to cellulose nanocrystals. Cellulose 2017, 24, 1287−1293.
(24) Chen, L.; Lai, C.; Marchewka, R.; Berry, R. M.; Tam, K. C. Use of CdS quantum dot-functionalzied cellulose nanocrystal films for anti-counterfeiting applications. Nanoscale 2016, 8, 13288−13296.
(25) Guo, J.; Liu, D.; Filpponen, I.; Johansson, L.-S.; Malho, J.-M.; Quraishi, S.; Liebner, F.; Santos, H. A.; Rojas, O. J. Photoluminescence hybrids of cellulose nanocrystals and carbon quantum dots as cytocompatible probes for invitro bioimaging. Biomacromolecules 2017, 18, 2045.
(26) Zammarano, M.; Maupin, P. H.; Sung, L.-P.; Gilman, J. W.; McCarthy, E. D.; Kim, Y. S.; Fox, D. M. Revealing the interface in polymer nanocomposites. ACS Nano 2011, 5, 3391−3399.
(27) Moran-Mirabal, J. M. The study of cell wall structure and cellulose-cellulase interactions through fluorescence microscopy. Cellulose 2013, 20, 2291−2309.
(28) Navarro, J. R. G.; Wennmalm, S.; Godfrey, J.; Breitholtz, M.; Edlund, U. Luminescent nanocellulose platform: from controlled graft block copolymerization to biomarker sensing. Biomacromolecules 2016, 17, 1101−1109.
(29) Leung, A. C. W.; Hrapovic, S.; Lam, E.; Liu, Y.; Male, K. B.; Mahmoud, K. A.; Luong, J. H. T. Characteristics and properties of carboxylated cellulose nanocrystals prepared from a novel one-step procedure. Small 2011, 7, 302−305.
(30) Vieira Ferreira, L.; Cabral, P.; Almeida, P.; Oliveira, A.; Reis, M.; Botelho do Rego, A. Ultraviolet/visible absorption, luminescence, and X-ray photoelectron spectroscopic studies of a rhodamine dye covalently bound to microcrystalline cellulose. Macromolecules 1998, 31, 3936−3944.
(31) Madison, S. A.; Carnali, J. O. pH Optimization of amidation via carbodiimides. Ind. Eng. Chem. Res. 2013, 52, 13547−13555.
(32) Brinkmann, A.; Chen, M.; Couillard, M.; Jakubek, Z. J.; Leng, T.; Johnston, L. J. Correlating cellulose nanocrystal particle size and surface area. Langmuir 2016, 32, 6105−6114.
(33) Abitbol, T.; Kloser, E.; Gray, D. G. Estimation of the surface sulfur content of cellulose nanocrystals prepared by sulfuric acid hydrolysis. Cellulose 2013, 20, 785−794.
(34) Siegler, R.; Sternson, L. A.; Stobaugh, J. F. Suitability of DTAF as a fluorescent labelling reagent for direct analysis of primary and secondary amines - spectral and chamical reactivity. J. Pharm. Biomed. Anal. 1989, 7, 45−55.
(35) Kajiwara, T.; Chambers, R. W.; Kearns, D. R. Dimer spectra of rhodamine B. Chem. Phys. Lett. 1973, 22, 37−40.
(36) Arbeloa, F. L.; Ojeda, P. R.; Arbeloa, I. L. Dimerization and trimerization of rhodamine 6G in aqueous solution. J. Chem. Soc., Faraday Trans. 2 1988, 84, 1903−1912.
(37) Bujdak, J.; Martinez, V. M.; Arbeloa, F. L.; Iyi, N. Spectral properties of rhodamine 3B adsorbed on the surface of montmor-illonites with variable layer charge. Langmuir 2007, 23, 1851−1859.
(38) Ras, R. H. A.; Nemeth, J.; Johnston, C. T.; Dekany, I.; Schoonheydt, R. A. Orientation and conformation of octadecyl rhodamine B in hybrid Langmuir-Blodgett monolayers containing clay minerals. Phys. Chem. Chem. Phys. 2004, 6, 4174−4184.
(39) Castro, B. M.; de Almeida, R. F. M.; Fedorov, A.; Prieto, M. The photophysics of a Rhodamine head labeled phospholipid in the identification and characterization of membrane lipid phases. Chem. Phys. Lipids 2012, 165, 311−319.
(40) Kell, A. J.; Barnes, M. L.; Jakubek, Z. J.; Simard, B. Toward brighter hybrid magnetic-luminescent nanoparticles: luminosity dependence on the exctied state properties of embedded dyes. J. Phys. Chem. C 2011, 115, 18412−18421.
(41) Larson, D. R.; Ow, H.; Vishwasrao, H. D.; Heikal, A. A.; Wiesner, U.; Webb, W. W. Silica nanoparticle architecture determines radiative properties of encapsulated fluorophores. Chem. Mater. 2008, 20, 2677−2684.
(42) Vieira Ferreira, L. F.; Cabral, P. V.; Almeida, P.; Oliveira, A. S.; Reis, M. J.; Botelho do Rego, A. M. Ultraviolet/visible absorption,
luminescence, and X-ray photoelectron spectroscopic studies of a rhodamine dye covalently bound to microcrystalline cellulose. Macromolecules 1998, 31, 3936−3944.
(43) Stefaniak, A. B.; Seehra, M. S.; Fix, N. R.; Leonard, S. S. Lung biodurability and free radical production of cellulose nanomaterials. Inhalation Toxicol. 2014, 26, 733−749.
(44) Lakowicz, J. R. Principles of fluorescence spectroscopy; Springer Science and Business Media, 2013.