HAL Id: in2p3-00023657
http://hal.in2p3.fr/in2p3-00023657
Submitted on 26 Jan 2005HAL is a multi-disciplinary open access archive for the deposit and dissemination of sci-entific research documents, whether they are pub-lished or not. The documents may come from teaching and research institutions in France or abroad, or from public or private research centers.
L’archive ouverte pluridisciplinaire HAL, est destinée au dépôt et à la diffusion de documents scientifiques de niveau recherche, publiés ou non, émanant des établissements d’enseignement et de recherche français ou étrangers, des laboratoires publics ou privés.
systems: The MUSE experiments in the MASURCA
facility
R. Soule, W. Assal, P. Chaussonnet, C. Destouches, C. Domergue, C.
Jammes, J.-M. Laurens, J.-F. Lebrat, F. Mellier, G. Perret, et al.
To cite this version:
R. Soule, W. Assal, P. Chaussonnet, C. Destouches, C. Domergue, et al.. Neutronic studies in support of accelerator-driven systems: The MUSE experiments in the MASURCA facility. Nuclear Science and Engineering, Academic Press, 2004, 148, pp.124-152. �10.13182/NSE01-13C�. �in2p3-00023657�
Neutronic Studies in Support of ADS :
The MUSE Experiments in the MASURCA Facility
R. Soule, W. Assal, P. Chaussonnet, C. Destouches, C. Domergue,
C. Jammes, J.-M. Laurens, J.-F. Lebrat, F.Mellier, G. Perret, G. Rimpault, H. Servière CEA, Centre de Cadarache, F-13108 Saint Paul lez Durance, France
G. Imel
ANL, P.O. Box 2528, Idaho Falls, ID 83403, USA G.M. Thomas
BNFL, Springfields Works, Preston, Lancashire, England D. Villamarin, E. Gonzalez-Romero
CIEMAT, Avda. Complutense 22, Madrid, Spain M. Plaschy, R. Chawla
PSI, CH-5232 Villigen PSI, Switzerland J.L. Kloosterman, Y.Rugama
IRI, DUT, Mekelweg 15, NL-2629 JB Delft, Netherlands
A. Billebaud*, R. Brissot, D. Heuer, M. Kerveno, C. Le Brun, E. Liatard, J.-M. Loiseaux, O.Méplan, E. Merle, F. Perdu, J. Vollaire
LPSC(ISN), CNRS-IN2P3/UJF, 53 av. des Martyrs, F-38026 Grenoble Cedex, France P. Baeten
SCK-CEN, Boeretang 200, 2400 Mol, Belgium
On behalf of the MUSE European Collaboration∗∗
*corresponding author [email protected]
fax number: +33 4 76 28 40 04
November 1, 2003 Total number of pages: 80
Number of tables: 16 Number of figures: 18
∗∗ The MUSE European Collaboration : CEA/DEN Cadarache, ISN Grenoble (France), SCK/CEN Mol (Belgium), BNFL (Great Britain), DUT Delft, NRG Petten (The Netherlands), CIEMAT Madrid (Spain), FZK Karlsruhe, FZJ Jülich (Germany), ENEA Roma (Italy), KTH, CUT (Sweden), UMMET (Poland).
Abstract
The MUSE program (Multiplication with an external source) is in progress at the MASURCA critical facility at the Cadarache Research Center of the CEA in France. The program is dedicated to the physics studies of accelerator driven systems (ADS) in support of transmutation studies of minor actinides and long-lived fission products. It began in 1995 with the coupling of a Cf source in MASURCA, and was followed by a commercial (d,T) source. In 2001, a specially constructed (d,D)/(d,T) neutron generator (GENEPI) was placed in MASURCA, and the MUSE-4 program commenced.
In this paper we describe the first phases of the MUSE-4 program, with data presented that were obtained up to about summer of 2002. We present some results from the ‘reference’ configuration, which can operate at critical. We present traverses of measured fission reaction rates, with comparison to calculations. Also in the reference configuration we performed activation foil measurements, and also present these results compared to calculations.
Because a major objective of the MUSE program is to test and qualify methods of sub-critical reactivity measurement, we have devoted a major portion of our studies to this area. We have used classical methods (rod-drop, source multiplication) to attempt to measure the
subcritical level. In these early phases we studied core configurations of around keff=0.995.
Deeper subcriticality (keff = 0.96) was achieved by inserting a safety rod.
In addition to the methods mentioned above, we have devoted a lot of effort to pulse neutron source (PNS), fluctuation (Rossi and Feynman-α), and transfer function methods (e.g., CPSD). In this paper we present our preliminary results of all the methods, with some discussion regarding cross-comparison.
I. INTRODUCTION
The commissioning of a future industrial ADS qualified to transmute large amounts of
minor actinides and long lived fission products1 will need numerous technological
demonstrations sustained by an extensive basic R&D program in the field of nuclear data, accelerators, spallation targets, fuels and sub-critical systems. As concerns this last theme, the MUSE experiments performed at Cadarache Center (France) in the MASURCA reactor represents a fundamental step for the understanding of the neutronic behaviour of a sub-critical multiplying medium driven by an external neutron source. Conducted in a low power mock-up (power<5kW) where temperature effects are negligible, these experiments are based on the use of a well known external source, in terms of intensity and neutron energy, and they exploit the original idea to separate the experimental validation of the subcritical multiplying medium behaviour from the experimental validation of the source characteristics.
From 1995, the MUSE-1 and then the MUSE-2 experiments, performed with a 252Cf
source located at the centre of the MASURCA core, aimed to demonstrate that experimental measurement techniques used for critical cores could be also used for sub-critical configurations. Later, the MUSE-3 experiments constituted the first important parametric study with the loading of several configurations with increasing sub-criticality levels. Based on the use of a commercial neutron generator these experiments helped to optimize the design of the MUSE-4 program and to refine the characteristics of a neutron source, more intense and more suitable to the envisaged measurements. A brief summary of these experiments is given in section II.
Funded by the 5th Euratom Framework Program and supported by the GEDEON French
research organizations (newly GEDEPEON), the MUSE-4 experiments are now taking place within the frame of a large international collaboration including sixteen organizations from twelve countries. The three main objectives of this program are:
1- to improve our knowledge of the neutronic behaviour of multiplying media driven by an external neutron source, by experimentally characterising configurations of interest.
2- to define experimental methods allowing the determination of sub-criticality levels
(without need to achieve criticality) in support to the operation of an ADS,
3- to define recommended calculation routes for the neutronic predictions of ADS (including nuclear data, calculation tools, biases and residual uncertainties).
The mainspring of the MUSE-4 experiments, the GENEPI (Générateur de Neutrons Pulsés Intenses) neutron generator is born from a close collaboration between CEA and CNRS. Built specifically with a view to these experiments, its main characteristic is to deliver very short pulses (<1µs) with a repetition rate going from a few Hertz to 5 kHz. Details about the setup are given in section III. The measurement program, after a first step of characterization of a critical configuration described in section IV, is based on a parametric approach and the use of many experimental techniques and analysis methods.
Among the neutronic parameters we wish to measure, the determination of reactivity levels is of prime importance. In fact, among the safety demonstrations that will precede the commissioning of an ADS, the proof of the reactivity level mastery will be decisive for the acceptability of such a machine. A large fraction of the efforts of all experimental teams involved in the MUSE program has been devoted to this objective.
In a practical way, two families of analysis methods are used. The first one aims to study the decreasing of the neutron population (prompt or delayed neutrons) after the injection of a neutron source pulse (Pulsed Neutron Source, “PNS” method, section V.A). The second family investigates the neutronic fluctuations in the fission chains (noise measurements, section V.B.).
The first coupling between MASURCA and GENEPI with deuterium target happened the 27th of November 2001. A series of measurements in a slight sub-critical configuration (keff =
preliminary results but, to have also a first feedback on experimental conditions necessary to improve measurements in the next phases. The study of subcritical configurations began again at the beginning of October 2002 to continue until the end of year 2003 with subcriticality levels representative of an industrial ADS (keff = 0.97 then 0.95).
As concerns the definition of a recommended route for the prediction of ADS features, two main actions have been launched.
First, a calculation benchmark under the auspices of the OECD/NEA has been defined. Sixteen organizations from fourteen countries are taking part in this exercise. Results from the two first of the three steps that compose this benchmark are currently under analysis. Second, the problems related to the propagation and the streaming of the spallation neutrons are
investigated in the SADa (Subcritical Assembly in Dubna) experiments. This program aims to
study different spallation neutron sources (Pb, Pb-Bi, W targets) produced by the 660 MeV protons of the Dubna synchrotron, with and without the presence of a multiplying medium. These experiments will allow the validation of the transport calculation tools and the nuclear data treating the deep penetration and the activation of the materials far away from the source and the multiplying medium.These two major actions will not be discussed in this paper. In the following all reactivities will be expressed in “pcm” units: one pcm corresponds to a
reactivity of 10-5. Moreover for the whole paper and MUSE-4 results, according to a CPSD
measurement2 of β
eff giving 335±7 pcm, the βeff value will be settled to 335 pcm
(subsequently no error propagation due to this value will be taken into account). II. REVIEW OF THE MUSE PROGRAMME
II.A. The MUSE-1 and MUSE-2 Experiments
The MUSE-1 and MUSE-2 experiments3,4 were very short (weeks) experiments
performed in 1995 and 1996 to demonstrate the feasibility of neutronic measurements and
core characterization of a subcritical reactor driven by an external source in MASURCA. In these experiments, a 252Cf source was introduced in the center of the facility, whose reactivity
had been lowered to a subcritical level. The reactor was loaded with conventional UO2-PuO2
fuel (Pu enrichment ≈ 25%) with sodium coolant.
Core characterization was performed in terms of 235U axial and radial fission rate traverses, and the effect of the axial position of the external source on the flux shape and on the total power level were investigated.
II.B. The MUSE-3 Experiment
The MUSE-3 experiment5 was performed from February to April 1998 and consisted of
introducing a (D,T) 14 MeV neutron generator (SODERN - GENIE26) loaded inside a standard MASURCA subassembly, at the core center of different subcritical configurations, the tritium target being located at the core median plane. The core was cylindrical around the SODERN generator (60 cm high and about 50 cm in diameter) and its composition was MOX fuel with Na as coolant. The reflector was made of Na and Stainless Steel. The GENIE-26 generator produced 150 keV deuteron pulses of a few µs (with a repetition rate of 200 Hz) on a tritium target, providing a source of about 10 n/s. 8
A critical reference was followed by three subcritical configurations of about 500, -1000 and -1500 pcm respectively, which were obtained by unloading peripheral MASURCA subassemblies from the critical reference. In a later phase, the neutron generator was surrounded successively by sodium and pure lead buffers, to modify the importance of the 14 MeV neutrons emitted by the generator. In these two configurations, a subcriticality level of about -5500 pcm was obtained by adjusting the external fuel loading.
A full core characterization was performed in terms of 235U axial and radial fission rate traverses, and the effect of the buffer surrounding the source on the flux shape and on the total
performed with the generator working in the pulsed mode in order to test a method of reactivity determination using the PNS technique. An example of these measurements is shown in Fig. 1 for several subcritical levels.
Interesting conclusions could be drawn concerning the dependence of the slope of the count rate with reactivity. However the in-depth analysis of these measurements was made very difficult by experimental biases. Indeed it was observed that light materials - used for high voltage insulation inside the generator – thermalized some neutrons in the reactor and
perturbed the PNS measurements6-8. Because of these problems, only a few of these
measurements were analyzed in a satisfactory manner.
Nevertheless, very interesting conclusions could be drawn from this experiment to optimize the design of the MUSE-4 experiment. For example, important recommendations were given to define a new pulsed source and to ameliorate the quality of the experiments and their analysis, such as:
• there should be no light materials in the part of neutron source (GENEPI) in the reactor,
• the monitoring of the external neutron production is essential,
• the detectors and analyzers should have time constants and performances suited for PNS measurements.
In spite of the problems the MUSE-3 experiment was a very fruitful and important step in the MUSE program.
III. EXPERIMENTAL SETUP III.A. The MASURCA Facility
The MASURCA facility is dedicated to the neutronic studies of fast reactors lattices. The materials of the core are contained in rodlets, along with square platelets. These rodlets or
platelets are put into wrapper tubes having a square section (4 inches) and about 3 meters in height.
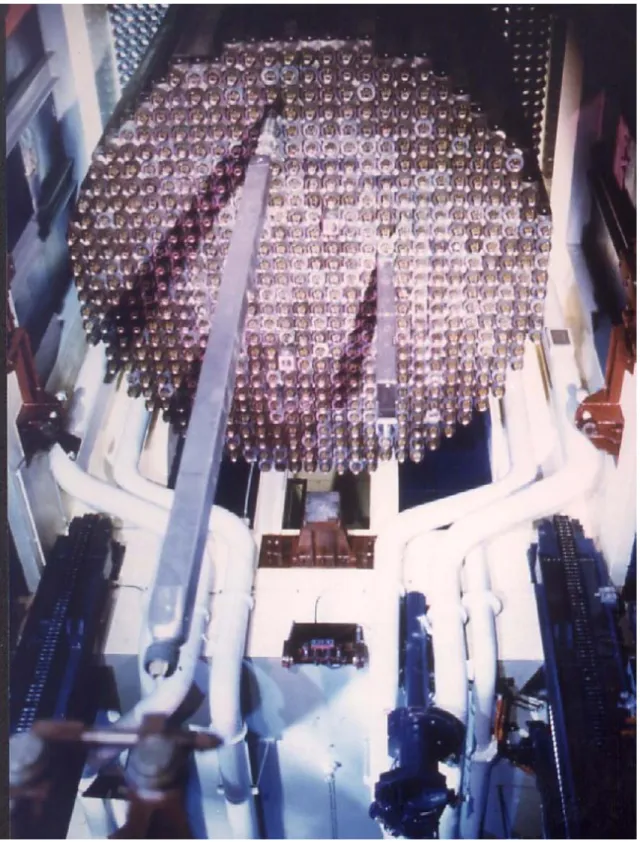
These tubes are hung vertically from a horizontal plate supported by a structure of concrete. The core itself can reach 6 000 litres. To build such cores the tubes are introduced from the bottom in order to avoid that the fall of a tube corresponds to a positive reactivity step. The reactivity control is fulfilled by absorber rods in varying number depending on core types and sizes. The control rods are composed of fuel material in their lower part, so that the homogeneity of the core is kept when the rods are withdrawn. The core is cooled by air and is surrounded by a biological shielding in heavy concrete allowing operation up to a flux level of 109 n/cm2.s. Core and biological shielding are maintained at a reduced pressure, relative to
the outside environment. The maximum operating power of the facility is limited to 5kWth. Figure 2 presents a picture of a MASURCA core loading from the bottom.
III.B. The Pulsed Neutron Source GENEPI
The GENEPI (GEnérateur de NEutrons Pulsé Intense) accelerator (see Fig. 3) was especially designed and built by ISN Grenoble for the MUSE experiments in the MASURCA facility for brief neutron injections with a very fast intensity decrease (about 500 ns). To do this, deuteron impulses are created, focalized, accelerated and guided onto a deuterium or tritium titanium target (TiD or TiT respectively). The beam peak intensity is about 50 mA with a width of less than 1µs. The repetition rate can vary from a few Hz up to 5 kHz,
providing about 3.104 neutrons per pulse with the TiD target (~1.2x10⁸ n/s at 4 kHz) and
about 3.106 neutrons per pulse with the TiT target (~1.2x10¹⁰ n/s at 4 kHz). The main
The online monitoring of the neutron production for both deuterium and tritium targets is based on the detection by Si detectors placed upstream of the target of :
• the recoil protons induced by the D(d,p)T reaction which occurs about as often as the D(d,n) 3He reaction on the deuterium target,
• the recoil alpha particles produced by the T(d,n)4He reactions on the tritium target.
The characterization of the neutron production yield is based on the activation analysis of
58Ni foils. For the 2.67 MeV neutrons produced by the D(d,n)3He reactions, the 58Ni(n,p)58Co
reaction is used. The 14 MeV neutron spectrum produced by the T(d,n)4He reactions is
determined by both the 58Ni(n,2n)57Ni and 58Ni(n,np)57Co reactions induced by neutrons with an energy higher than 13 MeV.
III.C. Core Experimental Configurations
All the MUSE-4 configurations are based on fuel cells composed of equal amounts of fuel and Na representative of a fast Pu burner core (Pu enrichment of ~ 25% with ~ 18% content of 240Pu) with sodium coolant.
The fuel zone is radially and axially reflected by a stainless steel/sodium (75%/25%) shielding. The GENEPI deuteron guide is horizontally introduced at the core mid-plane and the deuterium or tritium target is located at the core centre. To compensate the spatial effect due to the presence of the GENEPI guide in the north part of the loading, the south symmetrical part is loaded with pure lead (99.99% of Pb) simulating the Pb circulation of the target. To simulate the physical presence of a Pb spallation source, a pure square (10 cm thick) lead zone is placed around the GENEPI target.
The reactivity control is fulfilled by four safety rods (SR) composed of B4C in their upper
when all the rods are withdrawn. Moreover, a fine-tuning rod, the pilot rod (PR), allows the achievement of criticality and the expected power level by adjusting its axial position.
As the measurements are based on a parametric approach, mainly four different experimental configurations will be studied :
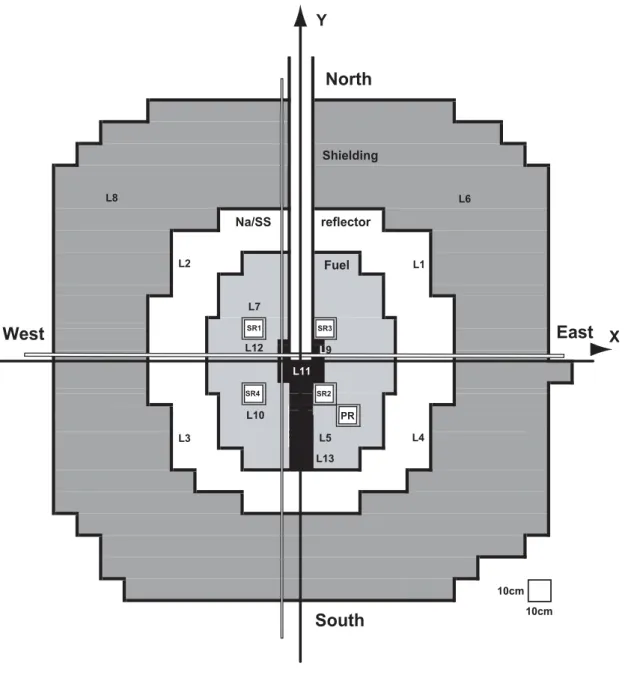
• a critical one (called Reference), shown in Fig. 4,
• three successive subcritical configurations named SC0, SC2 SC3; keff being
successively of about 0.994, 0.97 and 0.95 respectively: these three configurations will be obtained by replacing radially some peripheral fuel cells by stainless steel/sodium cells.
Several complementary configurations will be obtained from the previous ones by insertion of safety/pilot rods. These asymmetrical configurations will be of interest in the frame of studying the spatial decoupling effects and the excitation of the high order flux harmonics (the flux tilting could be amplified by the external source).
Here are described the first experiments performed in the Reference and SC0
configurations with the D(d,n)3He source only. The table II resumes the different
configurations obtained with the safety and pilot rods for which measurements were performed. It gives also the corresponding value of ρ (in pcm) when it was possible to get it from Source Multiplication method (SM), Modified Source Multiplication method (MSM),
MSM factor value correcting the SM value for subcriticalities lower than 1000 pcm, or Rod
Drop (RD) measurements. The number of fuel cells for the Reference configuration varies from 1114 to 1115 as it was necessary to compensate the Pu decay between two distant measurement periods.
III.D. Detectors and Measurement Locations
The detectors used for the measurements described in this paper are mainly fission chambers (FC). They are summarized in Table III.
The locations of measurements are summarized in Table IV and shown in Fig. 4. The (X,Y) coordinates give the location of the vertical channel, according to the Fig. 4, and Z gives the coordinate on the vertical axis (X=0, Y=0) centered on the mid-plane of the core. Two radial channels also shown in Fig. 4 allow measurements in the (X,Y) plane: the West-East (W-E) channel (Y=2.1 cm, Z=-9.5 cm), and the South-North (S-N) channel(X=-7.4 cm, Z=-0.6 cm).
For each type of measurement the locations of the detectors used will be specified in the corresponding section.
IV. CHARACTERIZATION OF A CRITICAL CORE: THE REFERENCE CONFIGURATION
IV.A. The Need for the Reference Configuration
The particular problems associated with the characterization of a hybrid driven system are linked to the precise determination of the level of subcriticality, the effective prediction of the importance of the external source and the accurate estimation of the spectral fluctuations due to the heterogeneous central zones (lead, accelerator). In this context, the establishment of a critical configuration, prior to subsequent driven subcritical cores, offers the advantage of system calibration in terms of reactivity. More precisely, rod drop measurements, as presented in section IV.D, yield the reactivity worth of the control and safety rods leading to improved determination of the level of each future subcriticality. This last point is essential to the study of the validity of different dynamics measurements envisaged for the assessment of the level of subcriticality in a future ADS. Moreover, the analysis of the reference configuration facilitates a decoupling of the spectral variations due to the fundamental mode flux distribution (cf. section IV.B.) and the presence of the external source (cf. section IV.C). Therefore, the two following sections quantify the codes’ predictive capabilities regarding the spectral perturbations related to the various geometrical interfaces.
IV.B. Spatial Distributions (Traverses)
The work described was carried out in order to support, and ensure the quality of, the MUSE-4 experimental program and to assist with the specification of the core configurations. A range of parameters were generated using a dataset (with a simplified core geometry and set of isotopes) made available to all MUSE-4 partners. This paper will focus on the calculated and measured reaction rate traverses since these are independent from any pre-calculated parameters.
IV.B.1. Calculation Procedure
All of the calculated data reported in this section were generated using the ERANOS7
deterministic code suite (European Reactor ANalysis Optimised System), which was developed by the CEA in collaboration with other R&D organisations. The JEF 2.2 nuclear
data library was used throughout this work. Three-dimensional (TGV-VARIANT9) neutronic
models of the MUSE-4 cores were constructed using the P1 approximation for the anisotropy treatment of the cross-sections and the simplified P3 approximation for the flux (in 33 energy groups). The resultant flux solutions and group constants were then processed using the diverse range of functions embedded within the overall ERANOS calculation scheme.
IV.B.2. Comparison of Calculated and Measured Traverses
A matrix of radial and axial traverses was generated for Reference loading in critical configuration (1115 cells, and ρ=0) in order to compare the predicted and experimental reaction rates. The intention was to confirm that the ERANOS reaction rate predictions are consistent with the measured experimental values. If this is the case, then the total fission rate (and therefore the core power) as calculated by TGV can be accepted with a certain confidence level.
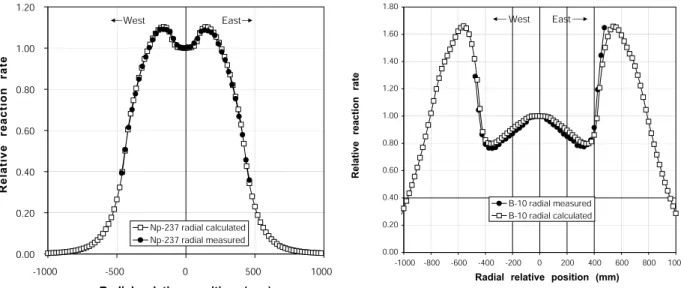
Comparisons are presented in Fig. 5 and 6 between the measured and predicted reaction rates for an axial (L10) and the W-E radial channel with a thermal and a threshold reaction rate.
Note that Figs. 5 to 6 incorporate data for both thermal (235U and 10B) and threshold
(240Pu and 237Np) reactions. The axial and radial channels’ coordinates are the same as in the
previous paragraph. Good agreement is obtained between the measured and predicted reaction rate distributions in the central lead and fissile zones. A similar comparison in the reflector region at thermal energies (see graph 6(a)) shows that some refinements to the ERANOS model or methodology could be required in order to achieve the same degree of accuracy as that attained in the fissile region.
Reaction rate measurements from a subcritical core with GENEPI activated are expected shortly which will hopefully enable the validation matrix for ERANOS to be extended further to subcritical source-driven systems.
IV.C. Spectral Indices Given by Foil Activations
The results of foil activation measurements performed in the Reference critical configuration (1115 cells) are presented in the current section. Comparisons are made with
calculations using MCNP-4C10 to interpret the experimental results and to investigate the
capabilities of the stochastic code to reproduce the spectral perturbations in terms of reaction rate variations across the regions of interest, principally near the accelerator/lead, lead/fuel and fuel/reflector interfaces, where spectral fluctuations are more important.
IV.C.1. Experimental Procedures
The choice of foils has been guided mainly by the need to cover as wide a range of threshold energy values as possible. The list of the activation foils employed includes a large number of threshold and non-threshold reactions. Most of the foils are disc-shaped with a
thickness of 0.25mm and a diameter of 9mm. However, for instance, each of the NpO2
samples used consists of 9 spheres of 0.8mm diameter contained in a titanium box. All activation samples were located inside experimental aluminium rods, which have a cross section of 10mm x 10mm. These rods were inserted into two radial channels (W-E and S-N) and the L11 axial channel. On the basis of calculations, 10 different locations were selected for activation foil irradiations. These locations are indicated in Table V.
Location F1 was considered as a normalization point in an unperturbed region near a calibrated fission chamber. Location F2 permits a study of the impact of the lead region, while F3 and F4 were selected for highlighting the potential core asymmetry. Location F5 characterized lead moderation/multiplication effects, while location F6 provides a useful test of code capabilities to treat streaming effects along the voided accelerator-tube region. Finally, locations F7, F8, F9 and F10 permit a study of spectral variations along the W-E axis. The achievement of accurate foil activation measurements requires particular attention being given to the application of necessary corrections and the treatment of experimental uncertainties. The corrections applied result from either the irradiation conditions (power normalisation, self-shielding, etc.) or from physical effects associated with the γ-counting of
the irradiated foils (detector efficiency, γ-self-absorption, coincidence effects, etc...)11.
Finally, the corrected measured saturated activities are used to deduce results which can be compared with the calculated integral reaction rates.
IV.C.2. Experimental Results and Comparisons with Calculations
The current MCNP-4C analysis of the experiments has been carried out using the
JEF-2.2 library12 for the transport of neutrons in conjunction with the ENDF/B6 dosimetry data
files for the calculation of the threshold reaction rates. This calculation scheme has been
The three different non-threshold reactions which have been considered here are
captures in 115In, 59Co and 64Zn. Calculation/experiment (C/E) values for the ratios of
saturated activities at F2-F6, relative to F1 in each case, are presented in Table VI. The results appear very satisfactory when one considers the corresponding uncertainties. Table VI gives also the MCNP-based C/E values for the threshold reactions. As mentioned earlier, the ENDF/B6 dosimetry file was used in conjunction with MCNP-4C, although it is the JEF-2.2 library which has been employed for the neutron transport calculation. Although generally satisfactory agreement is obtained for F4-F6, significant discrepancies are indicated for F2 and F3, i.e. the prediction of spectral variations in and around the central lead region at high neutron energies appears to be problematic. Further investigations are clearly needed, of both calculation and experimental aspects, to understand these differences.
The spatial variations of two other threshold reactions (232Th and 237Npfission) have been studied, this time in terms of traverses along the W-E axis, i.e. with measurements at locations F7, F8, F9 and F10. For instance, the moderation effects in the central lead region are clearly reflected in the observed decrease of the threshold fission rates (the measured ratio F9/F10 is 0.86 ± 0.05 and 0.94 ± 0.04 for 232Th and 237Np fission, respectively).
In contrast to Table VI, which does not provide a direct indication of the neutron spectrum at the different locations, in Table VII we present calculated and experimental spatial variations of several spectral indices. These have been considered in terms of reaction
rate ratios, relative to 115In(n,n'), at locations F2-F3, with the relatively unperturbed core
position F1 serving as reference for each index. The reaction 115In(n,n') has been chosen as
denominator for the indices, partly because of the high experimental accuracy achieved for its determination and partly because its threshold of 1.2 MeV is relatively low.
The moderation effect of the central lead zone is clearly indicated by the F2/F1 ratios
than 1.0 and those for the higher-threshold reactions being all less than 1.0. Furthermore, the manner in which the effects of the lead region diminish with distance is well quantified by the changes in the spectral indices between F2/F1, F3/F1, F5/F1 and F6/F1. As regards the core asymmetry created by the presence of the accelerator tube and lead zone, this is characterised by the ratios F3/F1 and F4/F1. It is seen that the differences are largely well within the indicated 1-sigma uncertainties, confirming that asymmetry effects are minor when the accelerator is not operating. The corresponding differences in the source-driven subcritical configurations are, of course, expected to be much greater.
As regards the comparison of calculation and experimental results in Table VII, agreement is seen to be well within the indicated uncertainties in most cases. The need is clearly indicated, however, for improving the statistical accuracy of some of the MCNP results.
The present investigations have clearly demonstrated the value of foil activation measurements in the MUSE-4 programme. Use of the currently reported spectral indices for unfolding the neutron spectrum at specific locations is expected to provide useful supplementary information. Similar studies in the subcritical configurations will contribute to the experimental characterisation of other ADS-specific features, e.g. those related to the
external source, which have already been investigated numerically14.
IV.D. Rod Drop Measurements
The inverse point-kinetics method is a well-known method to determine the reactivity worth of the control rods in nuclear reactors. It is based on measuring the power of the reactor by neutron counters and solving the point-kinetics equations to calculate the dynamic reactivityρ
( )
t 15:( )
ln( )
( )
( )
' exp(
')
'( )
( )
t n t s t d t n t t t dt dt n t n t ρ β λβ λ −∞ = + Λ −∫
− − − Λ (1)Here, β and λare the delayed neutron fraction and the corresponding precursor decay constant, and Λis the generation time. Often the source strength s t
( )
is not known, althoughmethods exist to determine the source strength from measurement16. For fast reactors with a
very short generation timeΛ, the above expression can be simplified using 'micro kinetics’17.
The result for the reactivity in dollars ρ%
( )
t =ρ( )
t /β reads18:( )
( ) ( )
0(
0[ ]
)
( )
(
)
0 1 exp ' exp ' ' . t t n t n t n t t t dt n t ρ = + ρ − −λ −λ − λ − ∫
% % (2)Compared with Eq. (1) this expression has two advantages. First, it does not require the external source strength to be known (although the value of the initial reactivityρ%0might seems as hard to get as s0), and secondly it makes no use of the generation time. The latter is
a consequence of the fact that use is made of prompt fission chains, instead of individual fissions, which is only valid if the reactivity does not change during a prompt fission chain. For fast reactors, and certainly for MASURCA, this limitation poses no problem. As stated
above, a prompt fission chain takes less than 1 µs, while a safety rod drop that reduces the
reactivity with about 10$ takes more than one second. This means that the reactivity changes about 0.001$ during a prompt fission chain, which indeed is negligible. For a sub-critical reactor, the duration of a fission chain is even shorter. For six delayed neutron groups, Eq. (2) reads18:
( )
( ) ( )
0 0 6 6( )
(
)
1 1 0 1 exp ' exp ' ' t j j j j j j j t n t n t n t t t dt n t β β ρ ρ λ λ λ β β = = = + − − − − − ∑
∑
∫
% % . (3)Measurements have been performed starting with the reactor in critical state (Reference 1114 cells). In all experiments, first the fine-tuning rod PR had to be inserted, after which either SR1 or SR2 were dropped (configurations I and II). Each experiment has been repeated twice (run 1 and run 2) to verify its reproducibility. The fission chambers D1 to D4 were in L1 to L4 (reflector) respectively.
From Eq. (3) it can be seen that two input data are needed for the analysis: the initial reactivityρ%0and the delayed neutron data
(
λ βj, j)
for six families. The initial reactivityρ%0 can be derived from the experiments by the following procedure. If the delayed neutron data are calculated for a specific state of the reactor, e.g. critical, and if the reactor is held at that state for a certain period of time, the reactivity obtained from the inverse point-kinetics procedure should be constant for that same period too. This leaves one degree of freedom to fix the initial reactivity ρ%0. After the rod drop, the count rates become rather low with quite a largenoise component, which gives an erratic behaviour of the final reactivity18. This was
eliminated by linearly smoothing the count rates and determining the value of the reactivity
after the count rates were stabilized. The effective delayed neutron yields and the
corresponding precursor decay constants for the six families were calculated for a critical reactor by the FX2 diffusion code19 using a 25-group cross section library.
The above-mentioned two-dimensional diffusion code (FX2) and the 25-group nuclear data library were also used to calculate the reactivity worth of the safety rods SR1 and SR2. To this end, the lead target and the vacuum beam tube were smeared, and three XY calculations were performed: one for the unrodded core, one for the SR1 rod inserted and one for the SR2
rod inserted. In all cases an axial buckling height of 50 cm was used to get a keff of nearly
unity for the unrodded core. Three-dimensional calculations were performed with the Monte-Carlo code MCNP to get some kind of calculation reference solution. The results were performed both with nuclear data from the JEF2.2 and from the ENDF-B/VI nuclear data files. Two MCNP results are given: one with cross section of lead taken from the ENDF-B/V data file, and one with the cross section of all nuclides taken from the ENDF-B/VI file. The results are given in Table VIII, together with the measurements.
As can be seen in Table VIII, the difference between the reactivity worth measured with different detectors is quite large. This is due to the fact that the disturbance of the power
profile is so large that the inverse point-kinetics analysis is not valid anymore, especially for the detectors close to the safety rods. Better values can be obtained when the influence of the spatial flux distribution on the count rates of the detectors is taken into account by spatial correction factors. The point-kinetic equations can be derived from the neutron transport equation by factorizing the neutron flux density φ
(
r E t, ,)
into a flux shape ψ(
r E t, ,)
and amplitude n t( )
:(
r E t, ,)
(
r E t n t, ,) ( )
.φ =ψ (4)
One can shift the major part of the time dependence of the neutron flux density into the amplitude function by constraining the time dependence of the shape function. To this end, a second equation is needed to hold some integral value of the shape function constant in
time17. The point-kinetics equations describe the behaviour of the amplitude as a function of
time, while the shape function describes the neutron flux as a function of space.
The shape functions before and after the control rod drops were calculated using FX-2 with the 25-groups data library, and the count rate of each monitor after insertion of a safety rod was multiplied with the ratio of these shape functions. The corrected reactivity worth of the safety rods is given in Table IX, together with the calculated values.
The safety rod worth measured with monitor D2 is significantly lower than the other values, while detectors D1, D3, and D4 do give coherent results for the reactivity worth of both rods. Because detector D2 showed to be very unstable during the time of the
measurement18, its results have been discarded from the analysis. The reactivity worth
averaged over D1, D3 and D4 detectors are 3909±201 pcm for SR1 and 4534±268 pcm for SR2.
As is well known, the inverse kinetic procedure provides the dynamic reactivity, this is the reactivity formed by the time-dependent neutron flux, while codes like MCNP and FX2 provide the static reactivity (the reactivity weighted by the lambda-mode flux of the perturbed
system)17. This means that during the rod drop, the reactivity measured by the inverse kinetics procedure differs from the calculated values. However, after the transient, when the detector count rates have stabilized, the difference between the two concepts, if any, is very small.
The reactivity worth of SR1 and SR2 calculated with MCNP (3685±67 pcm and 4523±67 pcm) agrees quite well within the margins of the experimental error. There is a difference for the reactivity worth of SR2 calculated with data from ENDF/B-V and from ENDF/B-VI (4322 pcm and 4489 pcm respectively). But both calculated values agree with the experimental values.
V. METHODS FOR SUBCRITICAL REACTORS
V.A.PNS Measurements
The power of subcritical reactors must be maintained by an external neutron source, driven in all designs of industrial systems by a particle accelerator. This fact allows the use of source intensity variations and the corresponding reaction of the reactor to monitor the reactivity of the system and to evaluate its kinetic parameters.
The complete kinetic response (without feedback) of the reactor to any arbitrary source perturbation can be derived from the experimental response of the reactor to a short pulse of the neutron source (ideally a time Dirac delta source). GENEPI allows the generation of neutron pulses with a duration shorter than 1µs, which in practical terms can be considered as instantaneous when compared to the MASURCA neutron generation lifetime ≈0.58µs (experimental value). In this way, the measurement of the neutron reaction rates versus time following a pulse of neutrons generated by GENEPI, Pulse Neutron Source or PNS experiments, allow the study of the system reactivity and some combinations of its kinetic parameters.
Figures 7 and 8 illustrate the observed counting rate of different 235U FC in MUSE-4
accumulated for many neutron pulses and after subtraction of the constant level of counting produced by the delayed neutrons and the not negligible inherent source of MASURCA (Pu spontaneous fission and (α,n) reactions). For detectors in the fuel core, Fig. 7, a very simple behavior is observed for all the reactivities. A fast reaction rate increase during the source duration, is followed by a very short 5-10µs stabilization period, leading to an approximately exponential decay. The different decay constants corresponding to different reactivities allow the reactor monitoring. On the other hand the reaction rate on the reflector, Fig. 8, and on the MASURCA shielding present more complex shapes. First the reaction rate increases progressively during typically 20-30µs. Second it follows a exponential decay with a slope
very similar to the core detectors in the same configuration. Finally in the cases of lower keff
(keff < 0.95) the reaction rate slows its decay rate and presents additional structures after a
period, that depending on the reactivity can range from 45µs for keff = 0.86 to 80µs for keff =
0.95.
The one-group point kinetic model (with one delayed family) of a reactor predicts that the time dependence of the neutron flux after a pulse of neutrons is injected is20:
(
e t e t)
t
n( )= βλ′ −λ′ −ρα −α (5)
In this expression, λ′=ρλ (ρ−β) and ρ is the reactivity, β is the effective delayed neutron
fraction, λ is the delayed decay constant and α is the prompt decay constant,
) ( ) 1 ( ) (β ρ ρ$ β
α = − Λ = − Λ . In most cases of interest GENEPI is operated at fixed
frequency and amplitude, producing the same time response after each pulse. As the lowest frequency of GENEPI is 10 Hz, this provides a simplification of the above relation, since for
all cases of interest then, we can make the assumption that λ´t << 1. This yields an
(
e t)
tn( )= βλ′−ρα −α (6)
Thus, the delayed neutrons only provide a constant (with time) source of background.
The point kinetic model is unable to completely describe the observed impulse response functions, however it predicts a reactivity dependent exponential decay as observed at long times after the neutron pulse. Different approaches were followed to analyze the experimental results. Detailed Monte Carlo simulations (with MCNP) of the PNS experiments, allow the reproduction of the results and an explanation of the deviations of the point kinetic model.
The finite duration of the pulse, the time required by the neutron flux to diffuse along the reactor to the detector positions, and the time required to stabilize the neutron flux spectrum in the reflector and shielding, explain the deviation from point-kinetics during the first microseconds after the pulse
On the other hand the slow tail of neutron detections appearing at long times in reflector and shielding detectors at very subcritical MASURCA configurations, can be explained as a consequence of epithermal neutron buffering in the reflector and shielding
regions21. These neutrons can live sufficiently long in the low absorbing reflector and
shielding (half lives > 20µs), and in combination with the higher sensitivity of 235U detectors to slow neutrons, they can dominate the fission counting rate when the flux reaching from the
core starts to disappear. Fast neutron detectors based on the threshold fission of 237Np had
already been tried-out in some measurements and will be used in future MUSE-4 measurements campaigns to minimize this effect.
Fig. 9 shows the comparison of the response of detectors located in different positions
of the reactor for the same core configuration20. Very similar evolution is observed after 30µs
that with the increasing fission generations, the neutron flux is progressively approaching an asymptotic neutron flux distribution that later on evolves at the same rate in all the reactor positions. This behaviour could justify the asymptotic applicability of the point kinetics equations.
It should be noted that both the short and long time periods are strongly dependent on the position and energy distribution of the source and on the nature and relative position of the detector and, in consequence, are not representative of the reactor response to its own fission source. Only the intermediate time interval, after diffusion of the initial source and replacement by fission generated flux and before the reflector buffering becomes a secondary neutron source, has an evolution that is mainly equivalent to the intrinsic reactor kinetics.
V.A.1. Application of direct PNS methods
A first possibility for the interpretation of the PNS experiments is to apply the point kinetics relation between the exponential decay constant α and the reactor kinetic parameters (ρ, β and Λ) to obtain relations between these parameters from the value obtained for α by a exponential fit to the experimental data following the initial ramp-up of the detector reaction rate.
A set of experiments were performed to evaluate the consistency of the determination of the α decay constant from different detector positions and GENEPI operation frequencies. Table X shows this comparison for a set of experiments with different GENEPI frequencies,
always in the same core configuration close to criticality21. Table XI presents the same
comparison for a second set of data corresponding to different core configurations and a fixed
GENEPI frequency (1 kHz)20. Despite the increasing systematic uncertainty (δ) on the α
determination with decreasing reactivity, a clear compatibility of results is obtained for different GENEPI frequencies and between different detectors in the same region. However a
tendency to progressively underestimate α is observed from core to reflector and shielding detectors.
Despite the small differences between the α determination, the point kinetic equations
were applied to obtain ρ, assuming a value of β/Λ= 5800±100 s-1 (obtained from Rossi-α
measurements in a nearly critical configuration, explained later in this paper). Table XII shows the results obtained for the different detectors and core configurations. The reactivity determinations based on core and reflector detector agree within 10% whereas the shielding estimations show differences of up to 25%. The comparisons of these results to the estimation from the SM and MSM techniques show differences between 20% and 30%, however the reactivity change estimations agree to better than 5% between detectors and measurement methods close to criticality, where the SM or MSM technique is more reliable.
In summary a simple interpretation of the PNS experiments, based on the point kinetics equations allows the monitoring of reactivity changes, with precisions better than 5%, and an estimation of the actual value of the reactivity, with an agreement better than 30% respect to MSM techniques. This can be done by a simple fit to the exponential counting rate decay of detectors placed on the core or to the intermediate time interval of the reflector detectors. This approach has the risk that some bias produced by space and energy effects might be introduced in the absolute estimation of the reactivity depending on the nature and position of the detector and on the reactivity itself.
V.A.2. Application of a Method Based on Monte-Carlo Simulation
Several approaches based on detailed Monte Carlo simulations are being explored to improve the precision of the PNS evaluation of the reactivity and kinetic parameters. The aim is to remove the remaining spatial and spectral effects, and in some methods to enable the use of most of the statistics in the analysis.
According to the point kinetic model, when a pulsed neutron source is injected into the core of a subcritical reactor the neutron population decays like a pure exponential, when the delayed neutrons and the inherent source are ignored:
N(t) = N0 exp (- αt) (7)
with α = (1-kp)/l, kp being the prompt multiplication factor and l being the average
generation time of a neutron. When the reactor is close to criticality (namely keff= 0.995) this
decrease, which can be measured through the reaction rate of a detector located into the core,
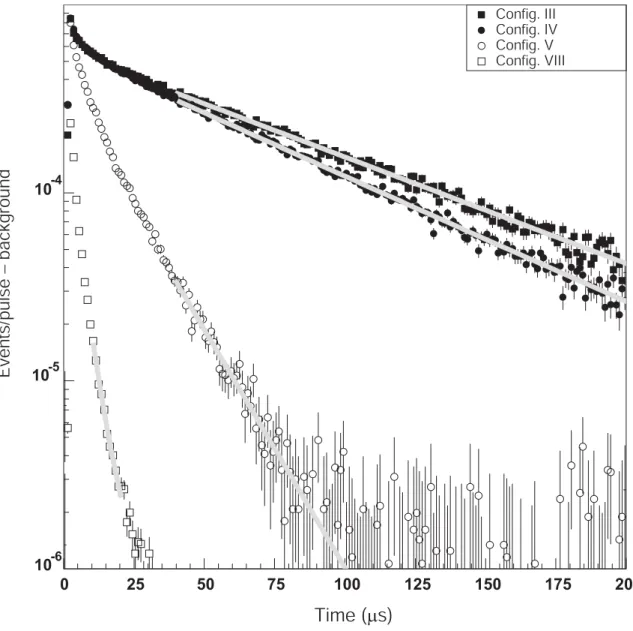
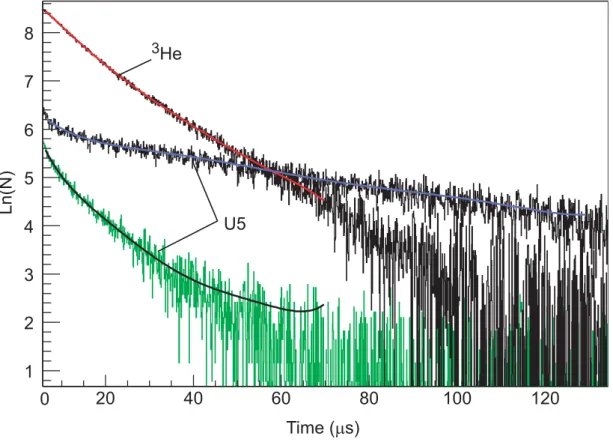
exhibits a constant slope. But for a subcriticality level relevant for an ADS (typically keff=
0.96), the slope becomes time dependent (Fig. 10).
This behaviour can be explained by the fact that when the multiplication factor is low the neutrons from the first generations become relatively more important than the ones of the later generations. That means that an average generation time is not sufficient to describe the
neutron creation. We propose a more sophisticated model24 which takes into account the
distribution of the neutron generation times following a fission P(τ), τ being the time elapsed since the creation of the neutron that will give birth to the next generation. This distribution can be easily obtained by Monte-Carlo simulation for a stabilized neutron source.
From that definition we deduce that
(8)
and thus we can normalise P(τ) to kp = 1. With that normalised distribution P'(τ), we have
access to the number of neutrons in the core at any time for any kp value, summing the
contribution of each generation:
p
k d
P =
N kp (t) = kp P'(τ) + kp2 P'(τ)*P'(τ) + kp3 P'(τ)*P'(τ)*P'(τ) + ... (9)
where * denotes the convolution operator. The decrease rate α kp (t) can then be calculated
for different kp values from the logarithmic derivative:
(10)
and compared to the α (t) obtained from the experimental N(t) spectrum, the one fitting the
best the experiment giving the estimation for the kp value of the reactor. This method has
been applied to the spectra shown in Fig. 10. The α (t) curves obtained from the fits of these
spectra are shown together with relevant calculated αkp(t) curves in Fig. 11. With the U5
chamber the kp values of the core are found bounded by 0.990 and 0.993 for the assembly
close to the criticality, and by 0.955 and 0.960 in the other case. They are in rather good
agreement with the kp values deduced from the SM measurements with kp = keff(1 - β):
0.9922±0.0003 for the configuration III and 0.9563±0.0025 for the configuration V.
The α (t) obtained from the 3He counter exhibits a slightly different behaviour
compared to the U5 data. This can be explained by the location of the counters: the U5
chamber is in the middle of the fuel zone while the 3He counter is close to the reflector and
thus submitted to more low energy neutrons. To improve measurements in such locations the use of detectors with energy threshold (like 237Np, 238U or 232Th FC for instance) is required.
This method is very promising as it can include the contribution from the measurement made in the first tens of microseconds after the pulse, where the counting rate is still high, in the estimation of kp value, reducing the dependency on later times after the pulse
where the statistic might be poor. Moreover it has the potentiality to reduce the absolute bias dt dN N t kp 1 ) ( = α
of the estimation of keff, from the simple point kinetic model, where it has been shown in the
previous section that the agreement between the theoretical α value given by the point kinetics model and the direct exponential fits to the experiments can have deviations from 5% to 25% depending on the detector location.
This method and its robustness are detailed in Ref. 24.
V.A.3. Determination of ρ($)
A different application of the direct point kinetics has been used to extract ρ$ without
the need of any external parameter. This method, also known in literature as the Sjöstrand
method25, is based on the determination of the ratio between the prompt and delayed areas,
For a single isolated pulse the ratio of the integrals of the prompt PN and delayed components DN equates to PN/DN=-ρ/βeff =ρ$. In the experiments at MUSE, the frequency is higher than
the inverse of the delayed neutrons precursors lifetime and in consequence the delayed neutrons of many preceding pulses pile up to form a base level for the prompt component of each pulse. Several minutes after a fix frequency and intensity have been set in GENEPI, the base level of detection rate due to the delayed neutrons reach its asymptotic value and remains constant unless the frequency or the intensity are modified. GENEPI stability is better than 1% in both parameters. In addition, the inherent source due to the Pu spontaneous fission and the (α,n) reactions also contribute to the value of the constant base level.
To obtain the ratio PN/DN in the MUSE experiments, first the inherent source has to be subtracted. This has been done either by a calibration, measuring without external source, or by comparing two measurements with different frequencies. After this subtraction, the distribution of the counting rate between two pulses (accumulated for a large number of pulses) is analysed. The delayed neutron contribution is obtained by multiplication of the constant level observed at the end of the GENEPI period times the period duration. The prompt integral is obtained as the total number of counts minus the delayed neutron
contribution. Table XIII shows the results for several MUSE configurations and can be
compared with Table XII.
The agreement of the different reactivity estimations from different inherent source
subtraction and frequency combinations is better than 20%. The comparison of different
detectors is also better than 20% in all cases and in many cases better than 5%. Finally the results have a small tendency to calculate higher ρ values than the direct PNS fitting, with differences below 10%.
V.B. Noise Measurements V.B.1. Rossi-α Method
The Rossi-α technique26 is based on the statistical nature of the fission-chain process.
Using a coincidence acquisition system, the rationale is to experimentally determine the probability distribution of detecting neutrons from the same chain. The Rossi distribution, related to the correlation function of neutron detection time series, can be derived theoretically through a birth-to-death probability balance equation, namely the backward
master equation27. Here, we only consider the following Rossi distribution prossi for a point
kinetic model without delayed neutrons:
g c c c c c g g c g rossi dt e t t D dt F dt F dt dt p = − Λ + = − τ α ε ε ε τ ατ), 2 ( ) ( 0 0 2 (11)
The above expression can be heuristically derived. The Rossi-α experiment is as
follows. There are two input channels: a trigger channel with detection efficiency εg and
counting channel with efficiency εc. Those two channels can be provided by either a single
detector (auto-correlation) or two separate detectors (cross-correlation). A time gate ∆T divided in bins of width dtc is opened at a certain time tgby a pulse from the trigger channel.
Some bins dtc corresponding to the elapsed time between the occurrence of a pulse from the
timemarking acquisition system is capable of recording all the events of any detector and thus makes possible an offline data reduction, a time gate of width ∆T is opened for each trigger pulse. This data processing is referred as to the Rossi-α type I in the literature. According to
the above equation, the number of coincidence counts nrossiin a bin i corresponding to the lag
t = idtc is given by:
. ) ( t corr rand rossi t n n e n = + −α (12)
The uncorrelated or random component nrand is:
c c g
rand N Fdt
n = ε 0 (13)
where Ng = εgF0T, the number of time gates, is proportional to the acquisition duration T. The
correlated component ncorr is:
. 2 2 c c g corr dt D N n Λ = α ε (14)
Assuming that the number of coincidence counts nrossi approximately follows a Poisson
distribution, its standard deviation σnrossi is:
. ) ( ) (t nrossi t nrossi = σ (15)
We have performed Rossi-α experiments in the MUSE-4 Reference core
(configuration VII, GENEPI off) with the pilot rod down. The corresponding reactivity is ρREF
= -120 ± 7 pcm (as measured by RD techniques). We are presenting in this section the different α-values obtained with the Rossi method. Eight runs of 2800 s were done with our time marking acquisition system. The dwell time was set to 100 ns. It is important to note that
we had to move the most efficient monitors to the reflector region for noise experiments in order to obtain sufficient count rates.
Rossi-α (and Feynman-α for that matter) experimental data series are analyzed with the use of a least squares fitting method. For evaluating the goodness of fit, one uses graphical and numerical indicators. The scatter plot should not display any pattern or trend. In other words, the residuals (the differences between the response values and the predicted response values should be random errors. Classically, a good fit is indicated by the square of the
correlation coefficient r2 being nearly unity. This parameter measures how successful the fit
is in explaining the variation of data. The root mean squared error, RMSE, is another statistic closely related to the scatter plot since it is defined as the square root of the summed square of residuals divided by degrees of freedom. One hopes for generally low values of the RMSE.
The Rossi-α fitting model is p(t)=nrossi(t)/nrand. The domain of fit spans from 10µs to
1ms since in the case of cross-coincidence the lag t is not likely to be less than 10µs. An example is shown in Fig. 12, where we show the Rossi-α curve and the residuals.
In Table XIV we show fit results for different detector pairs located in different parts of the core. The detectors D3 and D4 in the reflector (in L3 and L4 respectively), and D8 and D5 in the core (in L7 and L5 respectively) do not allow us to accurately estimate α-values because their poor efficiency leads to poor statistics. We also note that while the standard errors are about 1% for detectors D10 and D11 (located in the reflector in L1 and L2), the discrepancies between α-values are quite large. For the moment, lacking further information, we express this variability as a type-B uncertaintyb as follows:
2 min max α α δ = − . (16)
Thus, we can give our best estimate of α and associated uncertainty as follows21: %). 4 . 8 ( 673 8017± −1 = ± = s RA α δ α
As another Rossi-α example, we show the distribution for configurations VII and VII with the PR inserted to be very close to criticality23 (ρ= -120 pcm and ρ= -20 pcm) in Fig. 13.
Due to the high level of the inherent source, the signal to noise ratio is extremely smallc,
around 0.1%, which has made it necessary to share the counts of the two detectors used in the experiments as if they were actually one. This is a good assumption since both detectors have approximately the same mass and they are located in symmetrical positions.
The first thing that can be observed, and which happens for both configurations, is that it is necessary to analyze the exponential decay after a short delay time of around 30 or 40 µs.
Although this is a deviation from the assumed point kinetics, it must be taken into account that the detectors are not placed in the fuel region but in the reflector, so there is the time the neutrons need to arrive at the detector (as is also seen in the case of the pulsed neutron source experiments).
When comparing the different exponential decays the different reactivity levels for the two different configurations can be clearly observed in the values of the prompt decay
constant, α. This feature can be used for reactivity off-line calibration, however, very long
acquisitions would be required for a more subcritical situation.
Results from additional measurements are shown in Table XV. Included in this series is a measurement made at a subcritical level of -3795 pcm (configuration VI) to analyze applicability of the method for realistic ADS conditions.
Table XV shows that the spread between measurements for the same experimental conditions is almost negligible, whereas a discrepancy between the results for two symmetrical positions measured with the same detector type (uranium-235 fission chamber)
can be observed. This is the same behaviour as noted above, and again for the moment we are assuming this is a type-B uncertainty (again of the order of 8%). However, further investigations will have to address whether this difference is due to different reactor physics at these positions or results from detector and/or electronics characteristics.
Fig. 14 presents the results for a deep subcritical configuration. Very poor statistics was collected on this experiment. New measurements are scheduled to collect additional statistics at this subcriticality level.
V.B.2. Feynman-α
Feynman and de Hoffman28 showed that the number of counts c in a time gate ∆T
deviates from a Poisson distribution because of the fluctuations of the neutron population driven by the fission chain process. For a given time gate ∆T, the deviation is measured by the y-value defined as:
1 1 var − = 2 − 2 − = c c c mean iance y (17)
That expression can be generalized to the case of two different detectors k and l with detection efficiencies εk and εl, respectively:
l k l k l k l k l k c c c c c c T y , (∆ )= − −δ , (18)
where δk,l is the Kronecker symbol. For k ≠l, the numerator of the y-value is a covariance
term.
The y-value is related to the Rossi distribution through the average number of pairs counted in a time gate ∆T:
∫
∫
− = − ∆ tc g c rossi g T c l k l k t t p dt dt c c 0 0 , ) ( 2 ) ( δ (19)One thus obtains the following expression for the y-function assuming a point kinetic model and considering prompt neutrons only:
∆Τ − 1 − 1 Λ = ) ∆Τ 2 2 − ∆Τ α α ε ε D e α y k l l k, ( (20)
The standard deviation σy of the y-value can be approximately derived from those of
the sample variance and mean of the normal distribution:
l k l k l k l k l k y m m c c y N y = + + + = , , , , 1 2, 1 σ (21)
where N is the number of samples (i.e. the number of counts) for a given time gate ∆T.
The y-value can be sometimes negative because of either a dead time effect at high counting rates28-30 or a poor statistics in a system with neutron generation times Λ less than 10
µs30. Assuming a non-paralyzable counting system, Yamane proposed the following improved
formula in Ref.29: l k l k d l k y Rd y , = , −2 δ , (22)
where d and R are the total dead time and the counting rate associated to a neutron channel, respectively. While we have not completely analyzed our system’s dead-time, we have found that it is necessary to add a positive constant term to the covariance-to-mean model in order to
successfully fit the experimental data series. We show the results after the correction has been made in Table XVI.
The α-estimates obtained with the detectors D8 and D5 are rejected because of their
poor statistical indicators. For the other detectors, the discrepancies between α-values are quite large even if the standard errors are less than 2%. Their variability is measured in the same manner as the Rossi-α case. Thus the best estimate for a reactivity level of a –120 pcm is21: %) 1(8.3 688 ± 8244 = ± = − Α s F α δ α
In Fig. 15, the Feynman-α distributions for configurations with a reactivity of ρ =
-120 pcm is shown23.
We note that the variance to mean ratio is negative. However, after applying
corrections31, we can remove this problem and the experimental results can be described by
the classical model. The α-values extracted from the Rossi- and the Feynman- α technique are coherent within the uncertainties. This might be explained taking note that the Feynman-α expression can be obtained by integrating the Rossi-α formula.
The Feynman-α distribution for the configuration VI (ρ = -3795 pcm) is shown. As in
the previous cases, the correction of equation (22) had to be introduced before fitting. In addition the first points were discarded from the fit. The value of α is different enough to be used for reactivity monitoring. However, and as it happened in the pulsed neutron source experiments, trying to extract a direct value of the reactivity from α can be considered as a first approximation and several corrections must be applied in order to give a precise value.
Applying the Fourier Transform operator ,
∫
dτexp(−iwτ) , to the auto and cross correlation function described in section V.B.1, we get the expressions for the auto- and cross-power spectral density functions:From the break frequency of both spectral densities, the α-value of the system can be obtained. Because the signal to noise ratio is very low, we cannot extract the reactor frequency from the auto power spectral density and we used only the cross power spectral density.
The measurements were performed in continuous current mode using a pair of high efficiency fission chambers (D10 and D11) placed in positions L1 and L2. The fission chamber current is passed through a high bandwidth current to voltage converter and amplifier is used to record the fission chamber current. The amplifier includes a high-pass filter to remove the high voltage DC part in the signal. After additional amplifiers and anti-alias filters the signal is sampled and recorded by PC. Because we operate in current mode no dead time correction is applicable. Measurements at deeply subcritical (configuration VIII, about -15000 pcm) were performed in order to get the electronic transfer function assuming that in the frequency bandwidth used (70Hz, 4kHz) the system frequency cannot be measured because it is higher.
Here two detectors with high efficiency were located at the position L1 and L2 in the reflector. The increased efficiency together with the relatively high neutron flux level at these positions allowed us to perform the measurements in continuous current mode. The Fig. 17
(
)
02 2 2 2 0 2 2 1 2 F w F D APSDDD g g g g α α ε ε + + Λ = (23)(
2 2)
0 2 1 2 F w D CPSDDD g c c g = αΛ α + ε ε (24)shows the CPSD between the detectors after a measurement of 50 minutes at a power of 20 Watts. From the APSD of either detector, it was not possible to get an accurate value for α because of the strong inherent spontaneous fission source, which leads to a very low signal to noise ratio. The α obtained from the CPSD, however, corresponds reasonably well with the values obtained with the pulse-mode experiments.
V.B.4. Summary of Noise Methods
In the previous sections, we presented some preliminary results from Rossi-α, Feynman-α and CPSD noise measures.
In the Rossi-α, we showed statistical fits with correlation coefficients on the order of 0.95, and least squares residuals on the order of 1% for each individual measurement. However, comparison among measurements exhibits a greater spread than would be obtained by true 1% measurements, so we have assigned Type-B uncertainties on the order of 8%. This is not entirely unexpected as the signal to noise (S/N) ratio of our measurements are typically on the order of 0.1%. Most of the measurements were performed close to critical, but we did make some around k=0.96. While the statistics are very poor, it was possible to extract an α value. However, more work has to be performed before we can truly assess the uncertainties of such measurements at more sub-critical levels.
The conclusions from our Feynman-α measurements are essentially the same as the Rossi-α (as they should be given the relation between the two). Again, we have poor measures without using high efficiency detectors, and we see the same 8% spread in comparing separate measures. At k=0.96 an α was inferred, but again we must assess the uncertainties.
Finally, CPSD measures demonstrated the inference of α through the break frequency. As in all cases, the low S/N ratio is a problem.