Article
Towards actionable international comparisons of
health system performance: expert revision of the
OECD framework and quality indicators
F. CARINCI
1,2, K. VAN GOOL
3,4, J. MAINZ
5, J. VEILLARD
6, E. C. PICHORA
6,
J. M. JANUEL
7, I. ARISPE
8, S. M. KIM
9, and N.S. KLAZINGA
3, ON BEHALF
OF THE OECD HEALTH CARE QUALITY INDICATORS EXPERT GROUP
*1
National Agency for Regional Health Services (AGENAS), Rome, Italy,
2University of Surrey, Guildford, United
Kingdom,
3Organisation for Economic Cooperation and Development (OECD), Paris, France,
4Centre for Health
Economics Research and Evaluation, University of Technology, Sydney, NSW, Australia,
5University of Southern
Denmark, Odense, Denmark,
6Canadian Institute for Health Information (CIHI), Toronto, Canada,
7University of
Lausanne, Lausanne, Switzerland,
8National Center for Health Statistics, Washington, DC, USA, and
9Health Insurance
Review and Assessment Service, Seoul, Korea
Address reprint requests to: Fabrizio Carinci, Professor of Health Systems and Policy, School of Health Sciences, Faculty of Health and Medical Sciences, Duke of Kent Building, University of Surrey, Guildford, Surrey, GU2 7XH, UK. Tel: +44 1483 68 8545; Fax: +44 1483 68 6736; E-mail: [email protected]
*Complete list of contributors is available in Appendix.
Accepted 8 January 2015
Abstract
Objective: To review and update the conceptual framework, indicator content and research priorities
of the Organisation for Economic Cooperation and Development
’s (OECD) Health Care Quality
Indi-cators (HCQI) project, after a decade of collaborative work.
Design: A structured assessment was carried out using a modi
fied Delphi approach, followed by a
consensus meeting, to assess the suite of HCQI for international comparisons, agree on revisions to
the original framework and set priorities for research and development.
Setting: International group of countries participating to OECD projects.
Participants: Members of the OECD HCQI expert group.
Results: A reference matrix, based on a revised performance framework, was used to map and
as-sess all seventy HCQI routinely calculated by the OECD expert group. A total of 21 indicators were
agreed to be excluded, due to the following concerns: (i) relevance, (ii) international comparability,
particularly where heterogeneous coding practices might induce bias, (iii) feasibility, when the
num-ber of countries able to report was limited and the added value did not justify sustained effort and (iv)
actionability, for indicators that were unlikely to improve on the basis of targeted policy interventions.
Conclusions: The revised OECD framework for HCQI represents a new milestone of a long-standing
international collaboration among a group of countries committed to building common ground for
performance measurement. The expert group believes that the continuation of this work is paramount
to provide decision makers with a validated toolbox to directly act on quality improvement strategies.
Key words: conceptual framework, health policy, health systems research, OECD Health Care Quality Indicators project, performance measurement, quality indicators
Advance Access Publication Date: 10 March 2015 Article
Introduction
Health care quality is a core dimension of health system performance within which reliable standardized indicators have become increasing-ly available [1,2]. Originally developed with the aim of improving patient outcomes in specific health care settings, health care quality indicators now yield comparative information to be used for monito-ring, management and policy making within and across health care systems [3–6].
Under the umbrella of the Organisation for Economic Coope-ration and Development (OECD), the‘Health Care Quality Indicators’ (HCQI) Project was initiated in 2001, with the aim of developing and reporting common indicators for international comparisons of health care quality [7]. The general objective was to help Member States (MS) identify priority areas for quality improvement and to provide an indication of achievable standards by examining results among best performing countries.
In 2006, the OECD released a common conceptual framework for health system performance, within which the core quality dimension was envisaged as a nested matrix, including an initial list of candidate indicators under the vertical dimensions of‘effectiveness’, ‘patient safety’ and ‘responsiveness/patient-centeredness’ [8].
Consistent with the conceptual framework released by the US In-stitute of Medicine [9], such dimensions were horizontally subdivided according to levels of health care needs over the life cycle:‘staying healthy’ for healthy subjects, ‘getting better’ for people affected by a disease,‘living with illness or disability’ for those living with a chronic condition and‘coping with end of life’ for terminal patients. Since then, the quality matrix had been used to define the scope of the HCQI project without further revision.
Over the past decade, an ongoing activity of data collection and statistical analysis has been carried out, progressively expanding the coverage of the matrix and the number of countries involved. Coordi-nation and management of the process has been ensured by a continuous dialogue between a central OECD secretariat and a representative group of HCQI experts from OECD and non-OECD countries, international organizations including the World Health Organization and the European Commission and other relevant collaborating institutions, including universities, subject matter experts and research organizations. Since 2007, results of the HCQI project have routinely contributed to international comparisons through the publication of the OECD series‘Health at a Glance’ [10] and the release of OECD Health Sta-tistics alongside other international health data on expenditure, re-sources, utilization and outcomes.
In 2013, the OECD HCQI data collection process included a total of 70 indicators covering the following‘themes’: Primary Care (PC); Acute Care (AC); Mental Health (MH); Cancer Care (CC); Patient Safety (PS) and Patient Experiences (PEs). The collection reports data from 34 countries, including non-OECD member countries such as Singapore and Latvia [11].
Alongside the regular data collection, there has been a concerted research and development (R&D) effort to continuously improve the definitions and availability of quality indicators for the inter-national comparability of results achieved by health care systems. New indicators have been pilot tested and data specifications included in a reference guide used to instruct the global data collection [12]. A common goal for the HCQI program of work was also strengthening the national information infrastructure to produce more complex and reliable indicators in an increasing number of countries [13,14].
During recent years, the production of performance reports using standardized HCQI definitions has continued to increase at the
international, national and subnational level [15–19]. Despite these successes, following the completion of the 2013 OECD data collection, it was evident that the data collection methodology was becoming more complex and demanding on countries and that the growing numbers of indicators and participating countries was placing additional burden on the coordination and management of the project. Moreover, HCQI experts generally agreed that more attention to the choice of indicators and R&D studies was needed, including prioritizing indicators that have proven to be reasonably ‘actionable’ by decision makers to improve quality of care and health outcomes.
The present paper summarizes the results obtained to respond to the following questions:
• Is the OECD conceptual framework for the HCQI still relevant? • How to allocate each indicator to a unique position in its structure? • What are the essential criteria to adopt future HCQI?
• Using defined assessment criteria, which indicators should be re-tained or dropped from the set of indicators, and how often should they be measured?
• Which research and development activities are needed to improve the international comparability of HCQI?
This paper reports the results of the framework review and the critical appraisal of the indicators undertaken to respond to the questions above, as well as the structure and content of the revised OECD frame-work agreed by the Expert Group, and the set of research and deve-lopment (R&D) activities endorsed by the Health Committee of the OECD.
Methods
The study design was based on a modified Delphi procedure, which included a review of the evidence on quality indicators conducted by a panel offive experts, two rounds of ratings according to predefined criteria and afinal consensus meeting. The study was conducted between May and November 2013.
Initially, all HCQI were allocated to the original OECD conceptual framework, according to the themes that historically guided indicator development within the project (e.g. MH, CC and PC).
A Delphi data collection sheet was developed, comprising a set of standardized worksheets, one for each theme, through which a small panel offive experts independently scored each indicator according to six criteria (Table1). Scores were expressed on a Likert scale of agreement, ranging from 1 to 9 (strongly disagree to strongly agree). Additional columns requested expert opinion on: (i) whether to keep and report regularly, keep and report less frequently, or drop the indicator from future OECD HCQI data collections; (ii) degree of priority for R&D to improve international comparability of the indicators (five-point scale, very low to very high) and (iii) optional comments. Indicators routinely reported as part of the HCQI project but not included in the data collection (e.g. childhood and influenza vaccination rates) were excluded from the questionnaire.
Although relevance was used as a gating criterion for the inclusion/ exclusion of indicators, ratings were requested for all criteria to under-pin the calculation of averages and the discussion/modification of initial scores.
Ratings were revised in person at a one-day meeting, organized to (i) undertake a critical review of the full set of indicators currently available at the HCQI, (ii) identify an agenda for future R&D work and (iii) develop a set of recommendations for the broader expert group.
These recommendations were discussed at afinal consensus mee-ting, where the broader HCQI expert group agreed on: (i) indicators that should be kept or omitted from future HCQI data collections and (ii) priorities for a future R&D agenda on indicators of quality of care.
Results
The HCQI Expert Group agreed that the 4 × 3 quality matrix repre-sented the appropriate scope for the project.
The revised structure of the broad OECD conceptual framework within which the HCQI is included is presented in Fig.1.
Minor changes to the original structure were agreed upon: • change the wording of‘staying healthy’ to ‘primary/secondary
pre-vention’ to provide a clearer distinction with ‘living with illness and disability—chronic care’
• include the categories of‘individual patient experiences’ and ‘inte-grated care’ under the theme of ‘responsiveness’, to pave the ground for future indicator development
Scores agreed by the panel are shown in Table2. On average, the Delphi panel scored relevance, actionability and validity higher than reliability, international feasibility and comparability, recommending omission for 25 indicators. The panel suggested dropping six indica-tors from each of the groups of PS and PEs, while recommending to retain all three CC indicators.
For indicators recommended for retention, the average scores ran-ged between 5.4 (PEs) and 7.4 (CC). For‘omit’ indicators, average scores ranged between 5.3 (PEs) and 6.7 (PS).
In terms of relevance, scores were generally very high, with the notable exception of indicators in the area of PEs, e.g.‘difficulty to travel’ (considered too generic as a question to patients), and five more indicators related to waiting times and cost ( perceived to be more relevant for‘access’).
Lower relevance and validity scores were allocated to indicators that were more likely to capture differences among local clinical prac-tices and way of organizing health care services, rather than aspects of quality of care. On this basis, MH readmissions indicators were dropped considering the varying roles of hospitals in disease manage-ment across countries.
Both relevance and reliability led to omitting paediatric PS indica-tors, considered to be more likely reflecting quality issues for overall PS rather than the specific target population.
Similarly, low reliability and feasibility scores were attributed to indicators where regularly collected data were limited (e.g. retinal examination in diabetes for which onlyfive countries provided data in 2013) or where not all required data elements were consistently available (e.g. hip fracture surgery within 48 h, where there is cross-country variation in recording the exact time of surgery). Exclusion was also recommended when the uniform application of standardized definitions was considered difficult, e.g. accidental puncture and postoperative haemorrhage or haematoma, or could easily lead to a very small numbers of adverse events, e.g. paediatric safety indicators.
Further R&D was recommended for indicators considered border-line under the same criteria: (i) exploring the reasons of large variation in surgery within 48 h after hip fracture, (ii) use of different definitions or proxies of in-patient suicide in MH, (iii) impact of data capturing systems on excess mortality in MH and (iv) heterogeneous approaches to CC measurement.
In terms of actionability, lower average scores were assigned to hypertension hospital admission in PC, in-hospital mortality in AC, all indicators excluded from PS (except for retained surgical item) and waiting time on day of consultation, consultation skipped due to difficulties in travelling in PEs. In these cases, the panel agreed that it was difficult for policy makers to identify immediate solutions that would counteract underperforming results.
International feasibility oriented choices towards a sustainable data collection. Three case-fatality indicators for events occurring‘in any hospital’ were dropped, as they were regarded as adding little value to the other six mortality indicators already present in the frame-work. All in-hospital indicators for the‘same hospital’ were recom-mended for retention, due to their large degree of availability.
In terms of international comparability, a major concern was ex-pressed for different coding practices, particularly for diagnoses and medical procedures. Hospital admissions for hypertension were dropped for the likely under-reporting of conditions recorded as prin-cipal diagnosis. Similar concerns were expressed for cross-country variation in the recording of secondary diagnoses, which can impact on the accuracy of indicators in given performance domains, e.g. PS. Moreover, the panel suggested to pool indicators on diabetes admis-sions with and without complications and to carefully revise the def-inition of lower amputations, recognizing cross-country differences in coding and data capture for these indicators.
Improved comparability was at the basis of many recommendations for R&D.
In relation to coding, the panel recommended investigating the following: role of primary and secondary diagnosis, different definitions of admissions/discharges, use of transfers and criteria to map indicators across ICD9–10. Other activities suggested include defining composite measures for PC indicators, assessing indicators of pharmaceutical prescriptions, reporting of secondary diagnoses in PS indicators, statistical methods and national representativeness of CC indicators and sampling methods and validated definitions of ‘doctor’ and ‘regular doctor’ in PE surveys.
Table 1 Criteria used to score HCQI Criterion Definition
Validity Sufficient scientific evidence exists to support a link between the value of an indicator and one or more aspects of health care quality Reliability Repeated measurements of a stable phenomenon
get similar results
Relevance An indicator measures an aspect of quality with high clinical importance, a high burden of disease or high health care use
Actionability An indicator measures an aspect of quality that is subject to control by providers and/or the health care system and is actually used at a national level for policy making, monitoring or strategy development
International feasibility
An indicator can be derived for international comparisons without substantial additional resources
International comparability
Reporting countries comply with the relevant data definition and where differences in the indicator values between countries reflect issues in quality of care rather than differences in data collection methodologies, coding or other non-quality of care reasons
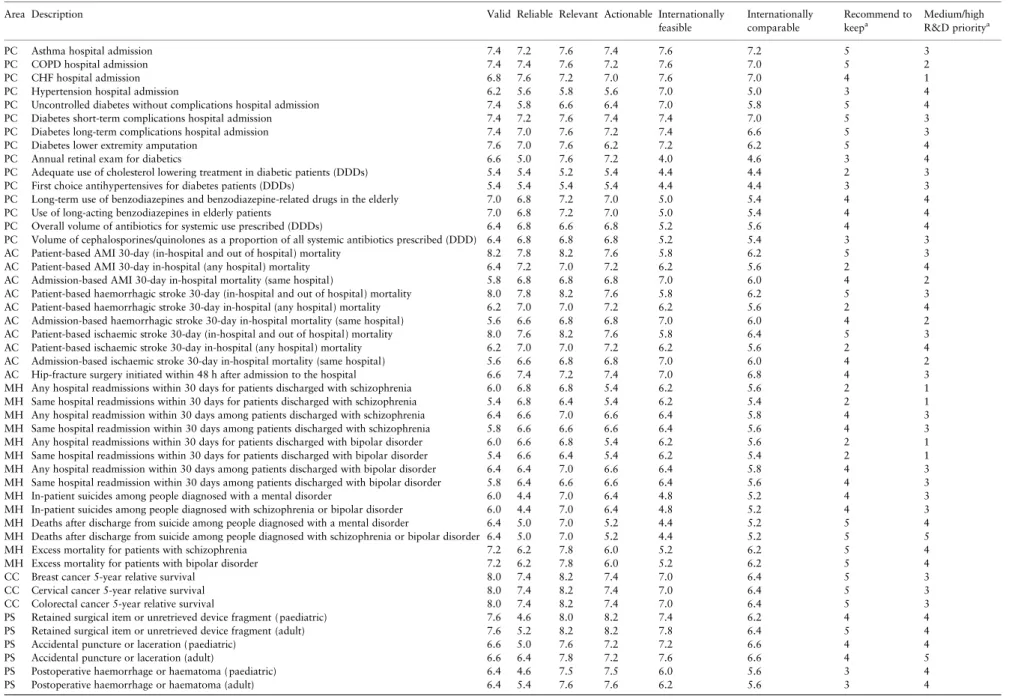
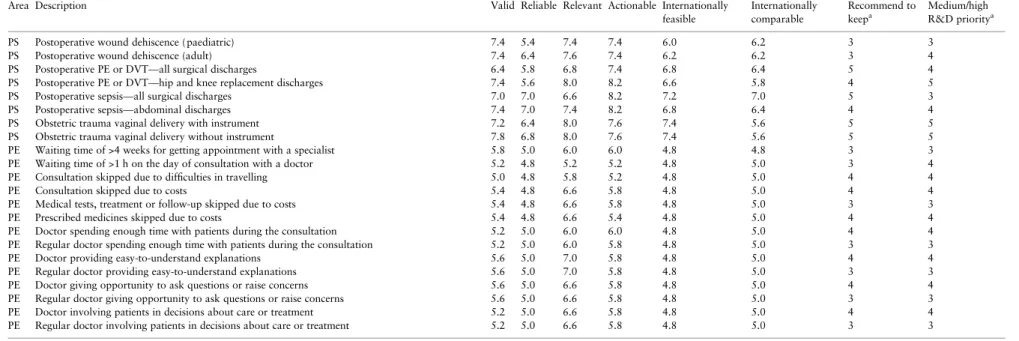
Final average scores for all indicators and all criteria included in the questionnaire are reported along with the number of experts sup-porting retention and prioritization of R&D in Table A1 in Appendix. Thefinal consensus meeting adopted all recommendations made by the Delphi panel, with the only exception of four indicators of PEs previously moved to‘access’, which were reintegrated into the quality dimension (waiting time on the day of appointment, consul-tation skipped due to costs, medical tests, treatment or follow-up
skipped due to costs and prescribed medicines skipped due to costs). Six additional prescription safety indicators obtained from a previous study were also added [20].
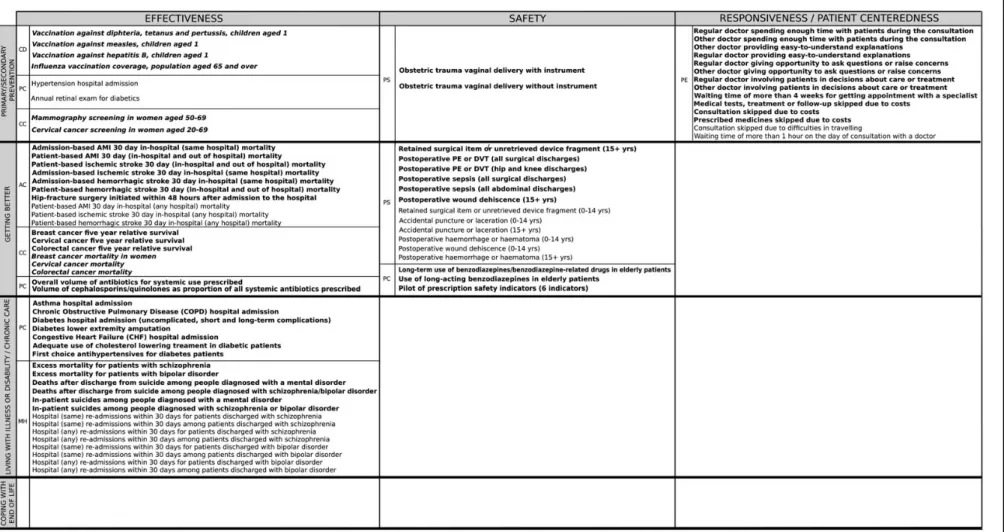
Thefinal allocation of each indicator to a unique position in the 4 × 3 quality matrix is shown in Table3, including (i) indicators re-tained for the 2015 data collection (in plain bold), (ii) indicators in-cluded in the framework, but not part of the routine biennial data collection (in italic) and (iii) dropped indicators (in plain text). The
content of the matrix presents a triangular pattern with an empty row at the bottom. Among vertical dimensions, the one most covered is ‘ef-fectiveness’, followed by ‘safety’ and ‘responsiveness’. The horizontal dimension of‘coping with end of life’ is still empty for international comparisons.
The classification allowed for different themes to fit into the same cell in the matrix (e.g.‘living with illness’). However, experts noted that for several indicators more than one domain could be considered along one or both axes depending on the context. For example: pre-scribing indicators for antibiotics may fall under‘effectiveness’ (i.e. high rates reflect prescription beyond indication or inappropriate/inef-fective use) or‘safety’ (i.e. high rates may affect future resistance); hypertension may fall under‘primary or secondary prevention’ or ‘li-ving with illness’ depending on whether it is viewed as a modifiable risk factor for future disease development or as a disease; obstetric trauma as a safety indicator may equallyfit under the health care needs category of preventive intervention or under‘getting better’; PEs may provide responses on visits done by healthy subjects or people with chronic diseases.
In thefinal mapping, allocations were based on expert agreements on the most prevalent contextual interpretation for each indicator. However, experts advised that the multi-dimensional nature of many HCQI shall be given adequate consideration in the interpreta-tion of the results.
Discussion
This critical appraisal produced international consensus on the revised structure and content of the OECD framework for HCQI.
Overall, agreement was reached on omitting 21 and retaining 49 indicators of those included in the 2013 data collection. The amalga-mation of diabetes indicators and the further addition of prescription safety indicators lead to a total of 53 indicators, plus additional 9 in-dicators collected by other means, for a total of 62 inin-dicators foreseen for data collection and publication in 2015.
The appraisal offered a unique opportunity to bridge past achieve-ments with the resolution of current challenges in the international comparison of health systems.
The results achieved can be seen as a concerted response to resol-ving the challenges in the international comparisons of health systems, building upon principles described elsewhere as sets of‘must do’s’ and ‘trade-offs’ [4].
For‘must do’s’, the appraisal provided a way forward to reinforce the‘legitimacy’, ‘validity’, ‘feasibility’ and ‘technical support’ in the production of international comparisons of quality of care for OECD countries.
The process adopted for the choice of indicators reinforced ‘legi-timacy’ through shared coordination, producing recommendations as a result of an open dialogue among peers, including a total of 57 international experts representing the countries participating in the project. The agreed R&D plan was jointly developed and tasks as-signed on the basis of voluntary contribution of MS.
Notably, the Delphi panel relied on higher scores for established criteria, e.g. relevance and validity for the initial choice of items re-tained in the revised framework. This is not surprising, because indi-cators that are part of the OECD data collection have stood up to scientific testing at the national level. The choice of including indica-tors that are still difficult to collect, e.g. 30-day in and out of hospital mortality in AC or death after discharge and excess mortality in MH, while excluding MH readmissions that scored even better overall and were reported by many countries, reflects the level of priority assigned by HCQI experts to such fundamental criteria.
However, the fact that actionability stood as the second highest cri-terion met by all quality indicators shows that other practical criteria are equally important to identify a core suite thatfits the needs of policy makers. This criterion clearly oriented the choices for retention in the areas of AC and PS.
The criteria of reliability, international comparability and feasibi-lity oriented further discussions on the omission of indicators and R&D based on the practical experience of the HCQI data collection. In PC, issues of reliability were at the basis of the omission of hospital admission for hypertension and retinal exam for people with diabetes. A total of six PS indicators were recommended for omis-sion, due to either an extremely low volume of cases ( paediatric) or difficult applicability of the definitions and/or inconsistent coding across countries (accidental puncture, postoperative haemorrhage or haematoma).
Improving the reliability, feasibility and comparability of indica-tors is at the core of the cross-cutting R&D agenda agreed by the Expert Group.
One aspect that was recognized to be overtly important was sys-tematic variation in coding practices. For example, payment systems that provide a higher payment for more complicated cases may create an incentive for hospital administrators to ensure that secondary Table 2 Average scores assigned by the Delphi panel for each criterion used to review indicators included in the HCQI 2013 data collection, by theme and recommendation for future data collection
Criterion PC AC MH CC PS PEs Overall
Keep (N = 13) Drop (N = 2) Keep (N = 7) Drop (N = 3) Keep (N = 6) Drop (N = 8) Keep (N = 3) Drop (N = 0) Keep (N = 8) Drop (N = 6) Keep (N = 8) Drop (N = 6) Relevant 6.9 6.7 7.5 7.0 7.3 6.7 8.2 7.6 7.7 6.6 4.4 7.1 Valid 6.8 6.4 6.8 6.3 6.5 5.9 8.0 7.3 6.8 5.4 5.7 6.5 Reliable 6.7 5.3 7.2 7.1 5.2 6.6 7.4 6.3 5.2 5.0 5.1 6.1 Actionable 6.7 6.4 7.2 7.2 5.9 6.0 7.4 7.9 7.5 5.8 5.9 6.6 Internationally feasible 6.2 5.5 6.5 6.2 4.8 6.3 7.0 7.0 6.7 4.8 5.2 6.0 Internationally comparable 6.0 4.8 6.2 5.6 5.5 5.6 6.4 6.2 6.1 5.0 5.1 5.7 Overall 6.6 5.8 6.9 6.6 5.9 6.2 7.4 7.0 6.7 5.4 5.3 6.3
Keep = keep and publish regularly, keep and publish less regularly; drop = omit from future OECD HCQI data collection; N = number of indicators falling in each subcategory.
Table 3 Results of the mapping of OECD HCQI to the revised conceptual frameworka
Carinci
et
diagnoses are widely captured, or countries consistently reporting a higher number of secondary diagnoses are likely to capture more ad-missions for specific indicators, particularly in PS [21]. A related case is coding at different phases of episodes of care, particularly in hospi-talizations. In the HCQI guidelines, the terms‘discharge’, ‘admission’ and‘separation’ have been considered interchangeable to allow wider adherence to the data collection, based on local practices. However, it is possible that results for countries using diagnostic codes at one stage may vary considerably from those recording at other stages.
To explore the effect of these issues on several indicators, the broad group agreed to launch a series of targeted studies, using common pro-tocols across volunteering countries.
The provision of adequate‘technical support’ for data correspon-dents is a direct consequence of increased attention to methodological aspects. With increasing complexity, and the prospective challenge of covering all dimensions of the performance framework, it is important that the data collection process proceeds as efficiently as possible. Tar-geted IT tools can be used to harmonize the application of standard guidelines and to reduce the chance of uneven compliance, e.g. a cen-tral repository of electronic meta-data instead of paper guidelines, the sharing of open-source statistical software for the direct calculation of HCQI and common policies for data exchange are recommended.
In terms of trade-offs, this study highlighted the importance of balancing‘depth and breadth’, ‘aggregation and granularity’ and ‘flexibility and consistency’ when reporting on HCQI. Among these trade-offs, a discussion on the dichotomy between ‘depth’ and ‘breadth’ (i.e. more measures for a specific clinical area vs. measures for a greater variety of clinical areas) was central to reviewing the map-ping of indicators to the conceptual framework and led to the identi-fication of areas in need of further indicator development and reporting, e.g.‘getting better’ for responsiveness, ‘living with illness’ in safety and responsiveness, long-term care and end of life across all dimensions. These aspects have been duly marked for targeted action.
The decision to pursue indicators related to‘in and out of hospital’ mortality in AC and excess mortality in MH reflects MS interest in im-proving the availability of clinical outcomes. Trends in the HCQI data collection show that data collection for these indicators is becoming increasingly feasible among MS, indicating that the health informa-tion infrastructure is improving. For example, between 2007 and 2013, the number of countries able to report the 30-day mortality rate in and out of hospital for the last year available, requiring linking hospital admissions and death records, increased from 12 to 16 [11,
12].
Increased‘depth’ has also been requested for comparisons of PEs, such as exploring how organizational aspects improve clinical path-ways through integrated and continuous care. While these tasks may draw upon innovative performance measurement approaches, e.g. the work in the UK on Patient Reported Outcome Measures (PROMs), it will need targeted attention on articulated concepts, e.g. integrated and coordinated care across health, social, long-term and home care, taking relevant experiences into account [22].
The broad group also agreed to extend the applicability of HCQI at provider level in 2015, particularly at hospital level.
The issue of‘aggregation vs. granularity’ particularly applies to the decision to pilot test composite measures for hospital admissions, such as a composite indicator for asthma, COPD, CHF and diabetes hospital admissions.
The trade-off between ‘consistency’ and ‘flexibility’ has been tackled by an ambitious R&D agenda, including targeted work on im-proved definitions to ensure comparability at all levels. In some cases,
it would require identifyingflexible solutions that can be applied under different conditions. A specific case of consistency failure is deep vein thrombosis in specific surgeries, where attempting to specify a precise set has in fact led to greater difficulty in achieving internatio-nal comparability, rather than less as intended.
An increased attention for the principle of‘actionability’ has been called upon to orient future activities, based on experts’ recommenda-tions to further uptake HCQI outputs in health systems performance assessment. To this end, the broad group agreed to support an initial survey on experiences on using HCQI ( producers, methods and re-porting schemes) at both national and subnational level, to monitor the actual usage of the framework and indicators over time.
Finally, intrinsic limitations of the present appraisal are worth outlining.
The conclusions are based on a Delphi panel of limited size, moderated by the same secretariat coordinating the HCQI project, whosefinal recommendations were produced by a broad group, in-cluding experts and representatives of national governments.
A different multidisciplinary setting, composed of a larger pool of experts completely independent from governmental institutions, may likely lead to different results. However, the completely open, trans-parent and well-structured process put in place by the OECD with the direct participation of MS assures that these results can represent the best possible combination for governments wishing to commit to international comparisons of quality of care.
In conclusion, this appraisal delivered a revised OECD framework for HCQI, a revised set of indicators and a plan for further improve-ment. A number of countries have already indicated a willingness to work together on moving forward the rich international R&D agenda outlined in this paper. The results of this work will be reflected in fu-ture strategies aimed at improving the international comparability of quality indicators in years to come. Such continuous improvements in the data will hopefully lead to more rigorous debates about how policy makers can plan effective action to improve health system perfor-mance for the direct benefit of all citizens.
Acknowledgements
We thank all representatives of OECD member countries and national data cor-respondents involved in the project during the last years, without whom it would have been impossible to provide the revised framework with relevant content of quality indicators. This paper reflects the opinion of the authors and not an official position of the OECD, its Member countries or institutions participating in the project.
Funding
This work has been conducted as part of the regular activities of the HCQI pro-ject, supported by an ongoing contribution of OECD member states agreed on a biennial basis. The face-to-face Delphi meeting organized in September 2013 in Toronto was made possible through the generous contribution of the Canadian Institute for Health Information.
References
1. Smith P, Mossialos E, Papanicolas I, Leatherman S (eds.). Performance Measurement for Health System Improvement: Experiences, Challenges and Prospects. Cambridge University Press, 2009. http://www.euro.who. int/en/about-us/partners/observatory/studies/performance-measurement-for-health-system-improvement-experiences,-challenges-and-prospects (7 January 2015, date last accessed).
2. WHO Europe. The Tallinn charter: health systems for health and wealth. Tallinn, 2008. http://www.euro.who.int/__data/assets/pdf_file/0008/ 88613/E91438.pdf (7 January 2015, date last accessed).
3. European Commission. Directive 2011/24/EU of the European Parliament and of the Council of 9 March 2011 on the application of patients’ rights in cross-border healthcare, 2011. http://eur-lex.europa.eu/LexUriServ/ LexUriServ.do?uri=CELEX:32011L0024:EN:NOT (7 January 2015, date last accessed).
4. Forde I, Morgan D, Klazinga NS. Resolving the challenges in the inter-national comparison of health systems: the must do’s and the trade-offs. Health Policy. http://download.journals.elsevierhealth.com/pdfs/journals/ 0168-8510/PIIS0168851013000341.pdf (7 January 2015, date last ac-cessed).
5. OECD. Improving value in Health Care. Measuring quality, 2010. http ://browse.oecdbookshop.org/oecd/pdfs/product/8110191e.pdf (7 January 2015, date last accessed).
6. WHO. Quality of care: a process for making strategic choices in health systems, 2006. http://www.who.int/management/quality/assurance/QualityCare_B.Def. pdf (7 January 2015, date last accessed).
7. Mattke S, Epstein AM, Leatherman S. The OECD health care quality indi-cators project: history and background. Int J Qual Health Care 2006;18 (suppl 1):1–4. http://intqhc.oxfordjournals.org/content/18/suppl_1/1.full. pdf+html (7 January 2015, date last accessed).
8. Arah OA, Westert GP, Hurst J et al. A conceptual framework for the OECD health care quality indicators project. Int J Qual Health Care, 2006;18 (suppl 1):5–13. http://intqhc.oxfordjournals.org/content/18/suppl_1/5.full. pdf+html (7 January 2015, date last accessed).
9. US Department of Health and Human Services. Agency for healthcare re-search and quality. national healthcare quality report 2005. Rockville, MD: Agency for Healthcare Research and Quality, 2006. http://archive. ahrq.gov/qual/nhqr05/nhqr05.pdf. (7 January 2015, date last accessed). 10. OECD. Health at a Glance 2007: OECD indicators. OECD Publishing,
2007. http://www.oecd-ilibrary.org/docserver/download/8107051e.pdf? expires=1394538460&id=id&accname=guest&checksum=4DBB012BDA 33BCD68DA63960F530BE89. (7 January 2015, date last accessed). 11. OECD. Health at a Glance 2013: OECD Indicators. OECD Publishing,
2013. http://www.oecd.org/els/health-systems/Health-at-a-Glance-2013. pdf. (7 January 2015, date last accessed).
12. OECD. Definitions for health care quality indicators 2013. 2012–2013 HCQI data collection, 2013. http://stats.oecd.org/fileview2.aspx?IDFile=1f 2f61b6-a25a-43e9-a7b8–2954c9942050. (7 January 2015, date last accessed).
13. Oderkirk J, Ronchi E, Klazinga N. International comparisons of health sys-tem performance among OECD countries: Opportunities and data privacy protection challenges. Health Policy 2014;112:9–18. http://download. journals.elsevierhealth.com/pdfs/journals/0168-8510/PIIS0168851013001 681.pdf. (7 January 2015, date last accessed).
14. OECD. OECD health policy studies: strengthening health information in-frastructure for health care quality governance good practices, new oppor-tunities and data privacy protection challenges. OECD Publishing, 2013. http://www.oecd-ilibrary.org/social-issues-migration-health/strengthening-health-information-infrastructure-for-health-care-quality-governance_978 9264193505-en. (7 January 2015, date last accessed).
15. OECD. OECD Reviews of Health Care Quality: Denmark 2013: Raising Standards. Paris, France: OECD Publishing, 2013.
16. Belgian Health Care Knowledge Centre. Performance of the Belgian Health System Report 2012, KCE Report 196c, 2013. https://kce.fgov.be/sites/ default/files/page_documents/KCE_196C_Health_system_performance_0. pdf. (7 January 2015, date last accessed).
17. Irish Department of Health. Health Care Quality Indicators in the Irish Health System. Examining the Potential of Hospital Discharge Data using the Hospital Inpatient Enquiry System, December 2013. http://www.rte.ie/ documents/news/hcqi.pdf. (7 January 2015, date last accessed).
18. Canadian Institute for Health Information. International comparisons: a focus on quality of care, January 23, 2014. https://secure.cihi.ca/ free_products/OECD_AFocusOnQualityOfCareAiB_EN.pdf. (7 January 2015, date last accessed).
19. Van den Berg MJ, Kringos DS, Marks LK et al. The Dutch health care per-formance report: seven years of health care perper-formance assessment in the Netherlands, Health Res Policy Syst. 2014; 12: 1. http://www.ncbi.nlm.nih. gov/pmc/articles/PMC3896735/pdf/1478-4505-12-1.pdf. (7 January 2015, date last accessed).
20. Avery AJ, Dex GM, Mulvaney C et al. Development of prescribing-safety indicators for GPs using the RAND Appropriateness Method. Br J Gen Pract. 2011;61. http://www.ncbi.nlm.nih.gov/pmc/articles/PMC3145537/ pdf/bjgp61-e526.pdf. (7 January 2015, date last accessed).
21. Drösler SE, Romano PS, Tancredi DJ et al. International comparability of patient safety indicators in 15 OECD member countries: a methodological approach of adjustment by secondary diagnoses. Health Serv Res, 2012;47 (1pt1):275–92.
22. Graham C, Killpack C, Raleigh V et al. Options appraisal on the measurement of people’s experiences of integrated care, Picker Institute Europe, March 2013. http://www.pickereurope.org/assets/content/pdf/Project_Reports/P2636_ Integrated%20care%20report_post%20final%20edits_v7%200.pdf. (7 January 2015, date last accessed).
Appendix
Table A1
* Complete list of contributors from the OECD HCQI Project M.Haelterman (Federal Public Health Service), P. Meeus (Institut national d'assurance maladie invalidité), Belgium; J. Lacroix (Canadian Institute for Health Information), Canada; J. Cenek (Ministry of Health), Czech Republic; C.R. Barsøe (Statens Serum Institut), K. Grau (National Institute for Health Data and Disease Con-trol), Denmark; L. Rooväli (Ministry of Social Affairs), Estonia; P. Hämaläinen (National Institute for Health and Welfare), Finland; V. Garcia, (Ministère des affaires sociales et de la santé), C. Grenier, B. Le Cossec (Haute Autorité de Santé), M. Marbach (Ministère du Travail, de l'Emploi et de la Santé), France; C. Scheidt-Nave (Robert Koch Institute), Germany; D. Mulholland (Department of Health and Children), Ireland; A. Ekka-Zohar (Ministry of Health), Israel; T. Kumakawa (National Institute of Public Health), E. Okamoto (National Institute of Public Health), Japan; E.H.Byeon, K.H. Kim, C.S. Park (Health Insurance Review and Assessment Service), Korea; J. Lepiksone (Centre for Disease Prevention and Control of Latvia), Latvia; F. Berthet (Ministry of Health), C. Margue (TNS ILRES), Luxembourg; M. Van Den Berg (National Institute of Public Health and the Environment), Netherlands; A.K. Lindahl (Norwegian Knowledge Centre for the Health Services), H. Narbuvold (Directorate of Health), Norway; E. Dudzik-Urbaniak (National Center for Quality Assessment in Health Care), Poland; P. Boto (Ministry of Health), Portugal; E.K. Lim, W.Y. Mok (Ministry of Health), Singapore; R. Pribakovic Brinovec (Institute of Public Health), Slovenia; M. A. Gogorcena Aoiz (Ministry of Health, Social Services and Equity), Spain; M. Aggestam, M. Köster, M. Lawrence (National Board of Health and Welfare), Sweden; M. Langenegger (Federal Office of Pub-lic Health), K. Fehst (Office fédéral de la statistique), Switzerland; S. Yilmaz (Ministry of Development), Turkey; K. Everard (Depart-ment of Health), V. Raleigh (The King's Fund), United Kingdom.
Area Description Valid Reliable Relevant Actionable Internationally feasible Internationally comparable Recommend to keepa Medium/high R&D prioritya
PC Asthma hospital admission 7.4 7.2 7.6 7.4 7.6 7.2 5 3
PC COPD hospital admission 7.4 7.4 7.6 7.2 7.6 7.0 5 2
PC CHF hospital admission 6.8 7.6 7.2 7.0 7.6 7.0 4 1
PC Hypertension hospital admission 6.2 5.6 5.8 5.6 7.0 5.0 3 4
PC Uncontrolled diabetes without complications hospital admission 7.4 5.8 6.6 6.4 7.0 5.8 5 4
PC Diabetes short-term complications hospital admission 7.4 7.2 7.6 7.4 7.4 7.0 5 3
PC Diabetes long-term complications hospital admission 7.4 7.0 7.6 7.2 7.4 6.6 5 3
PC Diabetes lower extremity amputation 7.6 7.0 7.6 6.2 7.2 6.2 5 4
PC Annual retinal exam for diabetics 6.6 5.0 7.6 7.2 4.0 4.6 3 4
PC Adequate use of cholesterol lowering treatment in diabetic patients (DDDs) 5.4 5.4 5.2 5.4 4.4 4.4 2 3
PC First choice antihypertensives for diabetes patients (DDDs) 5.4 5.4 5.4 5.4 4.4 4.4 3 3
PC Long-term use of benzodiazepines and benzodiazepine-related drugs in the elderly 7.0 6.8 7.2 7.0 5.0 5.4 4 4
PC Use of long-acting benzodiazepines in elderly patients 7.0 6.8 7.2 7.0 5.0 5.4 4 4
PC Overall volume of antibiotics for systemic use prescribed (DDDs) 6.4 6.8 6.6 6.8 5.2 5.6 4 4
PC Volume of cephalosporines/quinolones as a proportion of all systemic antibiotics prescribed (DDD) 6.4 6.8 6.8 6.8 5.2 5.4 3 3
AC Patient-based AMI 30-day (in-hospital and out of hospital) mortality 8.2 7.8 8.2 7.6 5.8 6.2 5 3
AC Patient-based AMI 30-day in-hospital (any hospital) mortality 6.4 7.2 7.0 7.2 6.2 5.6 2 4
AC Admission-based AMI 30-day in-hospital mortality (same hospital) 5.8 6.8 6.8 6.8 7.0 6.0 4 2
AC Patient-based haemorrhagic stroke 30-day (in-hospital and out of hospital) mortality 8.0 7.8 8.2 7.6 5.8 6.2 5 3
AC Patient-based haemorrhagic stroke 30-day in-hospital (any hospital) mortality 6.2 7.0 7.0 7.2 6.2 5.6 2 4
AC Admission-based haemorrhagic stroke 30-day in-hospital mortality (same hospital) 5.6 6.6 6.8 6.8 7.0 6.0 4 2
AC Patient-based ischaemic stroke 30-day (in-hospital and out of hospital) mortality 8.0 7.6 8.2 7.6 5.8 6.4 5 3
AC Patient-based ischaemic stroke 30-day in-hospital (any hospital) mortality 6.2 7.0 7.0 7.2 6.2 5.6 2 4
AC Admission-based ischaemic stroke 30-day in-hospital mortality (same hospital) 5.6 6.6 6.8 6.8 7.0 6.0 4 2
AC Hip-fracture surgery initiated within 48 h after admission to the hospital 6.6 7.4 7.2 7.4 7.0 6.8 4 3
MH Any hospital readmissions within 30 days for patients discharged with schizophrenia 6.0 6.8 6.8 5.4 6.2 5.6 2 1
MH Same hospital readmissions within 30 days for patients discharged with schizophrenia 5.4 6.8 6.4 5.4 6.2 5.4 2 1
MH Any hospital readmission within 30 days among patients discharged with schizophrenia 6.4 6.6 7.0 6.6 6.4 5.8 4 3
MH Same hospital readmission within 30 days among patients discharged with schizophrenia 5.8 6.6 6.6 6.6 6.4 5.6 4 3
MH Any hospital readmissions within 30 days for patients discharged with bipolar disorder 6.0 6.6 6.8 5.4 6.2 5.6 2 1
MH Same hospital readmissions within 30 days for patients discharged with bipolar disorder 5.4 6.6 6.4 5.4 6.2 5.4 2 1
MH Any hospital readmission within 30 days among patients discharged with bipolar disorder 6.4 6.4 7.0 6.6 6.4 5.8 4 3
MH Same hospital readmission within 30 days among patients discharged with bipolar disorder 5.8 6.4 6.6 6.6 6.4 5.6 4 3
MH In-patient suicides among people diagnosed with a mental disorder 6.0 4.4 7.0 6.4 4.8 5.2 4 3
MH In-patient suicides among people diagnosed with schizophrenia or bipolar disorder 6.0 4.4 7.0 6.4 4.8 5.2 4 3
MH Deaths after discharge from suicide among people diagnosed with a mental disorder 6.4 5.0 7.0 5.2 4.4 5.2 5 4
MH Deaths after discharge from suicide among people diagnosed with schizophrenia or bipolar disorder 6.4 5.0 7.0 5.2 4.4 5.2 5 5
MH Excess mortality for patients with schizophrenia 7.2 6.2 7.8 6.0 5.2 6.2 5 4
MH Excess mortality for patients with bipolar disorder 7.2 6.2 7.8 6.0 5.2 6.2 5 4
CC Breast cancer 5-year relative survival 8.0 7.4 8.2 7.4 7.0 6.4 5 3
CC Cervical cancer 5-year relative survival 8.0 7.4 8.2 7.4 7.0 6.4 5 3
CC Colorectal cancer 5-year relative survival 8.0 7.4 8.2 7.4 7.0 6.4 5 3
PS Retained surgical item or unretrieved device fragment ( paediatric) 7.6 4.6 8.0 8.2 7.4 6.2 4 4
PS Retained surgical item or unretrieved device fragment (adult) 7.6 5.2 8.2 8.2 7.8 6.4 5 4
PS Accidental puncture or laceration ( paediatric) 6.6 5.0 7.6 7.2 7.2 6.6 4 4
PS Accidental puncture or laceration (adult) 6.6 6.4 7.8 7.2 7.6 6.6 4 5
PS Postoperative haemorrhage or haematoma ( paediatric) 6.4 4.6 7.5 7.5 6.0 5.6 3 4
PS Postoperative haemorrhage or haematoma (adult) 6.4 5.4 7.6 7.6 6.2 5.6 3 4
Table continues n o f the OECD fr ame work • Q uality s tandards
145
Table A1 Continued
Area Description Valid Reliable Relevant Actionable Internationally
feasible Internationally comparable Recommend to keepa Medium/high R&D prioritya
PS Postoperative wound dehiscence ( paediatric) 7.4 5.4 7.4 7.4 6.0 6.2 3 3
PS Postoperative wound dehiscence (adult) 7.4 6.4 7.6 7.4 6.2 6.2 3 4
PS Postoperative PE or DVT—all surgical discharges 6.4 5.8 6.8 7.4 6.8 6.4 5 4
PS Postoperative PE or DVT—hip and knee replacement discharges 7.4 5.6 8.0 8.2 6.6 5.8 4 5
PS Postoperative sepsis—all surgical discharges 7.0 7.0 6.6 8.2 7.2 7.0 5 3
PS Postoperative sepsis—abdominal discharges 7.4 7.0 7.4 8.2 6.8 6.4 4 4
PS Obstetric trauma vaginal delivery with instrument 7.2 6.4 8.0 7.6 7.4 5.6 5 5
PS Obstetric trauma vaginal delivery without instrument 7.8 6.8 8.0 7.6 7.4 5.6 5 5
PE Waiting time of >4 weeks for getting appointment with a specialist 5.8 5.0 6.0 6.0 4.8 4.8 3 3
PE Waiting time of >1 h on the day of consultation with a doctor 5.2 4.8 5.2 5.2 4.8 5.0 3 4
PE Consultation skipped due to difficulties in travelling 5.0 4.8 5.8 5.2 4.8 5.0 4 4
PE Consultation skipped due to costs 5.4 4.8 6.6 5.8 4.8 5.0 4 4
PE Medical tests, treatment or follow-up skipped due to costs 5.4 4.8 6.6 5.8 4.8 5.0 3 3
PE Prescribed medicines skipped due to costs 5.4 4.8 6.6 5.4 4.8 5.0 4 4
PE Doctor spending enough time with patients during the consultation 5.2 5.0 6.0 6.0 4.8 5.0 4 4
PE Regular doctor spending enough time with patients during the consultation 5.2 5.0 6.0 5.8 4.8 5.0 3 3
PE Doctor providing easy-to-understand explanations 5.6 5.0 7.0 5.8 4.8 5.0 4 4
PE Regular doctor providing easy-to-understand explanations 5.6 5.0 7.0 5.8 4.8 5.0 3 3
PE Doctor giving opportunity to ask questions or raise concerns 5.6 5.0 6.6 5.8 4.8 5.0 4 4
PE Regular doctor giving opportunity to ask questions or raise concerns 5.6 5.0 6.6 5.8 4.8 5.0 3 3
PE Doctor involving patients in decisions about care or treatment 5.2 5.0 6.6 5.8 4.8 5.0 4 4
PE Regular doctor involving patients in decisions about care or treatment 5.2 5.0 6.6 5.8 4.8 5.0 3 3
aNumber of responses over a maximum achievable of 5.
Carinci
et