T. Laswed E. Rizzo D. Guntern F. Doenz A. Denys P. Schnyder S. D. Qanadli Received: 18 February 2007 Revised: 22 July 2007 Accepted: 20 August 2007
Published online: 26 September 2007
# European Society of Radiology 2007
Assessment of occlusive arterial disease
of abdominal aorta and lower extremities
arteries: value of multidetector CT angiography
using an adaptive acquisition method
Abstract We evaluated 16-detector-row CT in the assessment of occlusive peripheral arterial disease (PAD) of the abdominal aorta and lower extremities using an adaptive method of acquisition to optimise arterial enhancement espe-cially for the distal foot arteries. Thirty-four patients underwent transcatheter angiography (TCA) and CT angiogra-phy within 15 days. For each patient, table speed and rotation were selected according to the calculated optimal transit time of contrast material obtained after a single bolus test and two dynamic acquisitions at aorta and popliteal arteries. Analysis included image quality and detection of stenosis equal or greater than 50% on a patient basis and on an arterial segment basis. Sensitivity and specificity of CT were calculated with the TCA considered as the standard of reference. CT was
conclusive in all segments with no technical failures even in difficult cases with occluded bypasses and aneurysms. On patient-basis analysis, the overall sensitivity and specificity to detect significant stenosis greater than 50% were both 100%. Segmental analysis shows high values of sensi-tivity and specificity ranging from 91 to 100% and from 81 to 100%, respec-tively, including distal pedal arteries. Sixteen-detector-row CT angiography using an adaptive acquisition improves the image quality and provides a reliable non-invasive technique to assess occlusive peripheral arterial disease, including distal foot arteries. Keywords Multidetector-row computed tomography . MDCT . Transcatheter angiography . TCA . Peripheral arterial disease . PAD
Introduction
Trans-catheter angiography (TCA) is considered as the “gold standard” for the assessment of occlusive vascular diseases of the aorta and lower extremity arteries [1]. However, this method is known to be invasive and has a definite morbidity [2, 3]. Helical computed tomography (CT) scan has enormously improved during the last decade, with substantially shorter acquisition time and thinner slice sections enabling scanning of longer segment of the vascular tree with a single contrast-material injection. Currently with 16- and 64-row technology, multidetector CT (MDCT) has achieved the greatest gain in scan speed and has resulted in a real revolution in clinical diagnostic
imaging, especially in CT angiography. However, even with the last advances, there are two main remaining limitations. The first is related to difficulties in obtaining an optimal contrast enhancement of the whole arterial tree due to patient-to-patient variation in the transit time of contrast material from the aorta to the distal arteries and the large panel of scan speeds offered to the user. Subsequently, it remains difficult to predict optimal parameters for image acquisition that include visualisation of the distal run-off arteries with a high quality without venous overlap [4]. The second limitation is the value of CT in assessing the distal foot arteries during the same acquisition. To our knowl-edge, no previous study had evaluated CT performances in the foot arteries.
T. Laswed . E. Rizzo . D. Guntern . F. Doenz . A. Denys . P. Schnyder . S. D. Qanadli (*)
Department of Radiology, CHUV, University Hospital of Lausanne, Bugnon 46,
1012 Lausanne, Switzerland e-mail: [email protected] Tel.: +41-21-3144560 Fax: +41-21-3144443
The purpose of this study was to evaluate the accuracy of MDCT for the assessment of occlusive peripheral arterial diseases (PAD) of lower extremities using an adaptive method of acquisition in order to get an optimal arterial enhancement and to ensure a good visualisation and assessment of distal run-off vessels, including foot arteries.
Materials and methods Patients
Thirty-four consecutive patients, 19 men and 15 women, with a mean age of 64 years (range 37–90 years) with PAD were enrolled in the study. All patients, referred for TCA of the aorta and lower extremity vessels, underwent CT angiography within 15 days. Randomly, 11 patients underwent CT first and the remaining 23 patients TCA first. All patients were symptomatic: six patients in stage II, eight in stage III and 20 in stage IV according to Fontaine’s classification. Patients with impaired renal function (cre-atinine clearance <30 ml/min) were excluded. Informed consent was obtained from all patients. All patients had no change in symptoms between the two examinations.
MDCT parameters and transit-time measurement
MDCT angiography was performed on a 16-row scanner (Light speed Pro16, GE Medical System, Milwaukee, USA) with a collimation of 16×0.625 mm, a field of view of 320 mm and 512×512 matrix. The mean scanning coverage was 1,140 mm.
In order to get the optimal vascular contrast enhance-ment, the adaptive method described by Qanadli et al. [5] was used. A single bolus of 30 ml of contrast material (Iohexol; Accupaque 300, Amersham Health, Wädenswil, Switzerland) was administered at a rate of 4 ml/s. Then, two low-dose (20 mA, 120 KV) dynamic acquisitions were obtained. The first acquisition was at the level of T12 vertebra for the abdominal aorta and the second one was just below the knee joint for the distal popliteal arteries. The first dynamic acquisition was acquired 20 s after the beginning of the intravenous bolus injection and lasted for 10 s. The second dynamic acquisition was started immediately after the first one. For each patient, three time-density curves were generated: one for the aorta and the others for each popliteal artery. Time to the maximum enhancement was calculated as T1 and T2 for the abdominal aorta and the popliteal arteries, respectively. In case of different calculated times for both popliteal arteries, the time for the symptomatic leg, or the longer time in case of bilateral symptoms, was considered as T2. For each patient, we calculated the aorto-popliteal transit time (Tt) as (T2-T1). Accordingly, the acquisition parameters (rotation time and table speed) were chosen in order to obtain an acquisition time (Taq) that is equal or nearest to the Tt. The
acquisition was done using the appropriate selected rotation time and table speed with T1 time delay between injection of contrast material (100 ml at 4 ml/s) and acquisition.
Axial transverse images of 1.25-mm slice thickness were obtained for all patients for the whole arterial tree. To optimise the spatial resolution to the distal arteries, axial transverse images of 0.625-mm slice thickness were reconstructed for the below-knee arteries.
Fig. 1 Bar chart showing the grades of image quality (arterial enhancement) for both 16-MDCT (black columns) and TCA (white columns)
Fig. 2 Bar chart showing the mean attenuation values in HU (Hounsfield units) (black columns) with their standard deviation values (white columns) over four arterial segments: aorta, superficial femoral, anterior tibial and dorsalis pedis artery. Attenuation values are close to each other indicating a homogenous contrast enhancenment at different levels of arterial tree of lower extremities
To reduce the radiation dose delivered during the acquisition, a redefined mA dose auto-modulation (120 kV, minimum mA value 100, maximum mA value 300) in the z-axis was applied in all patients. The estimated CT dose index was 13 mGy.
Data analysis
The arterial tree was divided into 39 segments as follows: infra-renal abdominal aorta, common iliac, external iliac, internal iliac, common femoral, profunda femoris, super-ficial femoral, popliteal, anterior tibial (three segments), tibio-peroneal trunk, posterior tibial (three segments), peroneal (three segments), dorsalis pedis and planter arteries. MDCT angiograms were interpreted
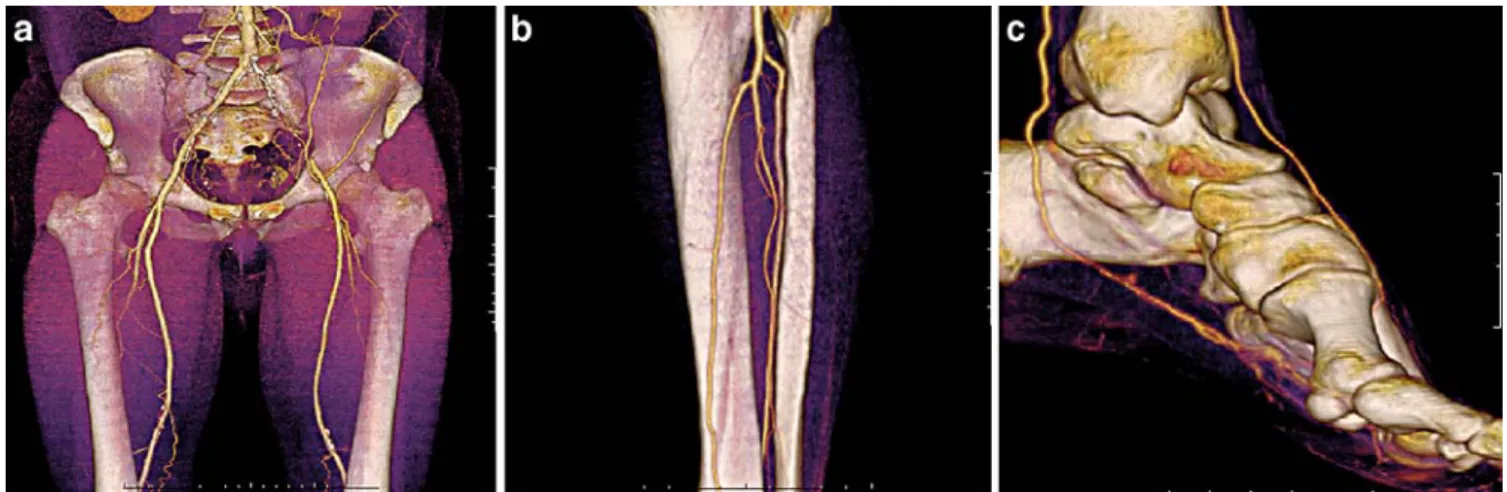
indepen-dently by two investigators unaware of TCA findings. A combined interactive review of CT scan data using axial transverse images, MIP reconstructions, volume rendering techniques and curved planner reformations was applied for each examination on commercially available work-station (Advantage Window, GE Medical Systems). In case of discordance, a consensual lecture was performed. For each examination, including inconclusive scans, three parameters were analysed: (1) quality of the arterial enhancement, (2) presence or not of venous return, and (3) quantitative measurement of the stenosis degree. The quality of arterial enhancement was graded in three categories: grade 0: optimal enhancement; grade 1: optimal enhancement but interpretable; grade 2: non-interpretable examination. Measurements of attenuation values at four arterial segments were obtained (aorta, Fig. 3 a–c A 60-year-old man with intermittent claudication (stage
II) of left lower limb. The transit time was short (17 s). MDCT (16×0.625 mm, 1.25 mm/0.6 mm) angiograms demonstrate high quality images of the whole vascular tree, showing a patent right
femoropopliteal bypass and occlusion of the left common and external iliac arteries (a). In spite of this, high quality images of poplitocrural arteries (b) and distal foot arteries (c) were obtained without a troubling venous return
Fig. 4 a–c An 80-year-old man with grade IV left lower limb ische-mia with aorto-bifemoral bypass and occluded bilateral femoropop-liteal bypass. MDCT angiogram (16×0.625 mm, 1.25 mm/0.6 mm) of abdominal aorta and lower extremity arteries was done with a pitch of 1.750 and rotation time of 0.5 s. The aorto-popliteal transit time (Tt) was calculated as (T2-T1)=10 s. The rapid transit time
calculated could not be predictable considering the bilateral femoropopliteal bypass occlusion and the bilateral anastomotic femoral aneurysms (a). The adaptive method of acquisition provided high quality CT angiograms of run-off arteries (b) and distal foot arteries (c)
superficial femoral, mid anterior tibial and dorsalis pedis arteries). Presence of venous return was graded in a three-level scale: grade 0: no venous enhancement; grade 1: non-disturbing venous enhancement; grade 2: non-disturbing venous return. Arterial stenoses were categorised in four grades: grade 1: normal or non-significant stenosis (0–49% reduc-tion in diameter); grade 2: moderate stenosis (50–74% reduction in diameter ); grade 3: severe stenosis (75–99% reduction in diameter); grade 4: complete occlusion. These categories corresponded to those used in other imaging studies on PAD [6–9]. A stenosis equal or more than 50% was considered as significant (≥grade 2). Presence of aneurysmal dilatations were noted separately.
TCA were independently analysed on the workstation by two vascular radiologists unaware of the CT scan findings. Disagreement was resolved by means of consensus review. The consensual review results were assumed to provide the true disease state. Criteria described above for evaluating the quality and the grading of stenoses were applied.
All the four observers were unaware of patient history, clinical findings and previous radiology reports. Segment levels in which examination was inconclusive at TCA were excluded from the comparative analysis. Image quality and diagnostic performance of MDCT to detect significant
Table 1 Diagnostic value of MDCT for detection of significant stenosis (≥50%) compared with TCA
Site of lesion Sensitivity Specificity
Infra-renal aorta 100 100
Common iliac artery 100 100
Internal iliac artery 91 100
External iliac artery 100 100
Common femoral artery 100 100
Profunda femoris artery 91 97
Superficial femoral 96 89
Popliteal artery 95 91
Anterior tibial artery
Proximal 1/3 100 81
Middle 1/3 100 86
Distal 1/3 100 94
Tibio-peroneal trunk 91 95
Posterior tibial artery
Proximal 1/3 100 91 Middle 1/3 100 100 Distal 1/3 100 82 Peroneal artery Proximal 1/3 96 100 Middle 1/3 96 95 Distal 1/3 96 89
Dorsalis pedis artery 100 87
Planter artery 100 93
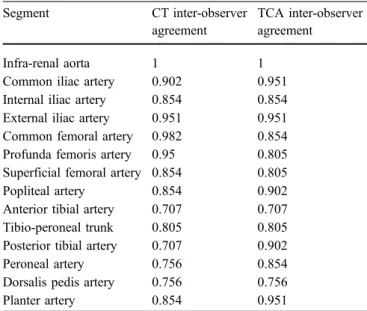
Table 2 MDCT and TCA findings: inter-observer agreement Segment CT inter-observer
agreement
TCA inter-observer agreement
Infra-renal aorta 1 1
Common iliac artery 0.902 0.951 Internal iliac artery 0.854 0.854 External iliac artery 0.951 0.951 Common femoral artery 0.982 0.854 Profunda femoris artery 0.95 0.805 Superficial femoral artery 0.854 0.805
Popliteal artery 0.854 0.902
Anterior tibial artery 0.707 0.707 Tibio-peroneal trunk 0.805 0.805 Posterior tibial artery 0.707 0.902
Peroneal artery 0.756 0.854
Dorsalis pedis artery 0.756 0.756
Planter artery 0.854 0.951
(Data areκ values)
Table 3 Location of false-positive and false-negative results Location False positive False negative
Common iliac artery 0 0
Internal iliac artery 0 1
External iliac artery 0 0
Common femoral artery 0 0
Profunda femoris artery 1 2
Superficial femoral artery 2 1
Popliteal artery 2 1
Anterior tibial artery
Proximal 1/3 4 1
Middle 1/3 3 0
Distal 1/3 1 0
Tibio-peroneal trunk 1 2
Posterior tibial artery
Proximal 1/3 1 0 Middle 1/3 0 0 Distal 1/3 2 0 Peroneal artery Proximal 1/3 0 1 Middle 1/3 1 1 Distal 1/3 2 1
Dorsalis pedis artery 3 0
Planter artery 1 0
arterial stenosis were calculated both on patient basis and on segment basis. Interobserver agreement of measuring the grade of stenosis between both observers of each modality and the intermodality agreement between MDCT and TCA were determined by calculating the kappa (κ) values [10].
Results Image quality
TCA was diagnostic in 854 of a total 860 segments analysed and was inconclusive in six segments (Fig.1), all of them were dorsalis pedis and planter arteries.
The mean Tt was 33±12 s, with a maximum of 74 s and minimum of 14 s. Nine different personalised protocols were applied during the study depending on the Tt. Attenuation value measurements revealed high and
ho-mogenous enhancement with a mean of 285±32 HU for the aorta, 303±26 HU for the superficial femoral artery, 290± 36 HU for the anterior tibial artery and 235±42 HU for the dorsalis pedis artery with coefficient of variation of 2–10% (Fig. 2). Image quality for above knee arteries was excellent with grade 0 arterial contrast enhancement and grade 0 venous return for all segments. Therefore, CT was conclusive in all segments, including distal foot arteries. All below-knee arteries, including the distal pedal arteries, were interpretable according to both CT observers with, however, 35 segments had grade 1 arterial enhancement out of 559 segments (6%). We did not encounter a significant venous return that hampered the interpretation at CT. There were 11 segments with grade 1 venous enhancement at CT. All of them were below the knee and distal foot arteries. We did not have technical failures even with difficult cases presented with aneurysms and occluded bypasses between abdominal aorta and distal foot arteries (Figs.3,4).
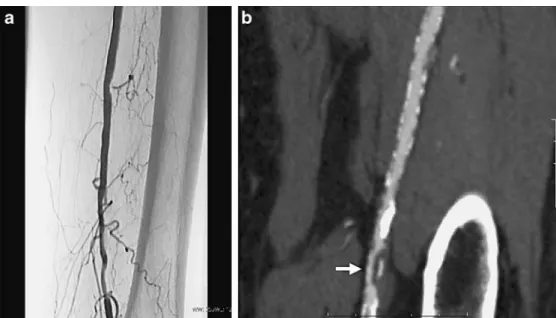
Fig. 5 a, b A 63-year-old woman with intermittent claudi-cation of the left lower limb. a On TCA frontal projection view, the left superficial artery was graded as grade 1 (non-significant ste-nosis). b Left anterior oblique curved planer reconstructions demonstrate a short anteroposte-rior stenosis of left superficial femoral artery (white arrow) that was graded as significant (G3, 75–99%). This was a false-positive case, as TCA was con-sidered the gold standard
Fig. 6 a–c A 61-year-old man hypertensive and hypercholes-terolemic presented with left lower limb intermittent claudi-cation. a Selective TCA of left femoropoliteal axis show a focal significant stenosis of the left popliteal artery (arrow). b Both MDCT observers considered the left popliteal artery to be normal (grade 1). Even on a second review of this false positive case using curved multiplaner tech-nique and the highest spatial resolution (0.625 mm), this focal stenosis was hardly de-picted (c, arrow) and difficult to quantify
Diagnostic performance Analysis on a patient basis
All patients showed at least one significant stenosis on TCA. Consensus lecture was needed by TCA observers in 62 segments (7%). CT detected all patients with significant arterial stenosis. Consensus lecture was needed by CT observers in 67 segments (8%). The overall sensitivity and specificity of MDCT were both 100%. Aneurysmal dilatations were revealed in six segments at TCA: common iliac (n=1), internal iliac (n=1), profunda femoris (n=1), superficial femoral (n=2) and popliteal artery (n=1). All of them were detected on CT.
Analysis on a segment basis Aortoiliac arteries
MDCT and TCA agreed in 155 of 160 arterial segments (97%). No aortic significant stenosis was detected in either
TCA or MDCT. Twenty of 21 significant stenoses of iliac arteries were visualised at CT. MDCT observers under-estimated one internal iliac stenoses. Sensitivity and spec-ificity of CT to detect significant stenoses were 95% and 100%, respectively (Table 1). Excluding the internal iliac arteries, the sensitivity and specificity were both 100%. The interobserver agreement of both observers of CT was very good with κ value of 0.93 (Table 2). The interobserver agreement of both observers of TCA was similar (κ=0.93). Femoro-popliteal arteries
MDCT and TCA agreed in 159 of 168 arterial segments (95%). CT detected 53 of 57 segments with significant stenosis. CT observers overestimated arterial stenosis in five segments and underestimated arterial stenosis in four (Table 3). Further analysis of the overestimated segments showed one patient with a significant stenosis that was overlooked on a single projection TCA (Fig.5). Sensitivity and specificity of CT were both 95%. The inter-observer agreement of both observers of CT was very good with aκ Table 4 Grades of arterial stenosis by both conventional TCA and MDCT
Grade 1 stenosis Grade 2 stenosis Grade 3 stenosis Grade 4 stenosis
TCA MDCT TCA MDCT TCA MDCT TCA MDCT
Infra-renal aorta 41 41 0 0 0 0 0 0
Common iliac artery 37 38 2 2 2 1 0 0
Internal iliac artery 19 28 6 3 1 0 5 6
External iliac artery 36 36 3 2 1 1 1 2
Common femoral artery 37 39 2 1 1 0 1 1
Profunda femoris artery 32 35 6 1 2 4 1 1
Superficial femoral artery 17 17 8 6 4 5 12 14
Popliteal artery 21 21 3 2 5 6 12 12
Anterior tibial artery
Proximal 21 20 2 2 7 10 11 12
Middle 21 18 4 2 2 6 14 15
Distal 16 15 2 3 4 5 19 18
Tibio-peroneal trunk 20 21 2 3 4 8 15 9
Posterior tibial artery
Proximal 11 11 3 4 6 6 21 20 Middle 11 11 1 1 8 8 21 21 Distal 11 9 1 2 6 9 23 20 Peroneal artery Proximal 18 19 1 2 6 10 16 10 Middle 19 19 6 5 5 8 11 9 Distal 18 17 6 5 4 7 13 12
Dorsalis pedis artery 21 17 5 6 4 6 11 12
Planter artery 14 13 2 3 11 9 14 16
value of 0.92, while that of TCA observers was 0.85. In one false negative case, both CT observers could not depict a very short stenosis of the popliteal artery that was seen by both TCA observers (Fig.6).
Below-the-knee arteries
MDCT and TCA agreed in 374 of 420 arterial segments (89%). MDCT detected 238 of 244 (98%) significant stenoses with 15 false positive and six false negative results. Sensitivity and specificity of CT were 91% and 96%, respectively. The intermodality agreement between TCA and CT was excellent for grade 2 stenosis with κ value of 0.93. Meanwhile for grades 3 and 4, MDCT underestimated 18 stenoses that were classified as grade 3 stenosis, while they were graded as grade 4 on TCA (Table 4). This was mainly because of the extensive calcified plaques of distal runoff arteries that renders grading of stenosis very difficult (Fig.7). The interobserver agreement of both observers of MDCT was good withκ of 0.73, while it was very good at TCA withκ of 0.81.
Distal pedal arteries
The intermodality agreement between MDCT and TCA was very good withκ value of 0.90. Of a total 86 segments, TCA demonstrated 47 significant stenosis. Twenty lesions were in the dorsalis pedis artery and 27 in the planter artery. All these stenoses and occlusions were visualised on the CT. However, CT overestimated four stenoses. Two of them were because observers depended mainly on the three-dimensional(3D) volume rendering images on their analysis (Fig.8). We obtained a very good performances to detect significant stenoses with a sensitivity of 100% and a specificity of 90%. The inter-observer agreement of TCA was very good withκ value of 0.85, whereas that of 16-CT was good (κ=0.80).
Discussion
TCA is considered as the gold standard for the diagnosis in patients with PAD. However, since it is an invasive technique, TCA is generally now performed only as a
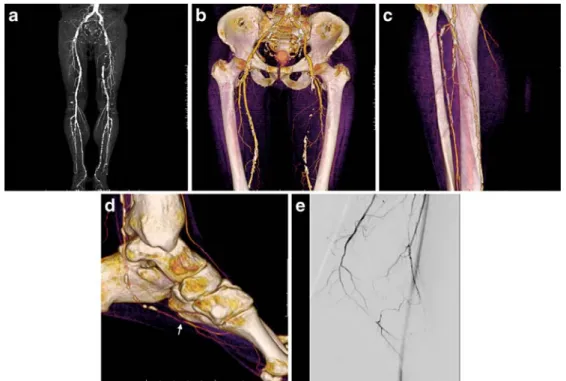
pre-Fig. 7 a–e A 63-year-old man smoker, hypertensive and hyper-cholesterolemic presented with a progressing left-side calf claudi-cation (walking distance less than 100 m). MDCT (16×0.625 mm, 1.25 mm/0.6 mm). a MIP of the whole vascular tree show multiple calcification plaques of the arterial tree that could make the quantification of arterial stenoses very difficult. b 3D VRT images showing complete occlusion of left superficial artery. c 3D VRT
posterior view of poplitocrural arteries showing multiple focal stenosis of left posterior tibial artery. d 3D VRT lateral view of the left foot showing a severe stenosis of planter artery (arrow). e TCA lateral projection view revealed a complete occlusion of left planter artery and shows better the kinetics of blood flow as the distal part of the planter artery is supplied by the dorsalis pedis artery
treatment procedure and is known to have some limitations and risks [2,3]. CT angiography is relatively non-invasive new technique introduced in the last 10 years for assessment of PAD [11, 12]. Therefore, there is little original data available on CT of PAD of lower extremities [9, 11, 13–15]. In fact, CT angiography of the whole peripheral vascular tree was made possible only recently by the latest generations of CT scanners [11,16]. The potential role of CT in the management of the PAD is not only to establish diagnosis but also to provide all informations for therapeutic decision making. To analyse accurately the whole vascular tree, two conditions, however, are manda-tory for CT angiography: optimal arterial enhancement without interfering venous return that allow high-quality 2D and 3D reconstructions and high spatial resolution. The choice of acquisition parameters of CT varies widely according to the type and the model of the scanner (four-, eight-, 16- and 64-detector CT scan). However, even with the recent technical improvement in the CT platforms, the
optimal timing of arterial enhancement of lower extremities remains difficult because it also depends on the hemody-namic and the vascular state of each patient. It is well known that coexisting cardiovascular disorders and the presence of blood flow obstructions and aneurysms anywhere between the infrarenal aorta and the pedal arteries may substantially delay the opacification of the arterial tree [4]. With fast CT scanners, it might thus be possible for scanning to outpace the contrast medium bolus despite correct timing of the scanning delay at the level of the abdominal aorta, with subsequent inadequate opacifi-cation of distal arteries [4].
The adaptive method described by Qanadli et al. [5] has the advantage of determining acquisition parameters based on every patient’s hemodynamic and vascular status with a single bolus test. Other injection strategies with use of bolus tracking or bolus test principles and other preceding protocols with fixed scanning delay were available and have been used as mentioned in recent studies [5,9,11,15, Fig. 8 a–d A 68-year-old man,
smoker, hypertensive and hypercholesterolemic presented with lifestyle disturbing inter-mittent claudication (100 m walking distance). Both MDCT observers overestimated the left planter artery as they paid more attention to 3D volume render-ing images in their interpreta-tion. The planter artery was graded as having significant stenosis (G3, 75–99%) on 3D VRT images (a) while it was graded as grade 1 on TCA (b). However, on retreating these 3D VRT images with a different threshold level (c) and also with the curved multiplanar reconstructions on the long axis of the planter artery (d), the planter artery was clearly intact
19]. However, all these methods use empirical (non-personalised) selection of acquisition parameters and, to our knowledge, none of these studies has clearly evaluated the image quality in the foot arteries. With the use of the adaptive method, we obtained reproducible high quality CT angiograms even in complex cases with aneurysms and obstructed bypasses between abdominal aorta and distal pedal arteries. We did not encounter problems of venous filling as noted by other authors [6,7] using an empirical approach. The image quality obtained was clearly reflected in the overall sensitivity and specificity in the detection of significant stenosis on patient based analysis (100%) as well as on segment basis analysis. Sensitivity and speci-ficity were 91% and 96%, respectively, for detecting significant stenosis in the below-the-knee arteries. Our study, if not the first, is one of the first studies that emphasised on the analysis of distal feet arteries. Indeed, we obtained very good results of CT in detecting signif-icant stenosis of dorsalis pedis and planter arteries with a sensitivity and a specificity of 100% and 90%, respectively. Furthermore, the high quality obtained provide high levels of interobserver agreement between observers.
Critical analysis of the disagreements of distal arteries showed that TCA and CT were well correlated for distinguishing a significant stenosis from a non-significant one. CT overestimated 24 segments of arterial stenosis. Further subanalysis of these overestimations revealed in one patient that significant stenosis was missed on a single projection TCA (Fig. 5), though it was considered as the gold standard. In one false negative case, both CT observers were unable to see a focal stenosis of the popliteal artery probably because of the limited spatial resolution of CT (Fig.6). Among the cases of true positive stenosis, further subanalysis of stenosis quantification demonstrated that MDCT observers underestimated 18 stenoses that were classified as grade 3, while they were graded on TCA as complete occlusions. This may be explained also by the limited spatial resolution especially in cases of presence of
extensive arterial wall calcifications that make the luminal quantification extremely difficult on CT even with window adjustment and the combined multireconstruction approach as previously reported [20, 21]. We did not evaluate the difference in the diagnostic value of the way of reading CT angiography in the present study. Radiologists concen-trate mainly on the axial images in some patients and give more attention to 3D images in others. In fact, depending only on 3D volume rendering techniques could be detrimental as the image informations depend on the selected threshold for structure reconstruction and visual-isation, which can easily lead to overestimation or under-estimation of arterial stenosis.
An alternative non-invasive imaging techniques for assessing PAD is the contrast enhanced MR angiography [22]. Nevertheless, MR has some disadvantages that make CT a compelling alternative, because of the limited spatial resolution of MR angiography, particularly in assessing small vessels. In addition, covering a large volume over the whole vascular tree with sufficient intra-arterial contrast enhancement and minimal venous return remains a chal-lenge for MR. The major advantage of MR over CT is that no ionising radiation nor iodinated contrast medium are needed. However, efforts have been made recently to reduce the radiation dose delivered during CT that include the mA dose automodulation during acquisition, as used in the present study, low dose protocol (50 mAs), as proposed by Fraioli et al. [17], and low kV settings (100 kVp), as suggested by Wintersperger et al. [18]. Care should be taken to use the available protocols for dose reduction in routine practice.
In conclusion, MDCT angiography using the adaptive method of acquisition for optimising the arterial enhance-ment improves the image quality and provides a reliable non-invasive technique to assess occlusive PAD including distal feet arteries. Routine use of the reported technique is recommended, especially with potentially faster CT plat-forms (64-MDCT).
References
1. Malden ES, Picus D, Vesely TM, Darcy MD, Hicks ME (1994) Peripheral vas-cular disease: evaluation with stepping dsa and conventional screen-film angi-ography. Radiology 191:149–153 2. Rubin GD, Zarins CK (1995) MR and
spiral/helical CT imaging of lower extremity occlusive disease. Surg Clin North Am 75:607–619
3. Reimer P, Landwehr P (1998) Non-invasive vascular imaging of peripheral vessels. Eur Radiol 8:858–872 4. Fleischmann D, Rubin GD (2005)
Quantification of intravenously admi-nistered contrast medium transit through the peripheral arteries: impli-cations for CT angiography. Radiology 236:1076–1082
5. Qanadli SD, Chiappori V, Kelekis A (2004) Multislice computed tomogra-phy of peripheral arterial disease: new approach to optimize vascular opacifi-cation with 16-row platform. Eur Radiol 14(Suppl 2):b806
6. Rieker O, Duber C, Neufang A, Pitton M, Schweden F, Thelen M (1997) CT angiography versus intraarterial digital subtraction angiography for assessment of aortoiliac occlusive disease. AJR Am J Roentgenol 169:1133–1138 7. Lawrence JA, Kim D, Kent KC,
Stehling MK, Rosen MP, Raptopoulos V (1995) Lower extremity spiral CT angiography versus catheter angiogra-phy. Radiology 194:903–908
8. Ho KY, Leiner T, de Haan MW, Kessels AG, Kitslaar PJ, Van Engelshoven JM (1998) Peripheral vascular tree stenoses: Eevaluation with moving-bed infusion-tracking MR angiography. Radiology 206:683–692
9. Ofer A, Nitecki SS, Linn S, Epelman M, Fischer D, Karram T, Litmanovich D, Schwartz H, Hoffman A, Engel A (2003) Multidetector CT angiography of peripheral vascular disease: A pros-pective comparison with intraarterial digital subtraction angiography. AJR Am J Roentgenol 180:719–724 10. Landis JR, Koch GG (1977) An
application of hierarchical kappa-type statistics in the assessment of majority agreement among multiple observers. Biometrics 33:363–374
11. Rubin GD, Schmidt AJ, Logan LJ, Sofilos MC (2001) Multi-detector row CT angiography of lower extremity arterial inflow and runoff: initial expe-rience. Radiology 221:146–158 12. Fleischmann D, Hallett RL, Rubin GD
(2006) CT angiography of peripheral arterial disease. J Vasc Interv Radiol 17:3–26
13. Martin ML, Tay KH, Flak B, Fry PD, Doyle DL, Taylor DC, Hsiang YN, Machan LS (2003) Multidetector CT angiography of the aortoiliac system and lower extremities: a prospective comparison with digital subtraction angiography. AJR Am J Roentgenol 180:1085–1091
14. Ota H, Takase K, Igarashi K, Chiba Y, Haga K, Saito H, Takahashi S (2004) MDCT compared with digital subtraction angiography for assessment of lower extremity arterial occlusive disease: portance of reviewing cross-sectional im-ages. AJR Am J Roentgenol 182:201–209 15. Catalano C, Fraioli F, Laghi A, Napoli
A, Bezzi M, Pediconi F, Danti M, Nofroni I, Passariello R (2004) infra-renal aortic and lower-extremity arterial disease: diagnostic performance of multi-detector row CT angiography. Radiology 231:555–563
16. Rubin GD, Shiau MC, Schmidt AJ, Fleischmann D, Logan L, Leung AN, Jeffrey RB, Napel S (1999) Computed tomographic angiography: historical perspective and new state-of-the-art using multi detector-row helical com-puted tomography. J Comput Assist Tomogr 23(Suppl 1):s83–s90 17. Fraioli F, Catalano C, Napoli A,
Francone M, Venditti F, Danti M, Pediconi F, Passariello R (2006) Low-dose multidetector-row CT angiogra-phy of the infra-renal aorta and lower extremity vessels: image quality and diagnostic accuracy in comparison with standard DSA. Eur Radiol 16:137–146
18. Wintersperger B, Jakobs T, Herzog P, Schaller S, Nikolaou K, Suess C, Weber C, Reiser M, Becker C (2005) Aorto-iliac multidetector-row CT angiography with low kV settings: improved vessel enhancement and si-multaneous reduction of radiation dose. Eur radiol 15:334–341
19. Willmann JK, Baumert B, Schertler T, Wildermuth S, Pfammatter T, Verdun FR, Seifert B, Marincek B, Bohm T (2005) Aortoiliac and lower extremity arteries assessed with 16-detector row CT angiography: prospective compari-son with digital subtraction angiogra-phy. Radiology 236:1083–1093 20. Ouwendijk R, Kock Mc, Van Dijk LC,
Van Sambeek MR, Stijnen T, Hunink MG (2006) vessel wall calcifications at multi-detector row CT angiography in patients with peripheral arterial disease: effect on clinical utility and clinical predictors. Radiology 241:603–608 21. Raptopoulos V, Rosen MP, Kent KC,
Kuestner LM, Sheiman RG, Pearlman JD (1996) Sequential helical CT angi-ography of aortoiliac disease. AJR Am J Roentgenol 166:1347–1354
22. Rofsky NM, Adelman MA (2000) MR angiography in the evaluation of atherosclerotic peripheral vascular disease. Radiology 214:325–338