Received December 20, 2005 Address for correspondence: FRANZ BARJAK
University of Applied Sciences Northwestern Switzerland Riggenbachstrasse 16, CH-4600 Olten, Switzerland E-mail: [email protected]
Research productivity in the internet era
FRANZ BARJAK
University of Applied Sciences Northwestern Switzerland, Olten (Switzerland)
The present study investigated the relationship between the use of different internet applications and research productivity, controlling for other influences on the latter. The control variables included dummies for country, discipline, gender and type of organization of the respondent; as well as variables for age, recognition, the degree of society-related and career-related motivation for research, and the size of the collaboration network. Simple variance analyses and more complex negative binomial hurdle models point to a positive relationship between internet use (for personal communication, information retrieval and information dissemination) and research productivity. However, the results should be interpreted with caution as it was not possible to test the role of the internet against other pre-internet tools which fulfil the same functions. Thus instance it may not be the use of e-mail per se, but the degree of communicating with colleagues that makes a productive scientist.
Introduction
The interest of social scientists in the factors that drive the research productivity of scientists is nothing new: The much cited book by Pelz and Andrews “Scientists in Organizations. Productive Climates for Research and Development” was first published in 1966 and builds on a considerable volume of previous work. Since then, a wealth of
factors has been identified which contribute to increased research productivity (see for instance the surveys in BLAND & RUFFIN, 1992; FOX, 1983; RAMSDEN, 1994).
As many analyses with a broader set of indicators were carried out in the 80s and 90s, they did not consider the most recent developments in information and communication technologies. In particular, over the last decade the internet has become an important tool for scientific research and it has been adopted in specific manners by different scientific fields and academic communities (FRY, 2004; KLING & MCKIM, 2000). Several analyses of the use of internet tools in science and their supposed impact on research productivity have been carried out (COHEN, 1996; HESSE et al., 1993; KAMINER & BRAUNSTEIN, 1998; WALSH et al., 2000). These studies represent valuable first steps for assessing the productivity effects of internet tools in science, but they are subject to one or more weaknesses: a limited number of available control variables, few academic disciplines or overall a small dataset. In addition, most existing studies were based on surveys among US-American scientists carried out in the first half of the 1990s, when internet use was less common even in science. Therefore, more recent evidence from countries other than the US is required.
The present contribution sets out to explain research output as a function of several inputs. It uses data on individual scientists gathered through a large survey. The dataset allows demographic and other personal characteristics as well as some properties of the organization to be taken into account. Though scientists work in universities or non-university research institutes and often do research collectively in teams or laboratories, the most relevant aspects of assessing research productivity are related to the individual. Individual scientists obtain social recognition (HAGSTROM, 1965) or credibility (LATOUR & WOOLGAR, 1979) for their scientific achievements. The latter are published and cited with the individual authors’ names; organizations are only of secondary importance in this regard.
The present paper is divided into six main chapters. The introduction is followed by a brief review of the literature on research productivity.* The data, variables and
methods are then briefly described. The fourth chapter presents the results; firstly for the bivariate tables and variance analyses and secondly for the multivariate count data models. The results are followed by a discussion and a brief conclusion.
*The chapter is a short version of a much longer review that fell victim to the length restrictions of the conference proceedings. It may be obtained from the author upon request.
Explaining the productivity of scientific research
Indicators for measuring research productivity
Scientific R&D produces a range of different outputs: skilled graduates, new instruments, new methods, prototypes and publications. However, it is not possible to measure all outputs with equal ease. For instance, skilled graduates are a co-product of scientific research and higher education and it is difficult to separate the contributions of each function. In most cases assessment of scientific productivity has been based on publication and citation data, though some used other approaches: different forms of output (publications, patents, prototypes, reports and algorithms) and performance measures (ANDREWS, 1979), results of a research assessment (RAMSDEN, 1999), and revolutionary contributions of scientific geniuses (HOLLINGSWORTH & HOLLINGSWORTH, 2000; WRAY, 2003).
What do we know about research productivity at the individual level?
Studies tend to separate the factors that influence the research productivity of scientists into environmental and individual factors (BLAND & RUFFIN, 1992; FOX, 1983; RAMSDEN, 1994). However, they are interlinked and not independent of each other. “Success breeds success”, the recognition for a scientific achievement both reinforces the personal motivation and also creates a supportive environment and access to additional resources (“Matthew effect”) which can lead to further achievements (FOX, 1983).
Among the individual characteristics of scientists which determine their research productivity, the following have been found as influential factors:
• research motivation, stamina and creativity (BLACKBURN et al., 1978; BLACKBURN et al., 1991; BLAND & RUFFIN, 1992; FOX, 1983; RAMSDEN, 1994; RAMESH BABU & SINGH, 1998),
• age (CARAYOL & MATT, 2004; FOX, 1983; KNORR et al., 1979; LEVIN & STEPHAN, 1991; WRAY, 2003),
• gender (BLACKBURN et al., 1991; BORDONS et al., 2003; COLE & ZUCKERMAN, 1984; HEMLIN & GUSTAFSSON, 1996; PRPIC, 2002; RAMSDEN, 1994; SHAUMAN & XIE, 2003),
• rank and professional recognition (BLACKBURN et al., 1978; BLACKBURN et al., 1991; KNORR et al., 1979; PRPIC, 2002; RAMSDEN, 1994),
• the burden of other obligations, in particular teaching and administration (BAIRD, 1986; BLACKBURN et al., 1991; FOX, 1992; KNORR et al., 1979; PRPIC, 1996; RAMSDEN, 1994),
• communication with colleagues (RAMESH BABU & SINGH, 1998; VISART, 1979).
• and participation in research collaborations (BLACKBURN et al., 1978; BLAND & RUFFIN, 1992; BORDONS et al., 1996; BRAUN et al., 2001; GLÄNZEL, 2002; PRPIC, 1996).
Several environmental characteristics have been investigated and found to influence the individual research productivity:
• training environment (FOX, 1983; LONG, 1978),
• size of the research group (BORDONS & ZULUETA, 1997; CARAYOL & MATT, 2004; COHEN, 1981; HOLLINGSWORTH & HOLLINGSWORTH, 2000; JOHNSTON, 1994; KNORR et al., 1979; STANKIEWICZ, 1979; VON
TUNZELMANN et al., 2003),
• prestige and research focus of the institution (BLACKBURN et al., 1978; BLAND & RUFFIN, 1992; FOX, 1983; HOLLINGSWORTH & HOLLINGSWORTH, 2000; LONG, 1978; RAMSDEN, 1994),
• organizational freedom, meaning the liberty to select the content and the administrative parameters of the research (FOX, 1983; BLAND & RUFFIN, 1992; RAMESH BABU & SINGH, 1998; HOLLINGSWORTH & HOLLINGSWORTH, 2000),
• scientific discipline (PRPIC, 1996; BAIRD, 1986),
• country (EUROPEAN COMMISSION [EC], 2003; VAN LEEUWEN et al., 2001). The extent to which the internet has the power to change science is still being debated. Some see the appearance of new social structures based on on-line databases (HILGARTNER, 1995) or network applications that support large-scale collaborations (FINHOLT & OLSON, 1997; FINHOLT, 2001); others expect a spatial and disciplinary re-organisation of science networks (CARLEY & WENDT, 1991; CLARK, 1995; NOAM, 1995; VAN ALSTYNE & BRYNJOLFSSON, 1996); and again others deny these far reaching influences: GLÄSER (2003) argues that the internet leaves the social structure of scientific communities unchanged but reforms their work practices. In particular, he points to the possibility of a new and earlier communalization of knowledge production related to the publication (and maybe also production) of raw data. Several authors also discussed the possible relationship between internet use and research productivity, and we can distinguish between two strands of argumentation:
(1) The use of computer networks may change the scientists’ productivity and the quality of output produced (scientific articles, other publications). Several arguments support a productivity rise: In general, more information is available over computer networks and the search and retrieval of information is faster (NENTWICH, 2003). Access to remote instruments and data sets is also easier and faster (WALSH et al., 2000). Research may become better connected and more modular (KIRCZ, 1998;
NENTWICH, 2003). E-mail threads and groupware may help groups to memorize discussions and decisions and increase the efficiency of group interactions (STEINMUELLER, 2000).
However, some properties of computer networks and their use can also reduce scientific productivity: Firstly there are the learning costs for becoming proficient with computer networks (NENTWICH, 2003). Information overload and too many and excessively broad hits on web-based information searches increase search costs and reduce the net benefits of the technology. In addition, SPAM – unsolicited e-mail not related to work issues – clutters mailboxes and wastes time, whilst viruses distributed over the internet can destroy data. The possibilities of accessing information on com-puter networks might have a distracting effect and could increase “the amount of time spent fooling around” (BISHOP, 1994 cited in WALSH & ROSELLE, 1999, p. 66). More extensive information searches may lead to the inclusion of more information overall, with decreasing marginal gains.
(2) The second effect would run counter to this from productivity to network use. More productive academics are more visible to their peers. Therefore, we should expect that they also receive more comments, requests for publications or further explanation via computer-mediated communication media.
What has been learned in empirical analyses? An early survey among (predominantly US-American) oceanographers showed a positive relationship between productivity and the use of SCIENCEnet, a computer network for oceanographers (HESSE et al., 1993). Various authors have found positive correlations between publication rates and the use of computer-mediated communication (CMC) tools: COHEN (1996) analyzed this in 1994 for a sample of more than 600 chemists, political scientists, philosophers and sociologists at US universities. WALSH et al. (2000) obtained significant correlation coefficients for e-mail use and papers published in refereed journals for a sample of 333 US scientists from four disciplines (biology, mathematics, physics, and sociology). However, the use of other, non-communication applications is also related to publication rates: KAMINER & BRAUNSTEIN (1998) found a correlation between the use of remote login software, ftp and Kermit (file transfer, management and communication software) and the number of average annual publications. This analysis was conducted with log file data for a small sample of 63 faculty members of four departments at University of California, Berkeley.
The existing studies have contributed to our understanding of the relationship between productivity and internet use in science. Nevertheless, they suffer from some weak points, such as the small number of control variables, the limited number of academic disciplines and the small datasets. Moreover, the results of these studies are based on surveys among US-American scientists carried out mostly in the first half of the 1990s, when the internet was still in its infancy (except for WALSH et al., 2000 who use data from a 1998 survey). More recent and cross-country evidence is required.
This paper attempts to fill in some of these gaps. The main research question is whether the relationship between productivity and internet use found in other studies can be corroborated, even when a large number of individual and environmental control variables is included.
Data and methods
The survey collected data on more than 1,400 scientists from five academic disciplines (astronomy, chemistry, computer science, economics, and psychology) and seven European countries (Denmark, Germany, Ireland, Italy, the Netherlands, Switzerland and the UK).* The data was gathered through a mailed questionnaire in the period between April and July 2003 (response rate: 25%). The survey included questions on socio-demographic characteristics of the respondents, their publication rates and collaboration activities, as well as a large set of questions on the use of different internet applications for R&D. For the purpose of this paper, the latter are particularly relevant:
• Social communication through CMC: Based on the responses to a question which assessed the use of computer-based (e-mail, chat, video conference) and various ‘off-line’ communication media for R&D during an average working week, a hierarchical cluster analysis established three clusters of scientists. They differ in regard to their overall communication activity and e-mail use: (a) ‘Silent researchers’ communicate a lot less than average, regardless of the communication media chosen; (b) ‘E-mail communicators’ predominantly use e-mail for their R&D communication; (c) ‘Communicators’ have above-average use of all communication media. • Internet-based search and retrieval of information for R&D: The extent to
which the internet is used for retrieving scientific information was assessed through the simple usage rates of different on-line information sources such as the internet sites of libraries and archives, e-journals and full text databases, peers’ websites, and websites of other institutions.
• Dissemination of R&D results through the WWW: By setting up a homepage, scientists decide what information on themselves they make publicly available. An indicator was constructed on the basis of two questions: whether scientists have a personal homepage and whether full
*We gratefully acknowledge funding for this survey from the European Commission as part of the Statistical Indicators for Benchmarking the Information Society (SIBIS) project (IST-2000-26276).
text papers or hyperlinks to them are included. It differentiates between scientists that don’t have a homepage, those having a homepage but no full text papers included on these, and those having a homepage with full text papers or hyperlinks pointing to them.
The dependent variable, the research productivity of scientists, was measured on the basis of the self-reported number of publications during the years 2001 and 2002 (working papers, journal articles, book chapters, monographs, conference presentations, reports, others). The major problem of a survey-based approach is the reliability of the self-assessed publication data. However, studies that used and compared it with other ways of assessing research productivity generally concluded that the self-reported data are valid (ANDREWS, 1979; CLARK & CENTRA, 1985, cited in BAIRD, 1986). A clear advantage is that it also includes less well-documented and counted types of publication than journal publications. The analysis considers type of output separately, as a standard approach for combining different publication types into one index does not exist (RAMSDEN, 1994). Moreover, it has been shown that the factors explaining the different forms of published output are similar, but not always identical (see e.g. BLACKBURN et al., 1991 for different forms of publication versus conference presentations). The short time period of two years is taken – rather than total publications over the entire career – because we investigate the role of a new set of tools. Also, due to the short time period some structural variables such as the degree of professional recognition and the size of the collaboration network can be considered as exogenous. Nevertheless, a causality problem remains to be discussed later in the paper.
The analysis also includes several control variables for the country of the organization, research discipline, type of organization, gender and age, recognition, motivation for performing research, and collaboration activity.
For the multivariate estimations we used count data models which take the large numbers of zeros and small values of the dependent variable into account (see GREENE, 2000; CAMERON & TRIVEDI, 1998). We started out with Poisson models and finally opted for the negative binomial (NEGBIN) hurdle model as it produced the best results.
Results
Bivariate correlations between internet use and research productivity
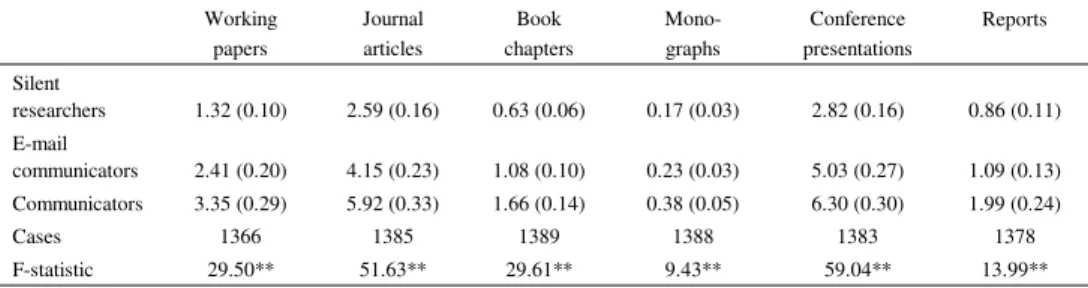
Bivariate correlations between the measures chosen to represent the use of internet applications and research productivity give a clear picture: Scientists who communicate more in general and via e-mail produce more publications, regardless of the form of publication (see Table 1).
Table 1. Publications by communication cluster and type of publication 2001–2002 Working papers Journal articles Book chapters Mono-graphs Conference presentations Reports Silent researchers 1.32 (0.10) 2.59 (0.16) 0.63 (0.06) 0.17 (0.03) 2.82 (0.16) 0.86 (0.11) E-mail communicators 2.41 (0.20) 4.15 (0.23) 1.08 (0.10) 0.23 (0.03) 5.03 (0.27) 1.09 (0.13) Communicators 3.35 (0.29) 5.92 (0.33) 1.66 (0.14) 0.38 (0.05) 6.30 (0.30) 1.99 (0.24) Cases 1366 1385 1389 1388 1383 1378 F-statistic 29.50** 51.63** 29.61** 9.43** 59.04** 13.99** Arithmetic mean (standard error in brackets)
F-statistic: ANOVA procedure, significance levels ** < 0.01, * < 0.05. Source: SIBIS R&D survey.
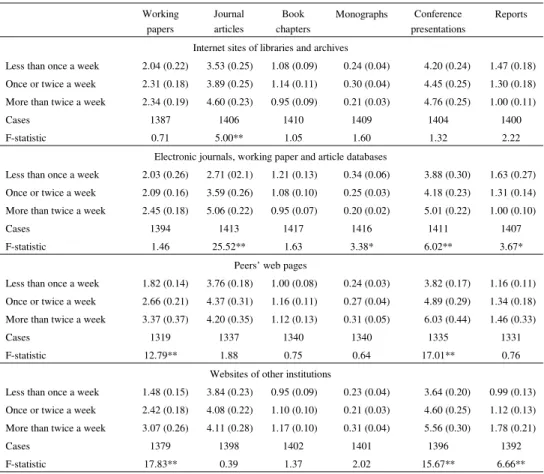
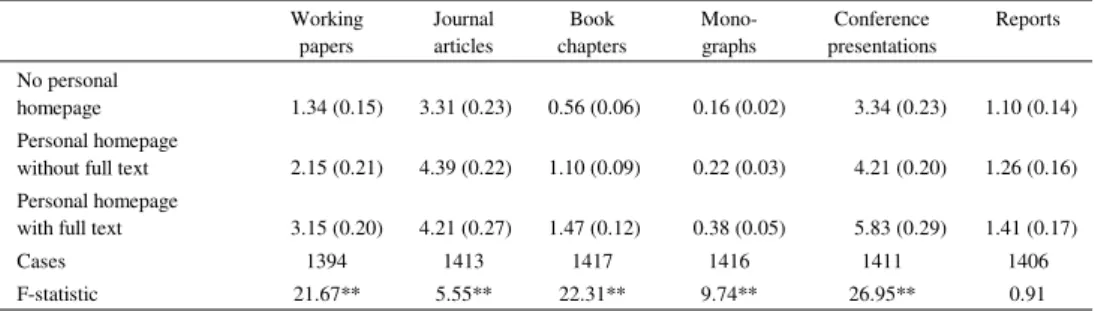
Also, respondents with personal homepages without full text publish more than those who do not have personal homepages, but less than those who feature full text on their homepages (see Table 3). The picture is slightly more varied for the use of internet-based information sources (see Table 2) but the tendency is similar: the use of peers’ web pages and the websites of other institutions correlates with the number of working papers; the number of journal articles correlates with the use of library sites and electronic journals; the number of conference presentations correlates with all information sources except for library sites. The writing of book chapters is not correlated with the use of on-line information sources. Interestingly, the writing of monographs and reports correlates negatively with the use of e-journals and full text databases.
Multivariate analysis
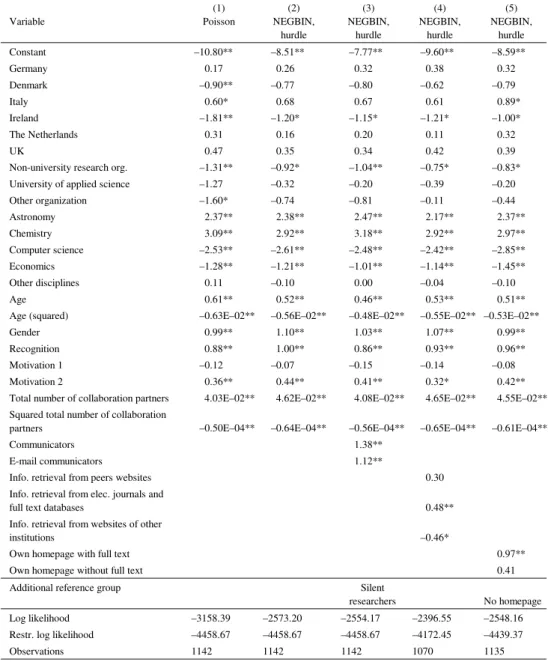
The baseline models were first calculated without any indicators for internet use. In general they performed well: in the Poisson model for journal articles, the log likelihood was increased by 30% (see Table 4). However, as nearly one in four respondents had not published any journal articles over the previous two years, the Poisson model suffered from an excess of zeros. The negative binomial hurdle model solves this problem. The calculated baseline model produced similar marginal effects as with the Poisson model, except for the country dummies which are mostly insignificant. The most marked effect on journal articles is exerted by the academic discipline: on average astronomers wrote 2.4 and chemists 3.0 journal articles more than psychologists (the reference group), whereas computer scientists and economists published less. Age is also associated with a marked positive effect: on average scientists produced 0.5 papers more for each additional year of age. However, the age effect is curvilinear and the squared age variable has a negative effect on journal publications. Moreover, men produced on
average one publication more than women. The levels of recognition and career-oriented motivation are conducive to producing publications. Last but not least, the larger the collaboration networks of the respondents, the more journal articles they wrote. However, the effect is fairly small and it is also curvilinear: the significant squared variable indicates that scientists with very large collaboration networks produced fewer journal articles.
Models 3 to 5 in Table 4 also include the variables for internet use. In Model 3 the clusters on the use of communication media for R&D are included and compared to the group of “silent researchers”.
Table 2. Publications by use of information sources and type of publication 2001–2002 Working papers Journal articles Book chapters Monographs Conference presentations Reports
Internet sites of libraries and archives
Less than once a week 2.04 (0.22) 3.53 (0.25) 1.08 (0.09) 0.24 (0.04) 4.20 (0.24) 1.47 (0.18) Once or twice a week 2.31 (0.18) 3.89 (0.25) 1.14 (0.11) 0.30 (0.04) 4.45 (0.25) 1.30 (0.18) More than twice a week 2.34 (0.19) 4.60 (0.23) 0.95 (0.09) 0.21 (0.03) 4.76 (0.25) 1.00 (0.11)
Cases 1387 1406 1410 1409 1404 1400
F-statistic 0.71 5.00** 1.05 1.60 1.32 2.22
Electronic journals, working paper and article databases
Less than once a week 2.03 (0.26) 2.71 (02.1) 1.21 (0.13) 0.34 (0.06) 3.88 (0.30) 1.63 (0.27) Once or twice a week 2.09 (0.16) 3.59 (0.26) 1.08 (0.10) 0.25 (0.03) 4.18 (0.23) 1.31 (0.14) More than twice a week 2.45 (0.18) 5.06 (0.22) 0.95 (0.07) 0.20 (0.02) 5.01 (0.22) 1.00 (0.10)
Cases 1394 1413 1417 1416 1411 1407
F-statistic 1.46 25.52** 1.63 3.38* 6.02** 3.67*
Peers’ web pages
Less than once a week 1.82 (0.14) 3.76 (0.18) 1.00 (0.08) 0.24 (0.03) 3.82 (0.17) 1.16 (0.11) Once or twice a week 2.66 (0.21) 4.37 (0.31) 1.16 (0.11) 0.27 (0.04) 4.89 (0.29) 1.34 (0.18) More than twice a week 3.37 (0.37) 4.20 (0.35) 1.12 (0.13) 0.31 (0.05) 6.03 (0.44) 1.46 (0.33)
Cases 1319 1337 1340 1340 1335 1331
F-statistic 12.79** 1.88 0.75 0.64 17.01** 0.76
Websites of other institutions
Less than once a week 1.48 (0.15) 3.84 (0.23) 0.95 (0.09) 0.23 (0.04) 3.64 (0.20) 0.99 (0.13) Once or twice a week 2.42 (0.18) 4.08 (0.22) 1.10 (0.10) 0.21 (0.03) 4.60 (0.25) 1.12 (0.13) More than twice a week 3.07 (0.26) 4.11 (0.28) 1.17 (0.10) 0.31 (0.04) 5.56 (0.30) 1.78 (0.21)
Cases 1379 1398 1402 1401 1396 1392
F-statistic 17.83** 0.39 1.37 2.02 15.67** 6.66**
Arithmetic mean (standard error in brackets)
F-statistic: ANOVA procedure, significance levels ** < 0.01, * < 0.05. Source: SIBIS R&D survey.
Table 3. Publications by personal homepage and type of publication 2001–2002 Working papers Journal articles Book chapters Mono-graphs Conference presentations Reports No personal homepage 1.34 (0.15) 3.31 (0.23) 0.56 (0.06) 0.16 (0.02) 3.34 (0.23) 1.10 (0.14) Personal homepage
without full text 2.15 (0.21) 4.39 (0.22) 1.10 (0.09) 0.22 (0.03) 4.21 (0.20) 1.26 (0.16) Personal homepage
with full text 3.15 (0.20) 4.21 (0.27) 1.47 (0.12) 0.38 (0.05) 5.83 (0.29) 1.41 (0.17)
Cases 1394 1413 1417 1416 1411 1406
F-statistic 21.67** 5.55** 22.31** 9.74** 26.95** 0.91 Arithmetic mean (standard error in brackets)
F-statistic: ANOVA procedure, significance levels ** < 0.01, * < 0.05. Source: SIBIS R&D survey.
Clearly, both overall communication and e-mail communication are associated with higher research productivity (the difference between the latter groups is not significant). Model 4 includes variables on the use of internet-based information sources for retrieving research-relevant information. The use of electronic journals and full text databases produces a significant positive effect, whereas the use of other organizations’ websites has a significant negative effect on article output. It should be noted that this effect was recorded even though the estimation controlled for research discipline and research motivation. In model 5, internet use is introduced through the dummy variable for homepages. Remarkably, scientists with a homepage with full text produced more journal articles than those without an individual homepage.
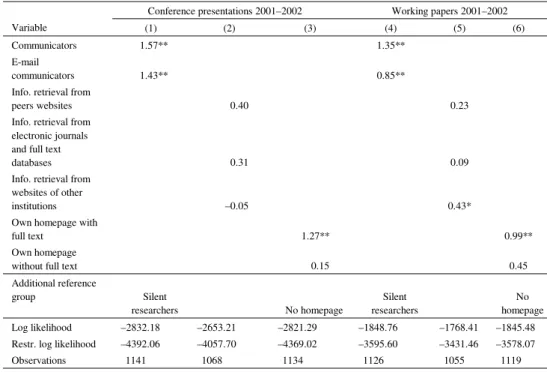
Table 5, models (1)-(3), displays the estimation results for the number of conference presentations and the internet variables (the results for the control variables are only described verbally and they can be obtained from the author upon request, see footnote 1). The negative binomial hurdle models again produced the best results. The differences between scientific disciplines are a lot less pronounced than for journal articles (not shown in the table). Age, gender, recognition, and collaboration effects are of a similar magnitude as for journal publications. The effect of career motivation is 1.5-2 times larger for conference presentations than for journal publications. The effects of the internet use variables are on the one hand slightly larger: the differences in regard to the number of conference presentations between “communicators” and “e-mail communicators” or “silent researchers” (model 1), and between scientists with a homepage with full text and those without an individual homepage (model 3) are even bigger than for journal publications. On the other hand, the variables on the use of the internet for information retrieval (model 2) slightly miss the significance threshold of 5% (in particular the use of peers’ homepages for information retrieval with 0.057% error probability in the t-test).
Table 4. Models for the total number of journal publications 2001–20002 (marginal effects) Variable (1) Poisson (2) NEGBIN, hurdle (3) NEGBIN, hurdle (4) NEGBIN, hurdle (5) NEGBIN, hurdle Constant –10.80** –8.51** –7.77** –9.60** –8.59** Germany 0.17 0.26 0.32 0.38 0.32 Denmark –0.90** –0.77 –0.80 –0.62 –0.79 Italy 0.60* 0.68 0.67 0.61 0.89* Ireland –1.81** –1.20* –1.15* –1.21* –1.00* The Netherlands 0.31 0.16 0.20 0.11 0.32 UK 0.47 0.35 0.34 0.42 0.39
Non-university research org. –1.31** –0.92* –1.04** –0.75* –0.83* University of applied science –1.27 –0.32 –0.20 –0.39 –0.20
Other organization –1.60* –0.74 –0.81 –0.11 –0.44 Astronomy 2.37** 2.38** 2.47** 2.17** 2.37** Chemistry 3.09** 2.92** 3.18** 2.92** 2.97** Computer science –2.53** –2.61** –2.48** –2.42** –2.85** Economics –1.28** –1.21** –1.01** –1.14** –1.45** Other disciplines 0.11 –0.10 0.00 –0.04 –0.10 Age 0.61** 0.52** 0.46** 0.53** 0.51**
Age (squared) –0.63E–02** –0.56E–02** –0.48E–02** –0.55E–02** –0.53E–02**
Gender 0.99** 1.10** 1.03** 1.07** 0.99**
Recognition 0.88** 1.00** 0.86** 0.93** 0.96**
Motivation 1 –0.12 –0.07 –0.15 –0.14 –0.08
Motivation 2 0.36** 0.44** 0.41** 0.32* 0.42**
Total number of collaboration partners 4.03E–02** 4.62E–02** 4.08E–02** 4.65E–02** 4.55E–02** Squared total number of collaboration
partners –0.50E–04** –0.64E–04** –0.56E–04** –0.65E–04** –0.61E–04**
Communicators 1.38**
E-mail communicators 1.12**
Info. retrieval from peers websites 0.30
Info. retrieval from elec. journals and
full text databases 0.48**
Info. retrieval from websites of other
institutions –0.46*
Own homepage with full text 0.97**
Own homepage without full text 0.41
Additional reference group Silent
researchers No homepage Log likelihood –3158.39 –2573.20 –2554.17 –2396.55 –2548.16 Restr. log likelihood –4458.67 –4458.67 –4458.67 –4172.45 –4439.37
Observations 1142 1142 1142 1070 1135
Female psychologists from Switzerland which work at universities were chosen as the reference categories for the dummy variables.
significance levels ** < 0.01, * < 0.05. Source: SIBIS R&D survey.
The estimation results for working papers are reproduced in Table 5, models (4)-(6). Most of the dummy variables for disciplines, countries and types of organization are not significant in these models (not shown in the table): the differences are less pronounced than for the previous two productivity indicators except for economics. The measured age and recognition effects are significantly weaker for working papers, reaching only one third the effects for journal publications and conference presentations. The gender dimension is also reduced and not even significant in any of the estimations; the same applies to the motivational dimension (career motivation). The relationship between the size of the collaboration network and the number of working papers produced is half the size found for the other variables for research productivity, and a curvilinear effect cannot be corroborated in this case. Bearing in mind these variations in regard to the size of the effects, it is quite astonishing that for two of the investigated internet applications the direction and the magnitude of the effects are nearly the same as for the other productivity indicators.
Table 5. NEGBIN hurdle models for the total number of conference presentations and working papers 2001–2002 (marginal effects)
Conference presentations 2001–2002 Working papers 2001–2002
Variable (1) (2) (3) (4) (5) (6)
Communicators 1.57** 1.35**
communicators 1.43** 0.85**
Info. retrieval from
peers websites 0.40 0.23
Info. retrieval from electronic journals and full text
databases 0.31 0.09
Info. retrieval from websites of other
institutions –0.05 0.43*
Own homepage with
full text 1.27** 0.99**
Own homepage
without full text 0.15 0.45
Additional reference group Silent researchers No homepage Silent researchers No homepage Log likelihood –2832.18 –2653.21 –2821.29 –1848.76 –1768.41 –1845.48 Restr. log likelihood –4392.06 –4057.70 –4369.02 –3595.60 –3431.46 –3578.07
Observations 1141 1068 1134 1126 1055 1119
Female psychologists from Switzerland which work at universities were chosen as the reference categories for the dummy variables.
significance levels ** < 0.01, * < 0.05. Source: SIBIS R&D survey.
Discussion
At first glance, the results for the internet use indicators point to a stable positive relationship between internet use and research productivity: those scientists who used e-mail, content-rich individual homepages (with full text) and electronic journals published more journal articles than their peers who did not use internet-based tools. The same relationships – except for the use of online information sources – apply to the giving of conference presentations and the writing of working papers. However, upon closer inspection the stability of the results breaks down.
• The first problem is the difficulty of assessing whether the use of internet applications is the cause or effect of higher research productivity. Both are possible and the present cross-sectional analysis does not have the power to discriminate between them.
• The second interpretation problem stems from the difficulty of clearly distinguishing between function and technology. For instance, respondents who communicated a lot via e-mail produced more research output than respondents who communicated less (“silent researchers”). However, respondents who used other communication media a lot (“communicators”) also showed higher research productivity than silent researchers, and even than the e-mail communicators (though the latter difference is not significant). Firstly, this result corroborates a positive relationship between communication and productivity – as already stated by BLAND & RUFFIN
(1992). Secondly it means that scientists who realised their communication mainly through e-mail and very little through other channels such as phone, letters, or face-to-face meetings did not have a significantly lower research productivity than scientists who used all media including e-mail intensively.
The same interpretation problem of function versus technology applies to the use of information sources. There seem to be differences regarding how appropriate an information source is for obtaining information that is relevant for a particular type of publication and audience: journal articles are written for the scientific community and the information used for their production comes from the same group of people. In the estimations this is expressed through a positive coefficient for electronic journals. Scientists who write books use regular libraries more often and go to conferences, seminars and workshops (not shown in the tables) but they rarely use e-journals. Respondents who produce reports often exhibit more use of the websites of other institutions which also tend to be the target group of reports. Overall, we could say that information sources and the audience of a scientific publication tend to match.
How can we interpret the results for the other covariates included in the analysis? • The overall productivity differences also reflect the significance of the
observed products for each scientific discipline: journal articles are very important for astronomers and chemists, working papers for economists, and conference presentations for all the disciplines included.
• With regard to the differences according to country it is remarkable that (a) they are hardly significant and (b) for Ireland the result is robust no matter what output indicator we take. Irish scientists tend to have lower research productivity than Swiss scientists (and than scientists from most other countries, taking the magnitude of the marginal effects). Strangely enough, the effect gets weaker when the homepage variables are included. Perhaps the results for Ireland can be explained by its peripheral geographic position to the European mainland. A homepage might contribute to overcoming this disadvantage, and therefore we find an interaction between both variables. However, these explanations are rather speculative and need some further exploration, as the available data does not provide a clear answer.
• Both age and the size of the collaboration network produce a curvilinear effect: research output increases with age (the size of the collaboration network), but the effect gets less pronounced and may even go negative for higher ages (bigger networks). The curvilinear age effect has been found and described in previous analyses: scientists reach maximum research productivity between 35 and 45 and then they invest more of their working time in other tasks such as research management and teaching (CARAYOL
& MATT, 2004; FOX, 1983; WRAY, 2003). The curvilinear effect of the size of the collaboration network is also highly plausible: As we employed a full counting method for publications, a scientist who produced two papers with co-authors enters the dataset with two publications, whereas another scientist, who individually produced a single paper with the same effort, enters with one. This describes the positive impact of collaborations on measured research productivity. The negative impact, i.e. smaller benefit of large collaboration networks, may be explained by the rising costs of communication and coordination (KATZ & MARTIN, 1997). Obviously there is a trade-off between writing articles and engaging in collaborative R&D and it increases as the collaboration network gets larger.
• Female scientists produced significantly fewer papers than male scientists. Though we did not investigate the reasons ourselves, previous evidence demonstrates that neither differing abilities of male and female scientists nor the amount of their family duties are the cause (PRPIC, 2002). The problem is rather that the social organisation of science is not
gender-neutral. Women encounter more barriers before they reach tenure and their structural position is weaker than that of male scientists (ETZKOWITZ et al., 1992; SHAUMAN & XIE, 2003).
The positive effect of pronounced career motivation was also expected from the surveyed previous findings. The increased effect of career motivation on conference presentations indicates their particular functionality for career advancement. Conferences also have the function of a marketplace for human resources.
Whereas the relationships between these variables and journal articles and conference presentations are mostly of the same magnitude, the relationships to working papers are generally smaller and in some cases insignificant. Working papers are somewhat of an intermediate product of science and they are largely published under the author’s own responsibility. Systemic influences such as peer review or the availability of funds (for travelling to a conference) are less important in the publication process. Also, the significance for career advancement is lower. Therefore, the social processes of knowledge production are less visible in this type of output.
Conclusions
The present analysis investigated the relationship between internet use and research productivity in the context of other influences. The results for these other influences followed the pattern of previous work on research productivity: in particular, both for journal articles and conference presentations, the effects of age, gender, recognition, career motivation and the size of the collaboration network are very stable. This increases our confidence that the estimation results are sound and meaningful.
The results seem to corroborate a positive correlation between internet use and research productivity: the variables on internet use are strongly related to research productivity. There is no indication that the internet distracts scientists from work and reduces their output. Nevertheless, the results should be interpreted with caution. It is plausible that “the internet makes things easier, faster and more global” (GLÄSER, 2003, p. 43). However, we must not forget that other “tools” and aides like the telephone and fax machine, library staff and research assistants, or mailings to colleagues were capable of fulfilling the functions that the internet has to some extent taken over. In order to assess the real benefits of the internet, these previous tools have to be accounted for when the relationships between internet use and research productivity are analysed. That means, essentially a longitudinal approach is required that should include data which was collected in pre-internet times.
References
ANDREWS, F. M. (1979), The international study: its data sources and measurement procedures. In: F. M. ANDREWS (Ed.), Scientific Productivity. The Effectiveness of Research Groups in Six Countries, Cambridge: Cambridge University Press, pp. 17–52.
BAIRD, L. L. (1986), What characterizes a productive research department? Research in Higher Education, 25 : 211–225.
BLACKBURN, R. T., BEHYMER, C. E., HALL, D. E. (1978), Research note: Correlates of faculty publications. Sociology of Education, 51 : 132–141.
BLACKBURN, R., BIEBER, J. P., LAWRENCE, L. H., TRAUTVETTER, L. (1991), Faculty at work: focus on research, scholarship and service. Research in Higher Education, 32 : 385–413.
BLAND, C. J., RUFFIN, M. T. (1992), Characteristics of a productive research environment: literature review. Academic Medicine, 67 : 385–397.
BORDONS, M., MORILLO, F., FERNANDEZ, M. T., GOMEZ, I. (2003), One step further in the production of bibliometrics indicator at the micro level: Differences by gender and professional category of scientists. Scientometrics, 57 : 159–173.
BORDONS, M., GOMEZ, I., FERNANDEZ, M. T., ZULUETA, M. A., MENDEZ, A. (1996), Local, domestic and international scientific collaboration in biomedical research. Scientometrics, 37 : 279–295.
BRAUN, T., GLÄNZEL, W., SCHUBERT, A. (2001), Publication and cooperation patterns of the authors of neuroscience journals. Scientometrics, 51 : 499–510.
CAMERON, A. C., TRIVEDI, P. K. (1998), Regression Analysis of Count Data. Cambridge, UK: Cambridge University Press.
CARAYOL, N., MATT, M. (2004), Does research organization influence academic production? Laboratory level evidence from a large European university. Research Policy, 33 : 1081–1102.
CARLEY, K., WENDT, K. (1991), Electronic mail and scientific communication. A study of the SOAR extended research group. Knowledge: Creation, Diffusion, Utilization, 12 : 406–440.
CLARK, B. R. (1995), Places of Inquiry: Research and Advanced Education in Modern Universities. Berkeley: University of California Press.
COHEN, J. (1996), Computer mediated communication and publication productivity among faculty. Internet Research: Electronic Networking Applications and Policy, 6 (2/3) : 41–63.
COLE, J. R., ZUCKERMAN, H. (1984), The productivity puzzle: persistence and change in patterns of publication of men and women scientists. In: P. MAEHR, M. W. STEINKAMP (Eds), Advances in Motivation and Achievement, Vol. 2, Greenwich: JAI Press, pp. 217–258.
EUROPEAN COMMISSION (2003), Third European Report on Science & Technology Indicators 2003 – Towards a knowledge-based economy. Brussels: European Commission.
ETZKOWITZ, H., KEMELGOR, C., NEUSCHATZ, M., UZZI, B. (1992), Athena unbound: Barriers to women in academic science and engineering. Science and Public Policy, 19 : 157–179.
FINHOLT, T. A. (2002), Collaboratories. Annual Review of Information Science and Technology, 36 : 74–107. FINHOLT, T. A., OLSON, G. M. (1997), From laboratories to collaboratories: A new organizational form for
scientific collaboration. Psychological Science, 8 : 28–36.
FOX, M. F. (1983), Publication productivity among scientists: a critical review. Social Studies of Science, 13 : 283–305.
FOX, M. F. (1992), Research, teaching and publication productivity: mutuality versus competition in academia. Sociology of Education, 65 : 293–305.
FRY, J. (2004): The cultural shaping of ICTs within academic fields: Corpus-based linguistics as a case study. Literary and Linguistic Computing, 19 : 303–319.
GLÄNZEL, W. (2002), Co-authorship patterns and trends in the sciences (1980–1998). A bibliometric study with implications for database indexing and search strategies. Library Trends, 50 : 461–473.
GLÄSER, J. (2003), What internet use does and does not change in scientific communities. Science Studies, 16 : 38–51.
GREENE, W. E. (2000), Econometric Analysis (4th ed.). Upper Saddle River, NJ: Prentice Hall.
HEMLIN, S., GUSTAFSSON, M. (1996), Research production in the arts and humanities – A questionnaire study of factors influencing research performance. Scientometrics, 37 : 417–432.
HEMPTINNE, Y. DE, ANDREWS, F. M. (1979), The international comparative study on the organization and performance of research units: an overview. In: F. M. ANDREWS (Ed.), Scientific Productivity. The Effectiveness of Research Groups in Six Countries. Cambridge: Cambridge University Press, pp. 3–15. HESSE, B. W., SPROULL, L. S., KIESLER, S. B., WALSH, J. P. (1993), Returns to science: Computer networks
in oceanography. Communications of the ACM, 36 (8) : 90–101.
HILGARTNER, S. (1995), Biomolecular database – new communication regimes for biology? Science Communication, 17 : 240–263.
HOLLINGSWORTH, R., HOLLINGSWORTH, E. J. (2000), Major Discoveries and Biomedical Research Organizations: Perspectives on Interdisciplinarity, Nurturing Leadership, and Integrated Structure and Cultures. Retrieved March 08, 2005 from http://www.umu.se/inforsk/universitets ligan/hollingsworth.html JOHNSTON, R. (1994), Effects of resource concentration on research performance. Higher Education,
28 : 25–37.
KAMINER, N., BRAUNSTEIN, Y. M. (1998), Bibliometric analysis of the impact of Internet use on scholarly productivity. Journal of the American Society for Information Science, 49 :720–730.
KATZ, J. S., MARTIN, B. R. (1997), What is research collaboration? Research Policy, 26 : 1–18.
KIRCZ, J. G. (1998), Changing Presentations! Changing Science? Paper presented at the Colloquium “L'écrit de la science/Writing Science” organised by the journal “Alliage” for The European Science & Technology Forum of the European Commission (DG XII), Nice 12-14 March 1998. Retrieved October 12, 2003 from http://www.science.uva.nl/projects/commphys/ papers/nicem.htm
KLING, R., CALLAHAN, E. (2001), Electronic journals, the Internet, and scholarly communication. Annual Review of Information Science and Technology, 37 : 127–177.
KLING, R., MCKIM, G. (2000), Not just a matter of time: Field differences and the shaping of electronic media in supporting scientific communication. Journal of the American Society for Information Science, 51 : 1306–1320.
KNORR, K. D., MITTERMEIR, R., AICHHOLZER, G., WALLER, G. (1979), Individual publication productivity as a social position effect in academic and industrial research units. In: F. M. ANDREWS (Ed.), Scientific productivity. The effectiveness of research groups in six countries. Cambridge: Cambridge University Press, pp. 55–94.
LATOUR, B., WOOLGAR, S. (1979), Laboratory Life. The Social Construction of Scientific Facts. Beverly Hills, CA, and London: Sage Publications.
LEVIN S. G., STEPHAN P. E. (1991), Research productivity over the life cycle: Evidence for academic scientists. American Economic Review, 81 : 114–132.
LONG, J. S. (1978), Productivity and academic position in the scientific career. American Sociological Review, 43 : 889–908.
NENTWICH, M. (2003), Cyberscience – Research in the Age of the Internet. Vienna: Austrian Academy of Sciences Press.
NOAM, E. M. (1995), Electronics and the dim future of the University. Science, 270 : 247–249.
PELZ, D. C., ANDREWS, F. M. (1966), Scientists in Organizations. Productive Climates for Research and Development. New York: John Wiley.
PRPIC, K. (1996), Scientific fields and eminent scientists’ productivity patterns and factors. Scientometrics, 37 : 445–471.
PRPIC, K. (2002), Gender and productivity differentials in science. Scientometrics, 55 : 27–58.
RAMESH BABU, A., SINGH, Y. P. (1998), Determinants of research productivity. Scientometrics, 43 : 309–329. RAMSDEN, P. (1994), Describing and explaining research productivity. Higher Education, 28 : 207–226. SHAUMAN, K., Y. XIE, (2003), Explaining sex differences in publication productivity among postsecondary
faculty. In: L. S. HORNIG (Ed.), Equal Rights, Unequal Outcomes: Women in American Research Universities. New York: Kluwer Academic/Plenum Publishers, pp. 175–208.
STEINMUELLER, W. E. (2000), Will information and communciation technology improve the ‘codification’ of knowledge? Industrial and Corporate Change, 9 : 361–376.
VAN ALSTYNE, M., BRYNJOLFSSON, E. (1996), Could the Internet Balkanize science? Science, 274 (5292) : 1479–1480.
VAN LEEUWEN, T. N., MOED, H. F., TIJSSEN, R. J. W., VISSER, M. S., VAN RAAN, A. F. J. (2001), Language biases in the coverage of the Science Citation Index and its consequences for international comparisons of national research performance. Scientometrics, 51 : 335–346.
VISART, N. (1979), Communication between and within research units. In: F. M. ANDREWS (Ed.), Scientific productivity. The effectiveness of research groups in six countries. Cambridge: Cambridge University Press, pp. 223–252.
VON TUNZELMANN, N., RANGA, M., MARTIN, B., GEUNA, A. (2003), The Effects of Size on Research Performance: A SPRU Review. Retrieved November 22, 2004, from University of Sussex, Science Policy Research Unit Web site: http://www.sussex.ac.uk/spru/documents/geunaost.pdf
WALSH, J. P., KUCKER, S., MALONEY, N., GABBAY, S. (2000), Connecting minds: CMC and scientific work. Journal of the American Society for Information Science, 51 : 1295–1305.
WALSH, J. P., ROSELLE, A. (1999), Computer Networks and the Virtual College. Global Research Village (Special Issue), STI Review, 24 : 49–77.