1997MNRAS.289..651B
Mon. Not. R. Astron. Soc. 289, 651-659 (1997)
The microlensing optical depth of the COBE bulge
Nicolai Bissantz,l,2* Peter Englmaier, l James Binney3 and Ortwin Gerhard
1lAstronomisches Institut, Universitiit Basel, Venusstrasse 7, CH-4102 Binningen, Switzerland
2Physikalisches Institut, Universitiit Freiburg, Herrmann-Herder-Strasse 3, D-79104 Freiburg, Germany
3 Theoretical Physics, Keble Road, Oxford OXI 3NP
Accepted 1997 April 4. Received 1997 March 13; in original form 1996 November 28
ABSTRACT
We examine the left-right asymmetry in the cleaned COBEIDIRBE near-infrared data of the inner Galaxy and show (i) that the Galactic bar is probably not seen very nearly end-on, and
(ii) that, even if it is, it is not highly elongated. The assumption of constant mass-to-light ratio is used to derive simulated terminal velocity plots for the ISM from our model luminosity distributions. By comparing these plots with observed terminal velocities, we determine the mass-to-light ratio of the near-infrared bulge and disc.
Assuming that all this mass contributes to gravitational micro lensing, we compute optical
depths T for microlensing in Galactic Centre fields. For three models with bar major axis
between 10° and 25° from the Sun-Galactic Centre line, the resulting optical depths in Baade's
window lie in the range 0.83 x 10⁻⁶ :5 T:5 0.89 X 10⁻⁶ for main-sequence stars and
1.2 x 10⁻⁶ :5 T :5 1.3 X 10⁻⁶ for red clump giants. We discuss a number of uncertainties,
including possible variations of the near-infrared mass-to-light ratio. We conclude that, although the values predicted from analysing the COBE and gas velocity data are inconsistent
at the 2 -
2.50'
level with recent observational determinations of T, we believe that they shouldbe taken seriously.
Key words: Galaxy: centre - Galaxy: structure - gravitational lensing.
1 INTRODUCTION
It is widely recognized that observed optical depths to microlensing along various lines of sight from the, Sun constitute important constraints on models of the Milky Way. The first estimates of the optical depth T for lensing of bulge stars by foreground disc stars
were made under the assumption that the Galaxy is axisymmetric (Paczynski 1991; Griest et al. 1991). The contribution from bulge self-lensing is probably slightly larger than that from disc lensing, and the resulting combined T - 10-6 (Kiraga & Paczynski 1994).
Numerous studies have since confirmed the correctness of this estimate. When T has actually been measured, significantly larger values have been reported: T
=
(3.3 ::':: 1.2) x 10-6 (10') by Udalskiet al. (1994) and T = (1.9 ::':: 0.4) x 10-6 by Alcock et al. (1997). It
was suggested (Paczynski et al. 1994; Zhao, Spergel & Rich 1995) that the large measured values of T reflect the fact that the Galaxy is
barred (see, e.g., reviews in Blitz & Teuben 1996).
In principle a suitably oriented and elongated bar can signifi-cantly enhance T. To see this, imagine deforming an initially
axisymmetric bulge into a bar that points nearly to the Sun in such a way as to hold constant the velocity dispersion within Baade's window [(l,b) = (1", -3?9)]. This deformation will increase both the surface density of stars towards Baade's window and the depth along this line of sight within which the
*E-mail: [email protected]
stellar density is high. Since a star offers the largest cross-section for lensing a background star when it lies halfway between the back-ground star and us, both of these factors will increase T. However, in
this paper we show that if one assumes that near-infrared luminosity density is a fair tracer of stellar mass density in the inner Galaxy, then T is rather precisely constrained to be T
=
10-6 by acombina-tion of (i) the near- and far-infrared surface brightnesses that were measured by the DIRBE experiment aboard the COBE satellite, and (ii) the kinematics of gas in the inner few kiloparsecs as reflected in longitude-velocity plots from radio frequency emission-line studies of the interstellar medium (ISM).
In substantiating our claim we rely heavily on results obtained in three other papers, namely Binney & Gerhard (1996, hereafter Paper I), Spergel, Malhotra & Blitz (in preparation, Paper II) and Binney, Gerhard & Spergel (1997, Paper ill). In Paper II the COBEI
DIRBE data are cleaned for the effects of obscuration by dust, while Papers I and ill develop and apply a Lucy-Richardson algorithm for recovering models of the Galaxy's three-dimensional lumi-nosity density from the cleaned near-infrared surface photometry. This paper is organized as follows. In Section 2 we focus on left-right asymmetry within the observed near-infrared surface bleft-right- bright-ness measurements as a key diagnostic of the morphology of the Galactic bar. In particular, we explain how the length, axis ratios and orientation of a bar are reflected in its distribution of left -right asymmetry. We then compare these asymmetries both with the asymmetry that is apparent in the COBE data, and with the
1997MNRAS.289..651B
40 30 20
t
10
o
Figure 1. The asymmetry map of the COBE L-band data. Contours are spaced by 0.05 mag. Dotted contours indicate that the Galaxy is brighter on the right than on the left.
asymmetries that are predicted by our models of the Galaxy. These comparisons suggest that the Galactic bar is not seen very nearly end-on, and, even if it is, it is not highly elongated.
In Section 3 we assume that our models of the near-infrared luminosity density can be converted into mass models by multi-plying by an appropriate mass-to-light ratio T. We calibrate T by comparing simulated longitude-velocity plots of the ISM with observed (l, v) plots. Finally we determine T. In Section 4 we
discuss uncertainties and the possible causes for the difference between the optical depth inferred here and that inferred from the microlensing experiments.
2 LEFT-RIGHT ASYMMETRY
As Blitz & Spergel (1991) have emphasized, the key to using photometry to detect departures from axisymmetry within the Galaxy is the study of the ratio fl(l, b) that is defined for positive 1 by
fl(l, b)
==
I(l, b )/I( -l, b), (1) ",-25 ~-O.50 ~O.30 ... =1.91kpc 10 5 b 0 -5 -10 40 30 10 0 10 5 b 0 -5 -10 40 30 20 I ,...-10 '1=0.50 (-0.60 a..-1.91kpc 10 5 b 0 -5 -10 40 30 20 Iwhere I(l, b) is the surface brightness of the Galaxy at longitude 1
and latitude b. Fig. 1 is a contour plot of flfortheL-band COBEdata after the latter have been corrected for dust obscuration as described in Paper II. We shall call a plot such as Fig. 1 an asymmetry map.
Values of fl are available for pixels that are 1 ~5 square, but the values contoured in Fig. 1 are those obtained by smoothing the raw data by 5 pixels in 1 and 2 pixels in b with the SMOOFT routine of Press
et al. (1986). The estimated average uncertainty in L due to imcomplete dust obscuration corrections is approximately 0.076 mag, or two contours in Fig. 1 before smoothing (paper II). Local uncertainties may be larger, but will have been eliminated from Fig. 1 by smoothing. The region of negative fl near the Galactic Centre is thus probably real, and reflects the path length effect discussed by Blitz & Spergel (1991).
To appreciate the significance of Fig. 1 it is instructive to construct analogous figures for simple galaxy models. Fig. 2 shows several illustrative cases for the model introduced in Paper I. This consists of a barlbulge and a disc. Its luminosity density is given by
j(x)
=
jo [Mx)+
fct(x)l,
(2a)where
(2b)
There are four important parameters associated with this model bar: the length am, the axis ratios 'Y/,
r
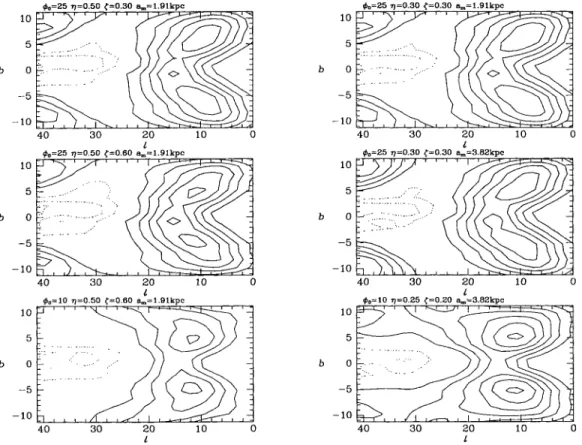
and the angle CPo between the Sun-Centre line and the long axis of the bar (which is defined such that the near end of the bar lies at 1 > 0 for 0° < CPo < 90°). The other parameters may be held constant at the values given in Table 1. WePa",,25 '1=0.30 ("-0.30 a.. ... l.91k:pc 10 5 b 0 -5 -10 40 10 5 b 0 -5 -10 40 10 5 b 0 -5 -10 40
Figure 2. Asymmetry maps of analytical models. The parameters in equations (2) of each model are given at the top of its panel. The contours are as in Fig. 1.
1997MNRAS.289..651B
Table 1. Parameters of the models.
Zo Zl
l00pc 2.5kpc 0.27 210 pc 42 pc 624
assume throughout that the Sun lies 14 pc above the Galactic plane as was deduced in Paper
m.
The top-left panel of Fig. 2 shows the asymmetry map for
a",
=
1.91 kpc, TJ=
0.5,t
=
0.3, cJ>o=
250• In contrast to the data
map, Fig. 1, all contours are positive, that is, for the given parameters, the model (2) is nowhere more than 0.05 mag brighter at I < 0 than it is at I > O. The brightness contrast peaks near (I, b)
=
(80, ±4°). For the middle-left panel of Fig. 2 the verticalaxis ratio
t
has been doubled tot =
0.6. This moves the peaks in the asymmetry map out away from b=
0 and increases their intensity. The top-right panel in Fig. 2 shows the effect of decreas-ing the planar axis ratio from 0.5 to TJ=
0.3 whilst holding the vertical axis ratio constant att
=
0.3. This leaves the peaks at approximately the same location but makes them more intense. The middle-right panel of Fig. 2 shows the effect of doubling the length of the bar from 1.91 kpc to 3.82kpc whilst holding the axis ratios constant at 0.3. This both moves the peaks towards larger I and higher b and makes the surrounding contours significantly moreextensive. Comparison of the middle and bottom-left panels of Fig. 2 shows the effect of rotating the bar to a more nearly end-on orientation; the bottom-left panel is for cJ>o
=
100 rather thancJ>o
=
250• This leaves the peaks in approximately the same locationbecause even at cJ>o
=
250 the line of sight through the Galactic10 5 b -5 -10 10 5 b 0 -5 -10 10 5 b 0 -5 -10
The optical depth of the CORE bulge
653
Centre effectively passes down the length of this fairly fat bar rather than intersecting it transversely. In this regime the magnitude of the peaks decreases with cJ>o - by symmetry it must vanish at cJ>o
=
O.The bottom-right panel of Fig. 2 shows the asymmetry map of a long (a",
=
3.82kpc) thin (TJ=
0.25,t
=
0.2) bar seen nearlyend-on (cJ>o
=
100). Comparison of this asymmetry map with that shownin the middle-right panel of Fig. 2 reveals that the effect of rotating a long thin bar to a more nearly end-on orientation is two-fold: it decreases the magnitude of the peaks as in the case of a short bar, but it now also shifts them to slightly lower longitudes. This is because when a thin bar is oriented at cJ>o = 250, the line of sight through the
Galactic Centre intersects the bar transversely. Finally, comparison of the two lower-right panels with the corresponding lower-left panels shows that rotation of a bar towards end-on orientation combined with elongation of the bar can leave the peaks in the asymmetry map at approximately the same locations. However, this combination of rotation and elongation modifies the shapes of the contours that surround the peaks in a characteristic way: they become more elongated in the longitude direction, and they tum upward towards high latitudes at I;;::: 200• This effect arises because
the far end of a long near- end-on bar appears small because it is far off, so away from the plane, and at large longitudes there is no counterpoint to the brightness contributed by the apparently large near end of the bar. Conversely, at small I and b, light from the far end of the bar provides an effective counterpoint to light from the near end of the bar, and the asymmetry is small.
We now construct improved models for the bulge luminosity distribution using the Lucy-Richardson algorithm of Papers I and
m.
The algorithm assumes triaxial symmetry of the bulge with respect to three orthogonal planes, whose orientations relative to an5 b 0 -5 5 b 0 -5 b 0 -51---~
Figure 3. Asymmetry maps of iterated models. The parameters in equations (2) of the model from which the iterations started are given at the top of each panel. The contours are as in Fig. 1.
1997MNRAS.289..651B
observer near the Sun are here fixed by the single angle
cPo.
Starting from an initial model whose projected brightness is a first approxi-mation to the COBE L-band data, the algorithm iteratively com-putes an improved non-parametric luminosity model, for fixedcPo.
The iterations are determined by the remaining discrepancies between model brightness and data, and the final model after six iterations is only weakly dependent on the initial model. Satisfac-tory models can be so obtained for a range of values of -15° :5
cPo
:5 45° (see Papers I and ill, and also the following discussion). Fig. 3 shows the asymmetry maps of the models that are generated by this algorithm from the COBE L-band data, when the iterations are started from the analytic models that generate the asymmetry maps of the corresponding panels in Fig. 2. Several points are noteworthy in this figure.(i) Especially in the
cPo
=
25° case, the asymmetry map of the model generated by the algorithm is remarkably independent of the initial analytic model, even though the length and axis ratios of the latter vary by factors of 2.(ii) The
cPo
= 25° final model provides a remarkably good fit to the global morphology of the COBE asymmetry map of Fig. 1. In particular, in the middle-right panel of Fig. 3 the two long ridges of maximal asymmetry around (1,b)=
(10°, ::!::6°) strongly resemble ridges in Fig. 1 that have similar locations and orientations. More-over, the height of these ridges is nearly the same in the two figures, as is the general shape of the low-lying contours near 1=
20°. Finer details of the observed asymmetry map shown in Fig. 1 are not reproduced in Fig. 3. These include the sharp local maximum at(1, b)
=
(16°,-n
and the strong north-south asymmetry. The former is almost certainly associated with a feature in the disc and does not concern us here. The north-south asymmetry in the observed asymmetry map could be a sign that the bar is slightly inclined with respect to the plane, as radio frequency emission lines from the ISM suggest (e.g. Liszt & Burton 1996).(iii) The asymmetry maps that are shown in the bottom panels of Fig. 3 for the case
cPo
=
10° both deviate from the observed asymmetry map of Fig. 1 in having contours at (1, b)=
(25°, ::!::7°) which slope towards higher 1 andIbl
rather than towards lower 1 athigher
Ibl.
Thus, whereas in the case ofcPo
=
25° the Lucy-Richardson iterations are able to eliminate the extensions towards high 1 andIbl
that are apparent in the middle-right panel of Fig. 2, the iterations cannot eliminate this unsatisfactory feature of the initial models in the casecPo
= 10°. When a bar is viewed nearly end-on it is inevitable that the sky is brighter up and to the left than ity
x
is at the corresponding point on the right - the far end of the bar then contributes light only at small negative 1 and small b.
3 THREE-DIMENSIONAL STRUCTURES AND MASS DENSITIES
Fig. 4 shows projections parallel to
z
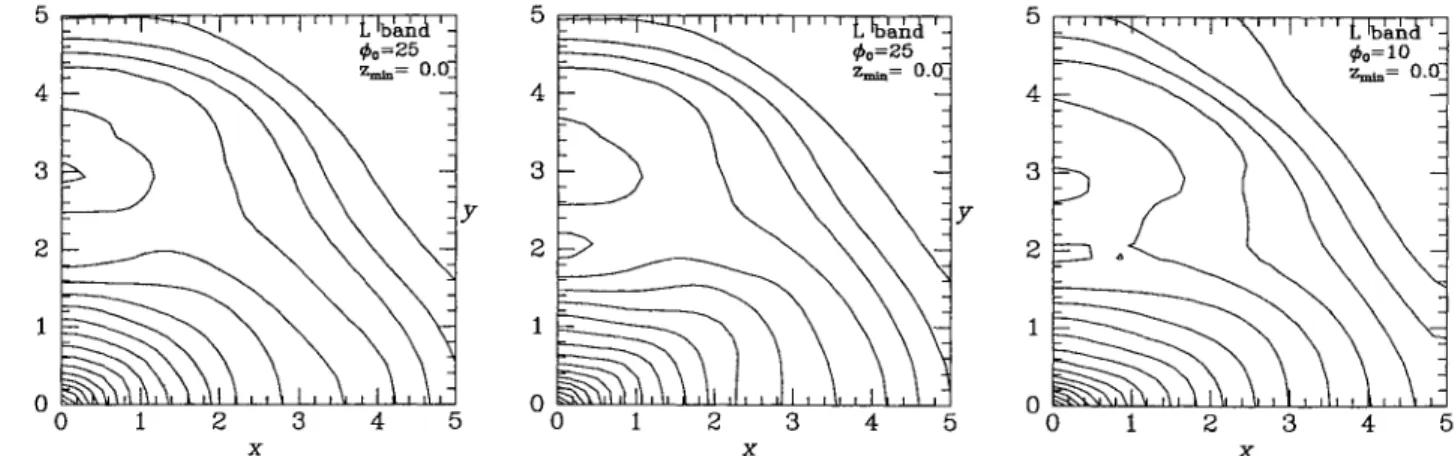
of the bars that were generated by six Lucy-Richardson iterations on the COBE L-band data from the analytic bars whose asymmetry maps are shown in the middle-left, middle-right and lower-right panels of Fig. 2. These bars are very similar to one another. In particular, the 25° model that started with a long bar finishes (middle panel) with a bar of exactly the same length as the 25° model that started with a bar of half the length (left-hand panel). Comparing the middle two panels of Figs 2 and 3, it is clear that the Lucy-Richardson iterations have dealt with the problem posed by the extension towards large 1 andIbl
of the peaks in the middle-right panel of Fig. 2 by shortening the bar. The 10° model shown in the right-hand panel of Fig. 4 has a slightlyshorter bar than do the 25° models shown in the middle and left-hand panels. Thus again the Lucy-Richardson iterations have shortened the bar, but the lower-right panel of Fig. 3 shows that now shortening is not accompanied by elimination of the unwanted extensions of the asymmetry peaks towards high 1 and
Ibl.
On the other hand, shortening the bar has made it possible to broaden it, and altogether this has increased the amplitudes of the peaks (cf. Fig. 2), as the observations demand. These experiments demonstrate that the gross structure of the models recovered by Lucy-Richardson iteration can be understood in simple general terms. Hence we may confidently assert that the Galactic surface brightness distribution is such that the length of the bar that is required to fit the COBE data for givencPo
is nearly independent ofcPo
forcP
:5 30°. We show below that the same is true of the optical depth to microlensing.Before an optical depth can be determined, it is necessary to associate a mass-to-light ratio
r
with a model. This we do as follows. We first construct a luminosity model for the entire Galaxy out to the solar radius, by combining the luminosity distribution recovered by the Richardson-Lucy algorithm inside our 5 x 5 x 1.4 kpc3 computational box with the initial model of Paper ill in the region outside the box. Then we reconstruct the cusp in the centre, which is unresolved in the DIRBE data, by fitting a power law to the multipole expansion of the luminosity distribution in the range 350-500pc. We next evaluate the combined model's poten-tial under the assumption of constantr.
Then we use a smoothedx x
Figure 4. Projections parallel to z of three final models. From left to right: for <1>0 = 25° started from a short fat analytic bar (middle-left panel of Fig. 2); started from a longer bar of similar cross-section (middle-right panel of Fig. 2); for <1>0 = 10° started from a long thin bar (lower-right panel of Fig. 2).
1997MNRAS.289..651B 250 R * 200 ~
'"
...!
150...
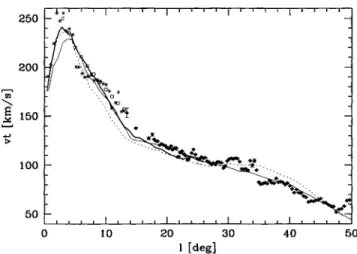
> 100 50 0 10 20 30 40 50 I [deg]Figure 5. Comparison of observed and model terminal velocities. The diamonds show the terminal velocities and their error bars from the CO data of Clemens (1985). The squares show unpublished HI terminal velocity measurements of Burton. The stars are H I terminal velocities read from the figures in Burton & Liszt (1993). The curves show the predictions from three SPH gas flow models after subtracting the component of solar tangential motion, Vo sin I, with Vo = 200 km S -1. Thin full curve: gas flow in the mass distribution obtained by inverting the COBE surface brightness map with
<1>0 = 20°, at intermediate numerical resolution. Thick full curve: the same model in a higher-resolution simulation. Dotted curve: gas flow in model inverted with <1>0 = 10°. The Sun's galactocentric radius has been taken to be
Ro
=
8 kpc. The models have been observed at time t=
0.12 Gyr and have been scaled to fit by eye the observed data between 1 = 1r and 48°.particle hydrodynamics (SPH) code to simulate the flow of gas inside -8 kpc [see Englmaier & Gerhard (in preparation) for details], including a higher resolution simulation for the central -4 kpc. In this simulation, the assumed pattern speed of the bar is 60km S-I kpc-I , placing corotation at 3.1 kpc. The gas flow velo-cities in the simulation are transformed into a putative local standard of rest (LSR) frame at the position of the Sun at Ro
=
8 kpc. For this transformation we assume that the LSR has a tangential velocity vo, but no component of motion in the direction of the Galactic Centre. For each line of sight we evaluate the maximum velocity that would be seen in radio frequency emission-line measurements.We compare the resulting model terminal velocity curve with the observed HI and CO terminal velocities (corrected for line width, but not for peculiar LSR motion: Burton & Liszt 1993; Clemens 1985). Specifically, for
Vo
=
180, 190, 200, 21O,220kms-1 wechoose the value of T that gives the best eye-ball fit to the observed velocities in the region between I
=
17° and 48°. Finally we choose an optimal (vo, T) combination.The thin full curve in Fig. 5 shows the fit between model and data for a model with
CPo
=
20° under the assumptionVo
=
200 km S I -the fit to -the data at 17° < I < 48° is consistent with the scatter in the data points (-5 per cent). In the range 9° :5 1:5 17° the model curve falls below the data by :520kms-l . This may reflect that fact that the photometric inversions show a strongly elliptic disc at 1.5 :5 r :5 3.5 kpc, and, as discussed in Paper ill, this could be caused by the presence of supergiants in star-forming regions along prominent spiral arms. If so, our assumption of constant T may not be correct in this region and the gravitational forces in our models may be insufficiently accurate at radii corresponding to 9° :5 I :5 17°. At I - 3° the thin full model curve in Fig. 5 falls below the sharply peaked data. This may in part be due to theThe optical depth of the CORE bulge
655
Table 2. Microlensing optical depths in Baade's window for the three COBE models shown in Fig. 4, in units of 10-6 .
Model <1>0 tlm Mb•2.4
1=0
-61=-1
-6 25° 1.91 kpc 8.6 x 10⁹ 1.2 0.86 2 25° 3.82kpc 8.1 x 10⁹ 1.2 0.83 3 10° 3.82kpc 7.2 x 10⁹ 1.3 0.86model's pattern speed being not quite correct, but in large measure it undoubtedly reflects the limited spatial resolution of our models: the thick full curve in Fig. 5 shows the predictions for exactly the same model as the thin full curve, but calculated from a higher-resolution SPH simulation. It can be seen that the thick curve halves the shortfall of the thin curve with respect to the data. However, this gas flow is not stationary, and as more gas falls towards the Galactic Centre and the vicinity of the cusped orbit is depopulated, the maximum velocities seen in the bulge region decrease again.
The dotted curve in Fig. 5 shows the predictions of the model with
CPo
=
10°. AgainVo
=
200kms-1 has been assumed. Thematch to the data for this model is reasonable but somewhat inferior to that obtained with the corresponding
CPo
=
20° model (thin full curve). Specifically, forCPo
=
10° there are systematic deviations -10 km s -I from the observed velocities. About half the difference between the terminal velocity curves of the 10° and 20° models is due to the difference in viewing angles; the remaining discrepancy is due to intrinsic differences in the model gas flows.The quality of the fit between the thick full curve and the data in Fig. 5 indicates that to first order we may assume that the mass-to-light ratios of the bulge and disc are equal. With this assumption we find
(3a) where jL(X) is in COBEIDIRBE luminosity units per kpc3 as in
Paper ill and
TL(cpo
=
20°)=
3.47 X 10⁸ Mo COBE unit-I ,TL(cpo
=
10°)=
3.37 X 10⁸ Mo COBEuniCI . (3b)Thus the derived mass-to-light ratio T L is almost independent of
CPo.
The uncertainties in the normalization of p(x) are as follows. Changing the tangential velocity of the LSR to 180 and 220 km S-I changes T L by -10 and
+
1 0 per cent, respectively. From the above discussion of the velocity peak in Fig. 5, we conclude that the near-infrared mass-to-light ratio of the bulge can differ from that of the disc by at most :520 per cent. Other uncertainties such as that caused by the unknown projection angleCPo
are smaller.In Table 2 we give approximate bulge masses interior to cylind-rical radius R
=
2.4 kpc for the three COBE models of Fig. 4. These were estimated from the complete density field p(x) in the following way. We associated with the disc all mass that lies within 0.1 rad of the plane (as seen from the Galactic Centre). For each bounding radius R we compared the total mass Mtot(R) inside R with the mass Mb(R) inside R that is, by the above definition, non-disc mass. Wefound that Mb saturates for R between 2 and 3 kpc. For R :5 2.5 kpc
the difference MIDt - Mb is approximately equal to the mass of the
initial analytic disc model of Paper ill that lies within R, while
further out there is significant disc mass that is not accounted for by the initial analytic model. From these results we infer that a reasonable estimate of the bulge'S mass is given by the difference between Mtot(2.4 kpc)
=
1.9 X 10¹⁰ Mo and the mass of the initial1997MNRAS.289..651B
disc that lies at R :5 2.4 kpc. This is the quantity that is given for each model in Table 2.
4 MICROLENSING OPTICAL DEPTHS
The microlensing optical depth T(Ds) for a source at distance Ds is the probability for it to fall within one Einstein radius of any intervening star:
4'TTG
2J1
= - 2 Ds p(x)x(l-x)dx,
c 0
(4)
where P(Dd) is the mass density oflenses at distance Dd, x
=
DdiDs'and Ds
=
Dd+
Dds' T depends only on the mass density of lenses,and is independent of the lensing mass spectrum. The measured optical depth in the direction (1, b) is the function T(Ds) averaged over all observable sources that are brighter than some apparent magnitude m in a cone of small ol,ob around (1, b). Following Kiraga & Paczynski (1994) it is customary to parametrize the distribution in Ds of these sources as
dN(Ds) 2+2/l
~
=
constant x p(Ds)Ds . s(5)
This assumes that the luminosity function of sources is constant along the line of sight and that the fraction of stars brighter than luminosity L is proportional to L/l; the factor
D;
accounts for the increase of volume with distance. Thusr
T(D s)p(Ds)D;+2/ldD
s(T)
=
"-'o'----:;:~::::---_Jt(D
s)d.+2i3dD
s(6)
Table 2 lists optical depths L6 "" (T)/1O-6 in Baade's window [(1, b) =(1°,-3.9°)], for the three luminosity models that are shown in Figs 2-4. In all cases the integrals were evaluated for the density peDs) =
r
Lh(Ds) with the scaling of equations (3). Two values of {3 were considered: {3=
0, appropriate for stars that can be detected at any distance along the ·line of sight, such as the clump giant stars, and {3 = -1, which is more appropriate for main-sequence stars (Kiraga & Paczynski 1994; Zhao, Rich & Spergel 1996; Zhao & Mao 1996). Fig. 6 shows optical depths along the minor axis 1 = O. The differences between models are everywhere small and can be quantified to first order by assigning a multi-plicative constant to each model. The difference between the {3 = 0 and {3 = -1 cases is of order 35 per cent in Baade's window. Fig. 7 shows an optical depth map for one of the models. Maps for other models have similar structure.In comparing these results with observations, note that the self-lensing contribution of the Galactic disc is automatically taken into account. If we restrict the source stars to be bulge stars, the optical depth increases by of order 25 per cent. For a bulge star at 8-kpc distance in Baade's window, foreground lenses with galac-tocentric distances 0-2, 2-3, 3-4, 4-5 and 5-8 kpc contribute
L6 = 0.42,0.19,0.15,0.12 and 0.21 to the total optical depth T_6=1.1.
The main results from Table 2 and Figs 6-7 are the following. (i) The predicted values of T are almost independent of the
orientation rPo of the bar and of the initial model from which the iterations were started.
----.. 0 <0 I
...
'--" ~ -1 -2o
2 4 6 b {degJ ~ ~ ", , , , , , , ',~ ',:~ 8 10Figure 6. Microlensing optical depth for several models along the minor axis (l = 0). The short-clashed lines show optical depth as a function of latitude for the <1>0 = 25° bulge-disc model (top-left panel of Fig. 3). The long-dashed lines show optical depths for the long <1>0 = 25° model (middle-right panel of Fig. 3 and middle panel of Fig. 4). The solid lines show optical depths for the <1>0 = 10° model (bottom-right panel of Fig. 3 and right panel of Fig. 4). For all models, the upper curve is for (3 = 0 and the lower curve is for (3 = -1. 8 if>o=25, 7]=0.30, ~=0.30, am=3.82 kpc, {3=-1 6 2 5
o
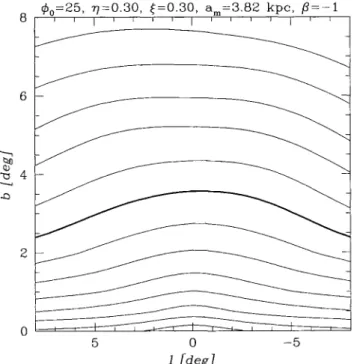
-5 1 {degJFigure 7. Microlensing optical depth map for the model shown in the middle-right panel of Fig. 3 and middle panel of Fig. 4. The thick contour has
T -6 = 1; the spacing between contours corresponds to a factor of 1.5. © 1997 RAS, MNRAS 289, 651-659
1997MNRAS.289..651B
(ii) For
fJ
=
-1, the predicted optical depth in Baade's window is 7-6=
0.8-0.9; for comparison, the inferred OGLE and MACHO values for main-sequence stars are 7_6=
3.3 ± 2.4 (20) from nine events (Udalski et al. 1994), and L6=
1.9 ± 0.8 (20) from 41 events (Alcock et al. 1997) when the correction for the disc's contribution is removed. The predicted optical depth at the mean(I, b)
=
(2~7, -4~08) of the MACHO fields is =15 per cent lower than in Baade's window. Both quoted measurements are consistent with our prediction only at the 2 - 2.5u level.(iii) For 13 clump giants, Alcock et al. (1997) find 7_6
=
3.9:t:U(2u). These values are averages over ~ 12 square degrees centred at
(I, b)
=
(2~55, - 3?64). Our predicted optical depth at this position is =7 per cent higher than the result for Baade's window. Thus again our estimate is consistent with the Alcock et al. result only at the 2ulevel.
A more accurate comparison with the observations would involve averaging the optical depth in Fig. 7 over the various observed fields, taking into account the number of stars monitored in each field, the total time monitored per field, etc.
5 DISCUSSION AND CONCLUSIONS
We have shown that models of the Galactic bulge/bar and inner disc which (i) agree with the COBEIDIRBE L-band photometric data, and (ii) have a constant L-band mass-to-light ratio, T L, fail to reproduce the reported microlensing optical depths to Baade's window by a factor of 2 - 3 - the predicted optical depths lie 2 - 2.5u below the measured values. In this section, we summarize the steps that lead to this conclusion and discuss possible ways out of this discrepancy.
5.1 The Galactic bar is short, Oat, not very elongated, and not very close to end-on
The asymmetry maps of simple analytical bars are dominated by twin peaks. The location of these peaks varies with the orienta-tion, elongation and axis ratios of the bar in a way that is readily understood. In particular, fatter bars have wider peaks, and lengthening a bar moves its peaks towards higher I and
Ibl.
A near end-on bar can have its peaks at similar locations to those of the Galaxy, but then its peaks are elongated differently from the Galaxy's.Lucy-Richardson iterations that start from one of these simple bars considerably improve the fit of the model's asymmetry map to that of the Galaxy by deforming the bar into an approximately standard shape. As was discussed in Paper ill, this bar has axis ratios I: 0.6: 0.4. The length of the three-dimensional part of this barf bulge is around 2 kpc. The part of the bar that extends to =3 - 3.5 kpc is strongly flattened to the plane.
If the Sun-Centre line is inclined at
CPo
= 25° to the long axis of the bar, this standard bar provides a good fit to the asymmetry map of the COBE data. However, if the bar is oriented much more nearly end-on, it provides an unacceptable fit to the observed asymmetry map, mainly because the model peaks have the wrong shape.Moreover, independently of the seriousness with which one views the failure of near end-on models to fit the observed asymmetry map, there can be little doubt as to the shape of the near-infrared luminosity density in the inner Galaxy, because this depends so insensitively on
CPo.
The optical depth of the CORE bulge
657
5.2 Bulge mass and microlensing optical depth for constant T L
If we assume that the mass-to-light ratio T L is some fixed number,
we can determine this number by comparing simulated terminal velocity plots with observed ones. We feel some confidence in this calibration because it yields an excellent fit to the Galactic terminal velocity curve (Fig. 5) and because the simulated (I, v) plots are similar to the observed (I, v) diagrams in that they show features such as the 3-kpc arm (Englmaier & Gerhard, in preparation).
Given the assumption of constant mass-to-light ratio T L, the mass distribution of the Galactic bar and inner disc is rather precisely constrained, and with it the optical depth to microlensing 7. Nearly independently of the bar angle
CPo,
7_6 =: 7110-6=
0.8-0.9 for main-sequence sources and 7_6 = 1.2-1.3 for clump giants, where the range of values given reflects the uncertainty owing to differ-ences between various allowed bar models. For a bulge star at 8-kpc distance in Baade's window, foreground 'bulge' lenses with galac-tocentric distances 0-3 kpc contribute =55 per cent to the total optical depth. These numerical values are for a tangential velocity of the LSR of Vo=
200 km S -1; if Vo=
220 km s -1, the terminal velocity curve is not fitted as well, but for this case the inferred mass-to-light ratio and optical depths are 10 per cent larger.These results are inconsistent with the measured optical depths at the 2u level, and are in conflict with the optical depths predicted by some earlier photometric bar models - for Baade's window Zhao, Rich & Spergel (1996) predict L6 = 1.1 for the bar only, while Zhao & Mao (1996) predict optical depths up to L6
=
3.There appear to be two reasons why our predictions lie below those of other photometric models.
(i) As discussed above, our model luminosity distribution differs from those used by other authors in three important respects: it is more centrally concentrated, more strongly flattened towards the plane and less elongated. These differences reflect the facts (1) that as a non-parametric model it fits the data better than do, for example, the widely used Dwek et al. (1995) parametric models, and (2) it is based on a much more sophisticated model of dust absorption than the foreground-screen model of Arendt et al. (1994). The central concentration, the large flattening and the moderate elongation of our model all conspire to diminish, for a given bulge mass, the predicted value of 7 in Baade's window because this field lies 4° from the plane.
(ii) We determine the mass-to-light ratio TL from gas velocities rather than from stellar kinematics. In our view gas velocities provide the more secure normalization because it is easier to model the relevant gas dynamics than the required stellar dynamics. In particular, it is at present clear neither what the line-of-sight distribution of any of the observed stellar samples is, nor how anisotropic the velocity ellipsoids of these stars are at various points along the line of sight (e.g. Sadler, Rich & Temdrup 1996). By contrast, the gas streamlines beyond R ;;::: 3 kpc deviate from circular orbits by only about 5 per cent.
These differences in the way that we have constructed our bulge model lead to our bulge mass being relatively small. Integrating over the total near-infrared luminosity distribution, multiplying by the normalization of equations (3), and subtracting the mass of the
initial disc models used for the iterations in Paper ill yields a bulge mass of Mb = 7.2 - 8.6 x 10⁹ Me') inside 2.4 kpc. By contrast, Zhao et al. (1996) derive Mb = 2 X 10¹⁰ Me'), while Zhao & Mao (1996) assume 1.8 x 10¹⁰ $ Mb/ Me') $ 2.8 X 10¹⁰. These masses are more
in accord with the total bulge plus disc mass in our model, which is Mtot
«
2.4kpc)=
1.9 x 10¹⁰ Me').1997MNRAS.289..651B
5.3 How to resolve the discrepancy?
We believe that our models of the inner Galaxy are the most carefully constructed models available, and that the lensing optical depths that they predict should be treated with respect. Their ability to give a good qualitative account of observed (I, v) diagrams (Englmaier & Gerhard, in preparation) gives one considerable confidence in their fundamental correctness. We trust that this confidence will soon be tested by an examination of their ability to account equally well for the data on stellar velocity dispersions in the inner Galaxy - complete dynamical models are in an advanced state of preparation. However, even now it is puzzling that there is such significant conflict between the optical depth obtained from the microlensing experiments and that obtained from our modelling of the CO BE and H I terminal velocity data. Several possible causes of this discrepancy stand out.
The first is that the corrections of Spergel et al. (in preparation) for dust absorption are incorrect. As we have emphasized, the non-axisymmetric shape of the central luminosity distribution depends upon asymmetries of :50.4 mag in the adopted dust-free brightness distribution. Consequently, small errors in the absorption correc-tions that have been applied to the COBE data could have significant effects on the final model, especially in the vicinity of the Galactic plane. However, against this possibility one must count the rigorous checks which Spergel et al. showed their corrections could pass. The remaining scatter in the dereddened K - L colours is only 0.076 mag, which they take as a reasonable estimate of the uncer-tainty in L. Any errors in the absorption corrections are likely to be significantly smaller in Baade's window than in the Galactic disc at lower latitudes. Notice also that any clumpiness of the dust distribution is automatically taken into account in the scaling to the near-infrared reddening. Finally, the experiment reported below shows that if the mass in the Galactic plane has been overestimated, the indirect effects on the optical depth cannot be very large.
Another possible source of error might be the assumption of eight-fold (triaxial) symmetry assumed in the deprojection of the bulge. If the main part of the bulge is orientated more end-on than the part that causes the most prominent features in the difference maps, the optical depths obtained from our models might under-estimate the real optical depths. There is a limit to the amount by which we can stretch bulge light along the line of sight, however: the bulge/bar proper must lie within its corotation radius, which from the gas dynamics we know to be - 3 kpc. Therefore we can obtain an upper limit on the magnitude of the effect of rearranging part of the bulge in the following way. We redistribute the surface density in Baade's window that arises from the density at line-of-sight distances in the ran~e [ - 3 kpc, 3 kpc] from the centre (75 per cent of the total), homogeneously in that distance range. This increases the number of sources at the far end and the number of lenses at the near end of the bar, so that the total optical depth increases by 20 per cent (for Model 2). This is a substantial overestimate of the effect of redistributing some of the bulge light, because any bulge, whatever its orientation, will be inhomo-geneous. Thus the error introduced by our assumption of eight-fold symmetry must be below 10 per cent.
The third possibility is that searches for microlensing events are more efficient than their practitioners estimate. It is obviously hard for us to comment on this possibility. Blending effects have been suggested as a possible cause of overestimating the detection efficiencies (Alard 1997) at perhaps a -30 per cent level for main-sequence stars. However, these effects are expected to be less important for clump giants.
The final possibility is that the L-band mass-to-light ratio varies significantly with position in the inner Galaxy. Specifically, if TL were higher above the plane than in the plane, the map of optical depth shown in Fig. 7 would have too steep a gradient away from the plane. This might be the case if the L-band light distribution had a significant contribution from young supergiant stars unrelated to the bulk of the old stellar population, or if the bulge stars had a significant radial metallicity gradient, or if there was significant contribution to the L-band light from polycyclic aromatic hydro-carbon 3.3-fLm or dust emission, or if the distribution of stellar mass was more concentrated to the plane than the distribution of gravitating mass.
We have tested this by considering IDaSS models in which T L
varies as TL
=
TLO[1+
tanh(lzl/150pc)]. This doubles themass-to-light ratio at large Izl with respect to the value TLO in the plane. On recomputing the potential and choosing T LO so as to keep constant
the circular speed at 3 kpc, we find that T LO is 33 per cent lower than the value of TL that is given in equation (3a). Thus the constraints from the terminal velocity curve ensure that the mass of the upper bulge increases only by a factor of 1.34 when we assume that T is there twice as great as in the plane. The resulting values for the optical depth in Baade's window, L6 = 1.08 for (3 = -1 main-sequence stars and 7-6
=
1.5 for (3=
0 clump giants, still lie well below the measured values.Similarly, even models that include 'dark discs' are unlikely to give much higher optical depths to Baade's window than those calculated here, for the following reason. The good fit of our model terminal velocity curve to the observed terminal velocities in Fig. 5 argues that the radial distribution of mass in the model is approxi-mately correct. Thus the radial mass distribution of any additional component has to be similar to that of the near-infrared light, and our derived mass-to-light ratio automatically includes its contribu-tion. The main remaining freedom is to shift IDaSS out of the
Galactic plane while keeping the integrated surface density con-stant. This would be most effective about half-way between the Sun and the Galactic Centre, where the NIR disc has a vertical exponential scalelength of hz - 150pc (Paper ill, fig. 9). The line of sight to Baade's window passes about -300 pc below the plane at galactocentric radius 4 kpc. If the vertical distribution of mass is also exponential, but with a longer scalelength and correspondingly reduced mass density in the plane, then the density at height 300 pc can be increased by up to a factor of 1.36. This optimal value occurs for hz
=
300 pc. Since thickening the disc reduces the contribution from lenses near the Sun and has little effect in the bulge, we conclude that by thickening the mass distribution one cannot increase the optical depth to Baade's window by more than -20 per cent.5.4 Conclusions
Constant mass-to-light ratio models of the inner Galaxy, which are consistent with the COBEIDIRBE near-infrared photometry and the H I and CO terminal velocity curve, result in low optical depths for bulge microlensing, almost independently of the orientation of the bar: L6
==
7/10-6=
0.9 for main-sequence sources, and L6 = 1.3 for clump giants. These values are incon-sistent at the 2 - 2.50- level with the optical depths inferred frommicrolensing experiments. We have discussed several possible uncertainties, including possible variations of the near-infrared mass-to-light ratio, but none of them appears to be large enough to explain the discrepancy.
1997MNRAS.289..651B
ACKNOWLEDGMENTS
We thank Butler Burton for sending unpublished HI terminal velocity data. The research at Basel is supported by the Swiss National Science Foundation.
REFERENCES
Alard C., 1997, A&A, 321, 424 Alcock C. et al., 1997, ApJ, 479, 119 Arendt R. G. et al., 1994, ApJ, 425, L85
Binney J. J., Gerhard O. E., 1996, MNRAS, 279, 1005 (paper I)
Binney J. J., Gerhard O. E., Spergel D. N., 1997, MNRAS, 288, 365 (paper ill)
Blitz L., Spergel D., 1991, ApJ, 379, 631
Blitz L., Teuben P., 1996, eds, Proc. IAU Symp. 169, Unsolved Problems of the Milky Way. Kluwer, Dordrecht
Burton W. B., Liszt H. S., 1993, A&A, 274, 765
The optical depth of the COBE bulge
659
Clemens D. P., 1985, ApJ, 295,422 Dwek E. et al., 1995, ApJ, 445, 716 Griest K. et al., 1991, ApJ, 372, L79
Kiraga M., Paczynski B., 1994, ApJ, 430, LIOI
LisztH. S., Burton W. B., 1996, in Blitz L., TeubenP., eds, Proc. IAU Symp. 169, Unsolved Problems of the Milky Way. Kluwer, Dordrecht, p. 297 Paczynski B., 1991, ApJ, 371, L63
Paczynski B., Stanek K. Z., Udalski A., Szymanski M., Kaluzny M., Kubiak M., Mateo M., Krzeminski W., 1994, ApJ, 435, LI13
Press W. H., Flannery B. P., Teukolsky S. A., Vetterling W. T., 1986, Numerical Recipes. Cambridge Univ. Press, Cambridge
Sadler E. M., Rich R. M., Temdrup D. M., 1996, AJ, 112, 171 Udalski A. et al. 1994, Acta Astron., 44 165
Zhao H. S., Mao S., 1996, MNRAS, 283, 1197
Zhao H. S., Spergel D. N., Rich R. M., 1995, ApJ, 440, LI3 Zhao H. S., Rich R. M., Spergel D. N., 1996, MNRAS, 282, 175