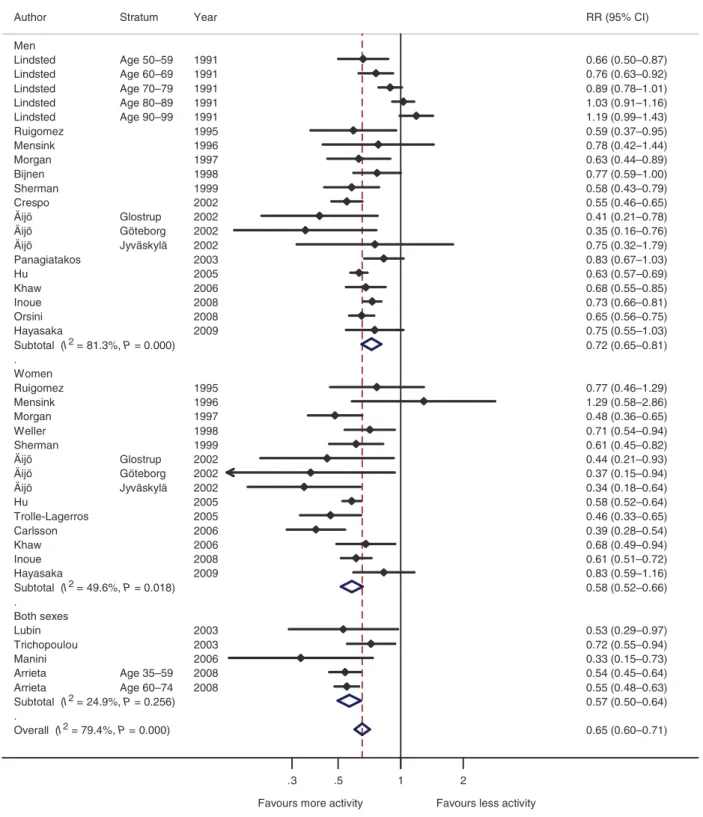
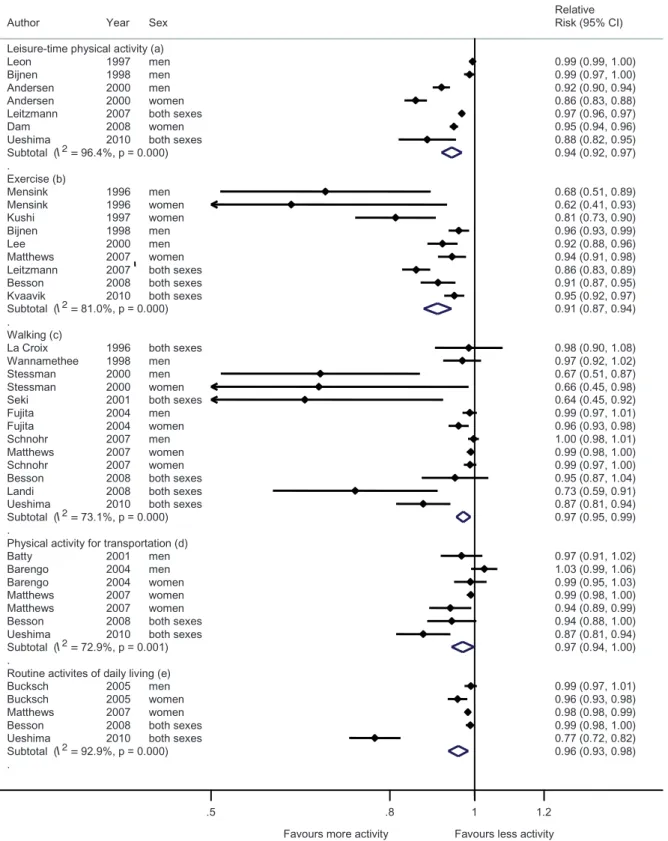
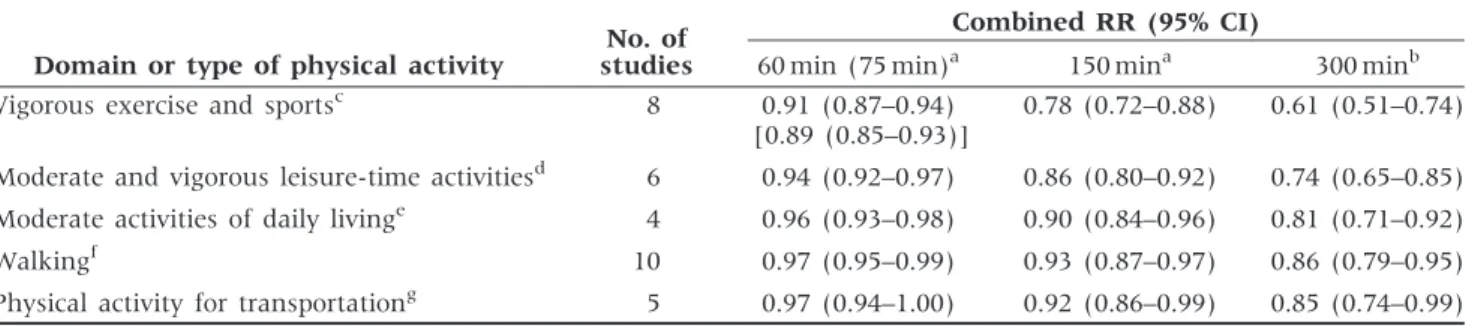
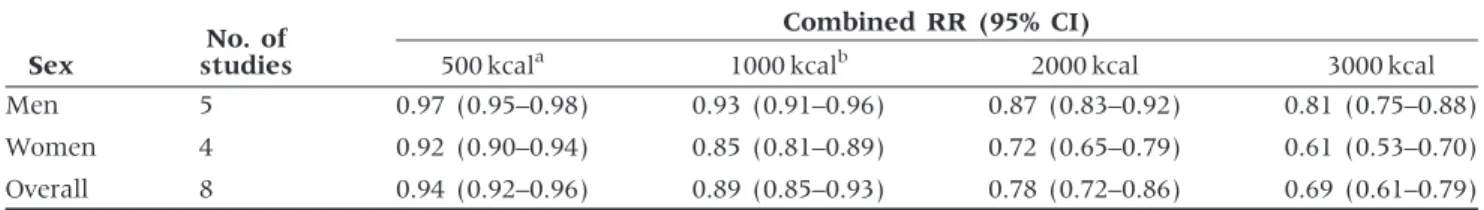
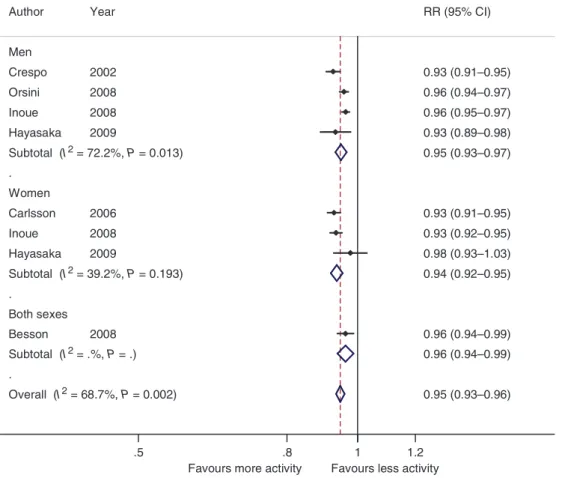
Domains of physical activity and all-cause mortality: systematic review and dose-response meta-analysis of cohort studies
Texte intégral
Figure

Documents relatifs
To examine whether, according to the conclusions of a 2000 systematic review with meta-analysis on interventions to prevent pain from propofol injection that provided a research
Effect of lung recruit- ment maneuver on oxygenation, physiological parameters and mortality in acute respiratory distress syndrome patients: a systematic review
30 Therefore, this systematic review aims to synthesise the qualitative literature on the barriers and facilitators of adults using apps and wearables for monitoring physical
First, a 2012 systematic review and meta-analysis on the effect of exposure to long working hours on cardiovascular disease, which included five cohort studies and six
Health economic evaluations of interventions to increase physical activity and decrease sedentary behavior at the workplace: a systematic review.. by Lutz N, Clarys
First, a 2012 systematic review and meta-analysis on the effect of exposure to long working hours on cardiovascular disease, which included five cohort studies and six
The primary aim of this systematic review is to compare the mortality risk between smokers achieving a sustained reduction of CPD and smokers maintaining their smoking rate..
This systematic review is the first to summarise the literature assessing use of AVGs in school settings and effects on physical activity, motor skills and health outcomes.. Twenty two
