HAL Id: cea-02396316
https://hal-cea.archives-ouvertes.fr/cea-02396316
Submitted on 5 Dec 2019
HAL is a multi-disciplinary open access
archive for the deposit and dissemination of
sci-entific research documents, whether they are
pub-lished or not. The documents may come from
teaching and research institutions in France or
abroad, or from public or private research centers.
L’archive ouverte pluridisciplinaire HAL, est
destinée au dépôt et à la diffusion de documents
scientifiques de niveau recherche, publiés ou non,
émanant des établissements d’enseignement et de
recherche français ou étrangers, des laboratoires
publics ou privés.
Probing fragmentation and velocity sub-structure in the
massive NGC 6334 filament with ALMA
Y. Shimajiri, Ph. André, E. Ntormousi, A. Men’shchikov, D. Arzoumanian, P.
Palmeirim
To cite this version:
Y. Shimajiri, Ph. André, E. Ntormousi, A. Men’shchikov, D. Arzoumanian, et al.. Probing
frag-mentation and velocity sub-structure in the massive NGC 6334 filament with ALMA. Astronomy
and Astrophysics - A&A, EDP Sciences, 2019, 632, pp.A83. �10.1051/0004-6361/201935689�.
�cea-02396316�
Astronomy
&
Astrophysics
https://doi.org/10.1051/0004-6361/201935689© Y. Shimajiri et al. 2019
Probing fragmentation and velocity sub-structure in the massive
NGC 6334 filament with ALMA
?
Y. Shimajiri
1,2,3, Ph. André
1, E. Ntormousi
4,5, A. Men’shchikov
1, D. Arzoumanian
6,7, and P. Palmeirim
7(Affiliations can be found after the references)
Received 12 April 2019 / Accepted 3 October 2019
ABSTRACT
Context. Herschel imaging surveys of galactic interstellar clouds support a paradigm for low-mass star formation in which dense
molecular filaments play a crucial role. The detailed fragmentation properties of star-forming filaments remain poorly understood, however, and the validity of the filament paradigm in the intermediate- to high-mass regime is still unclear.
Aims. Here, following up on an earlier 350 µm dust continuum study with the ArT´eMiS camera on the APEX telescope, we investigate
the detailed density and velocity structure of the main filament in the high-mass star-forming region NGC 6334.
Methods. We conducted ALMA Band 3 observations in the 3.1 mm continuum and of the N2H+(1–0), HC5N(36–35), HNC(1–0), HC3N(10–9), CH3CCH(6–5), and H2CS(3–2) lines at an angular resolution of ∼300, corresponding to 0.025 pc at a distance of 1.7 kpc.
Results. The NGC 6334 filament was detected in both the 3.1 mm continuum and the N2H+, HC3N, HC5N, CH3CCH, and H2CS lines with ALMA. We identified twenty-six compact (<0.03 pc) dense cores at 3.1 mm and five velocity-coherent fiber-like features in N2H+within the main filament. The typical length (∼0.5 pc) of, and velocity difference (∼0.8 km s−1) between, the fiber-like features of the NGC 6334 filament are reminiscent of the properties for the fibers of the low-mass star-forming filament B211/B213 in the Taurus cloud. Only two or three of the five velocity-coherent features are well aligned with the NGC 6334 filament and may represent genuine, fiber sub-structures; the other two features may trace accretion flows onto the main filament. The mass distribution of the ALMA 3.1 mm continuum cores has a peak at ∼10 M , which is an order of magnitude higher than the peak of the prestellar core mass function in nearby, low-mass star-forming clouds. The cores can be divided into seven groups, closely associated with dense clumps seen in the ArT´eMiS 350 µm data. The projected separation between ALMA dense cores (0.03–0.1 pc) and the projected spacing between ArT´eMiS clumps (0.2–0.3 pc) are roughly consistent with the effective Jeans length (0.08 ± 0.03 pc) in the filament and a physical scale of about four times the filament width, respectively, if the inclination angle of the filament to line of sight is ∼30◦. These two distinct separation scales are suggestive of a bimodal fragmentation process in the filament.
Conclusions. Despite being one order of magnitude denser and more massive than the Taurus B211/B213 filament, the NGC 6334
filament has a density and velocity structure that is qualitatively very similar. The main difference is that the dense cores embedded in the NGC 6334 filament appear to be an order of magnitude denser and more massive than the cores in the Taurus filament. This suggests that dense molecular filaments may evolve and fragment in a similar manner in low- and high-mass star-forming regions, and that the filament paradigm may hold in the intermediate-mass (if not high-mass) star formation regime.
Key words. ISM: clouds – ISM: structure – stars: formation
1. Introduction
Herschel imaging observations of galactic molecular clouds reveal an omnipresence of filamentary structures and suggest that filaments dominate the mass budget of the dense molecular gas where stars form (André et al. 2010;Molinari et al. 2010;
Hill et al. 2011;Schisano et al. 2014;Könyves et al. 2015). At least in the nearby clouds of the Gould Belt, detailed studies of the radial column density profiles have found a common inner filament width of ∼0.1 pc, with a dispersion of a factor <∼2, when averaged over the filament crests (Arzoumanian et al. 2011,2019;
Palmeirim et al. 2013;Koch & Rosolowsky 2015). Furthermore, most of the prestellar cores identified with Herschel are found to be embedded within such filamentary structures, showing that dense molecular filaments are the main sites of solar-type star formation (e.g., Könyves et al. 2015, 2019; Marsh et al. 2016). Overall, the Herschel findings in nearby clouds support a filament paradigm for solar-type star formation in two main steps
?The final data used in the paper (FITS) are only available at the CDS via anonymous ftp tocdsarc.u-strasbg.fr(130.79.128.5) or via http://cdsarc.u-strasbg.fr/viz-bin/cat/J/A+A/632/A83
(cf.André et al. 2014,2017;Inutsuka et al. 2015): first, multiple large-scale compressions of interstellar material in supersonic flows generate a pervasive web of ∼0.1-pc wide filaments in the cold interstellar medium (ISM); second, the densest filaments fragment into prestellar cores by gravitational instability near or above the critical mass per unit length of nearly isothermal gas cylinders, Mline,crit=2 c2s/G ∼ 16 M pc−1, where cs∼ 0.2 km s−1
is the isothermal sound speed for molecular gas at T ∼ 10 K. Since molecular filaments are also known to be present in other galaxies (cf.Fukui et al. 2015), this paradigm may poten-tially have implications for star formation on galaxy-wide scales. The star formation efficiency in dense molecular gas is indeed observed to be remarkably uniform over a wide range of scales from pc-scale filaments and clumps to entire galactic disks (Gao & Solomon 2004;Lada et al. 2010,2012;Shimajiri et al. 2017; Zhang et al. 2019), with possible deviations in extreme environments, such as the central molecular zone (Longmore et al. 2013). Assuming that all star-forming filaments have sim-ilar inner widths, as seems to be the case in nearby clouds (Arzoumanian et al. 2019), it is argued that the microphysics of filament fragmentation into prestellar cores may ultimately
A83, page 1 of20
A&A 632, A83 (2019)
be responsible for this quasi-universal star formation efficiency (André et al. 2014;Shimajiri et al. 2017).
The validity and details of the two-step filament paradigm remain controversial, however, especially beyond the Gould Belt and in high-mass star-forming clouds. In particular, an alterna-tive scenario is proposed based on the notion of global hierarchi-cal cloud collapse (e.g.Vázquez-Semadeni et al. 2019), which is especially attractive in the case of high-mass star formation to account for the structure of strongly self-gravitating hub-filament systems, where a massive cluster-forming hub is observed at the center of a converging network of filaments (Myers 2009;Peretto et al. 2013). In this alternative scenario, most if not all fila-ments would be generated by gravitational effects, as opposed to large-scale compression, and would represent accretion flows onto dense hubs.
The evolution and detailed fragmentation manner of star-forming filaments are also poorly understood. In particular, the mere existence of massive, ∼0.1-pc wide, filaments with masses per unit length Mline that exceed the critical line mass1 of an
isothermal filament Mline,crit by one to two orders of
magni-tude is a paradox. Indeed, such filaments may be expected to undergo rapid radial contraction into spindles before any frag-mentation into prestellar cores (cf. Inutsuka & Miyama 1997). A possible solution for this paradox is that massive filaments accrete background cloud material while evolving (cf.Palmeirim et al. 2013; Shimajiri et al. 2019), and that this accretion pro-cess drives magneto-hydrodynamic (MHD) waves, generating sub-structure within dense filaments, and leading to a dynamical equilibrium (Hennebelle & André 2013), where Mlineapproaches
the virial mass per unit length Mline,vir = 2 σ21D/G (Fiege &
Pudritz 2000, where σ1D is the one-dimensional velocity
dis-persion). The detection through molecular line observations of velocity-coherent fiber-like sub-structure within several nearby supercritical filaments (Hacar et al. 2013,2018) may possibly be the manifestation of such a process.
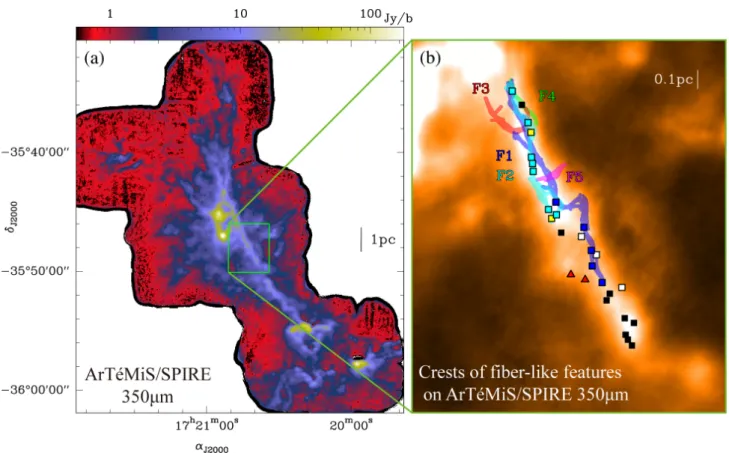
The physical origin of observed fibers is nevertheless still under debate (Tafalla & Hacar 2015;Smith et al. 2014;Clarke et al. 2017,2018), and it is not yet clear whether dense molec-ular filaments in massive star-forming regions have similar characteristics to those observed in nearby clouds. Our recent APEX/ArT´eMiS 350 µm study of the massive star-forming complex NGC 6334 showed that the main filament of the com-plex has an observed line mass of ∼1000 M pc−1, consistent
within uncertainties with the estimated virial mass per unit length ∼500 M pc−1, and an inner width ∼0.15 ± 0.05 pc all
along its length (André et al. 2016), within ∼50% of the typical inner filament width observed with Herschel in nearby clouds (Arzoumanian et al. 2019). NGC 6334 is a very active star-forming region at a distance d ∼ 1.7 kpc, which contains 150 OB stars and more than 2000 young stellar objects (Persi & Tapia 2008; Russeil et al. 2013;Willis et al. 2013; Tigé et al. 2017), for a total gas mass of ∼2.2 × 10⁵ M
. Here, thanks to the high
angular resolution and sensitivity of Atacama Large Millimeter Array (ALMA) data at 3 mm, we investigate the density and velocity sub-structure of the massive NGC 6334 filament and compare the results with those obtained for nearby, lower-mass star-forming filaments.
The paper is organized as follows. In Sect.2, we describe our ALMA observations of NGC 6334 in both the N2H+(1–0),
HC3N(10–9), HC5N(36–35), CH3CCH(60–50), H2CS(31,2–21,1)
1 The critical line mass is Mline,crit=2 c2
s/G, where csis the isothermal sound speed, corresponding to Mline,crit≈ 33 M /pc for a molecular gas temperature T = 20 K.
lines and the 3.1 mm continuum. In Sect. 3, we show the spatial distributions of the detected molecular lines and contin-uum emission. We also analyze the velocity features observed in N2H+(1–0) emission and extract dense structures such as
compact cores and fiber-like components. In Sect. 4, we dis-cuss the evidence of a bimodal fragmentation pattern in the NGC 6334 filament, emphasize the presence of both unusually massive cores and fiber-like velocity-coherent components in the filament, and comment on the possible origin of these multi-ple velocity components. Our conclusions are summarized in Sect.5.
2. ALMA observations of the NGC 6334 filament We carried out ALMA Cycle 3 observations in Band 3 toward NGC 6334 with both the 12 m antennas (C36-2 configuration) and the Atacama Compact Array (ACA) 7 m antennas, as part of project 2015.1.01404.S (PI: Ph. Andr´e). We imaged the main filament in the NGC 6334 region using a 17-pointing mosaic with the 12 m array and a 8-pointing mosaic with the ACA array. The N2H+(1–0) line was observed in narrow-band mode at a
fre-quency resolution of 61.035 kHz, corresponding to ∼0.2 km s−1.
The HC5N (J = 36–35) line was included in the same
narrow-band, high spectral resolution window. The 3.1 mm continuum emission was observed using three wide bands, each covering a bandwidth of 1875.0 MHz. The HNC (1–0), HC3N (10–9),
CH3CCH (60–50), and H2CS (31,2–21,1) lines were included
in these wide bands and observed at a frequency resolution of 31.250 MHz, corresponding to ∼100 km s−1. The 12 m-array
observations were carried out on 23, 24, 26 January 2016 with 42, 46, and 37 antennas, respectively, and projected baseline lengths ranging from 11.7 to 326.8 kλ. The ACA observations were carried out between 16 March 2016 and 8 July 2016 with 7–9 antennas and projected baseline lengths ranging from 4.5 to 48.2 kλ. In the calibration process, we made additional flagging of a few antennas that had too low gain or showed large ampli-tude dispersion in time. The bandpass calibration was achieved by observing the quasar J1617-5848 with the 12 m array and the three quasars J1924-2914, J1517-2422, and J1427-4206 with the ACA array. The complex gain calibration was carried out using the quasar J1713-3418 with the 12 m array and the quasar J1717-3342 with ACA. Absolute flux calibration was achieved by observing two solar system objects (Callisto and Titan) with the 12 m array and planets (Mars and Neptune) with ACA. Cal-ibration and data reduction were performed with the Common Astronomy Software Application (CASA) package (ver-sion 4.5.3 for 12 m data calibration and imaging, ver(ver-sion 4.6.0 for 7 m data calibration). For imaging, we adopted the Briggs weighting scheme with a robust parameter of 0.5, as a good compromise between maximizing angular resolution and sen-sitivity to extended structures. The resulting synthesized beam sizes (∼300, corresponding to 0.025 pc) and rms noise levels for
each line and the continuum are summarized in Table1. With a minimum projected baseline length of 4.5 kλ, our ALMA+ACA observations are estimated to be sensitive to angu-lar scales up to ∼3700 (corresponding to ∼0.3 pc) at the 10%
level (Wilner & Welch 1994). For comparison, we expect the transverse size of any filament sub-structures to be smaller than the ∼0.15 pc inner width of the NGC 6334 filament (André et al. 2016). Likewise with a minimum projected baseline of 11.7 kλ, our 12 m-only observations are sensitive to angular scales up to ∼1400 (corresponding to ∼0.1 pc) at the 10%
Table 1. Parameters for the ALMA observations.
Rest freq. θbeam(PA) rms dV
GHz 00×00(◦) mJy beam−1 km s−1 3.1 mm continuum (12 m + 7 m) – 2.99 × 1.97 (82.6) 0.2 – 3.1 mm continuum (12 m) – 2.80 × 1.84 (83.4) 0.14 – HNC (1–0, Eu= 4.35 K) 90.663572 3.82 × 2.48 (85.9) 0.3 60 HC3N (10–9, Eu= 24.015 K) 90.978989 3.81 × 2.47 (85.9) 0.27 60 N2H+(1–0, Eu= 4.472 K) 93.176265 3.78 × 2.40 (84.1) 4.4 0.2 HC5N (36–35, Eu= 80.504 K) 93.188126 3.77 × 2.39 (84.1) 5.4 0.2 CH3CCH (60–50, Eu= 17.225 K) 102.54798 3.75 × 2.36 (79.1) 0.36 60 H2CS (31,2-21,1, Eu= 23.213 K) 104.61699 3.40 × 2.17 (84.3) 0.22 60
are at most ∼0.1 pc (Könyves et al. 2015). Moreover, simu-lations of ALMA observations performed with CASA, using the same set of baselines as the real ALMA+ACA data, show that interferometric-filtering effects do not generate spurious sub-structures within the filament (see Fig.A.1).
3. Results and analysis
In this section, we show the results of our ALMA 3.1 mm con-tinuum and N2H+(1–0) line observations, and then extract
com-pact 3.1 mm continuum sources and fiber-like velocity-coherent structures from the ALMA data.
3.1. 3.1 mm continuum emission
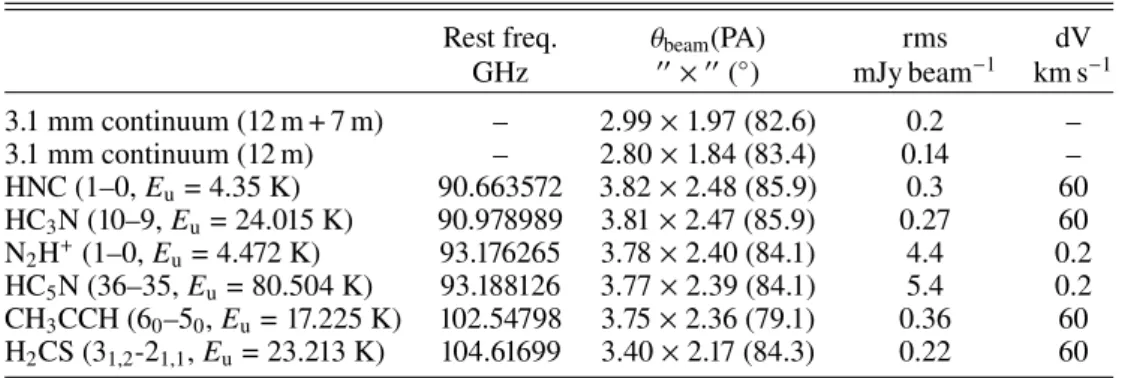
Our ALMA 3.1 mm continuum map of the NGC 6334 filament region is shown in panel a of Fig.1(color scale and contours). It is also overlaid as contours on a Spitzer 8 µm emission map in panel d of Fig.1. Hereafter, we call the map resulting from the combination of APEX/ArT´eMiS 350 µm (André et al. 2016) and Herschel/SPIRE 350 µm (Russeil et al. 2013) data the ArT´eMiS 350 µm map. The counterpart of the dense filament seen in the ArT´eMiS 350 µm map can be recognized in the northern part of the ALMA 3.1 mm continuum map. In the southern part of the field, the filament is not clearly detected in the ALMA 3.1 mm continuum map, but a shell-like structure can be seen. Conversely, the shell-like structure is not seen in the ArT´eMiS 350 µm map. A compact HII region associated with a 4.9 GHz radio continuum source labeled source D in Rodriguez et al.
(1982) lies close to the contours of this shell-like structure. The shell-like structure in the ALMA 3.1 mm continuum map also coincides with bright, extended mid-infrared emission detected at 8 µm with Spitzer as shown in Fig.1d. We conclude that the 3.1 mm continuum emission in the shell-like structure is most likely dominated by free–free emission from the compact HII region around the luminous embedded star associated with source D.
3.2. Molecular lines
3.2.1. Spatial distribution of the N2H+(1–0) emission
Figure1b shows the integrated intensity map of the N2H+(1–0)
line emission around the NGC 6334 main filament. It can be seen that the prominent dusty filament in the ArT´eMiS 350 µm map (Fig.1c) is very well traced by the ALMA N2H+(1–0) data. In
addition, a few N2H+blobs can be recognized outside the main
filament.
3.2.2. Spatial distributions of other molecular line tracers The ALMA maps obtained in all other molecular line trac-ers, except HNC(1–0), also show the NGC 6334 filament (see Fig. A.2a–e). The map obtained in HNC(1–0) differs from the other maps in that it shows a rather scattered distribution of discrete blobs. Due to a lower effective excitation density (cf. Shirley 2015), the emission from the HNC(1–0) transition may be more extended than the emission in the other dense gas tracers observed here and may be resolved out due to interfer-ometric filtering effects, even with ACA. The maps obtained in CH3CCH(60–50), H2CS(31,2–21,1), HC3N(10–9), and HC5N(36–
35) emission appear to trace the same filamentary structure as detected in N2H+(1–0). The HC5N(36–35) line has a high
upper state energy of 80.504 K, implying that some of the gas in the main filament has a high temperature and/or den-sity. Indeed,André et al. (2016) estimated the average column density and average volume density of the entire NGC 6334 filament to be 1–2 × 10²³ and 2.2 × 105 cm−3, respectively.
This exceeds the (column) density values observed byPalmeirim et al.(2013) for the low-mass star-forming filament B211/B213 in Taurus (∼1.4 × 1022cm−2and 4.5 × 104cm−3) by an order of
magnitude.
3.2.3. Observed line profiles
The N2H+(1–0) and HC5N(36–35) line observations were
obtained in narrow-band mode with a velocity resolution of 0.2 km s−1, which allows us to investigate the velocity structure
of the NGC 6334 filament.
Here, we discuss the velocity profiles obtained in N2H+(1–0)
and HC5N(36–35).
Figure 2 shows the N2H+(1–0) and HC5N(36–35)
spec-tra averaged over the pixels where significant emission was detected above the 5σ level. Two peaks at Vsys= −2.6 and
Vsys= −1.0 km s−1can be recognized in the HC5N(36–35)
spec-trum. We set the velocity scale of the N2H+ (1–0) spectrum
using the rest frequency of the isolated component of the N2H+
(v = 0, J = 1–0, F1= 0–1, F = 1–2, 93.176265 GHz) hyperfine
structure (HFS) multiplet as a reference. Hereafter, we call this isolated N2H+ component “HFS 1” and the other components
“HFS 2-7” (see Fig.2). The peak velocity of HFS 1 (approxi-mately −2.6 km s−1) is consistent with the peak velocity of the
HC5N(36–35) emission. In addition, the N2H+HFS 1 line
pro-file exhibits an emission wing at highly blueshifted velocities (up to −12 km s−1, see Fig.2). This blueshifted emission does not
appear to be associated with the NGC 6334 filament itself since it is mainly detected outside the main filamentary structure (see
A&A 632, A83 (2019)
Fig. 1.Maps of the NGC 6334 main filament region in 3.1 mm continuum emission with ALMA 12 m (panel a), N2H+(1–0) integrated intensity with ALMA 12 m+7 m (panel b), 350 µm dust continuum emission with ArT´eMiS (panel c, fromAndré et al. 2016), and 8 µm dust continuum emission with Spitzer (panel d). In panel a, the magenta filled circle indicates the position of a radio continuum compact HII region (source D in
Rodriguez et al. 1982), and green open circles indicate the positions of the compact 3.1 mm continuum sources identified with getsources (see Sect.3.3.1). In panel a, the solid white contour marks the footprint of the main filament, defined as the intersection of the area within ±3000from the filament crest and the interior of the 5 Jy beam−1 contour in the ArT´eMiS 350 µm map. In panels a and d, contours of 3.1 mm continuum emission are overlaid with levels of 2, 4, 6, 8, 10, 15, 20, 25, 30, 35, and 40σ, where 1σ = 0.2 mJy/ALMA-beam. In panel b, the N2H+intensity was integrated over the velocity range from −11.4 km s−1to +16.8 km s−1, including all hyperfine components. In panel c, contours of 350 µm dust continuum emission are shown with levels of 10, 12, 14, 16, 18, and 20 Jy/800-beam, and dashed ellipses indicate the positions of the ArT´eMiS dense clumps identified with GAUSSCLUMPS (see Sect.4.1). In all panels, the crest of the NGC 6334 main filament as traced with the DisPerSE algorithm in the ArT´eMiS 350 µm map (André et al. 2016) is shown as a solid curve.
Fig.E.1). At positions where the blueshifted emission between −12 to −6 km s−1overlaps with the main velocity component at
∼−2.6 km s−1in the plane of the sky, the HFS 2–7 counterparts
of the blueshifted emission can be confused with HFS 1 emission from the −2.6 km s−1component since the velocity offsets of the
HFS 2–7 components range from 7.3 to 14.9 km s−1with respect
to the velocity of HFS 1 (see AppendixB).
3.3. Extraction of compact continuum sources and “fiber-like” velocity structure from the data
To extract compact continuum sources from the ALMA/ACA 3.1 mm continuum map and fiber-like velocity-coherent features
from the ALMA/ACA N2H+(1–0) data cube, we made use of
the getsources, getfilaments, and getimages algorithms (Men’shchikov et al. 2012; Men’shchikov 2013, 2017, and in prep.).
3.3.1. Compact source extraction from the ALMA 3.1 mm continuum data with getsources
To identify compact sources in the ALMA 3.1 mm continuum map, we applied the getsources algorithm (e.g.,Men’shchikov et al. 2012). getsources is a multi-scale source extraction algo-rithm primarily developed for the exploitation of multi-wave-length far-infrared and submillimeter continuum data resulting
Fig. 2.N2H+(1–0) (black) and HC5N(36–35) (gray) spectra averaged over pixels where the emission was detected above 5 σ. The red curve shows a two-component Gaussian fit to the HC5N line profile. The blue circles indicate the peak velocity positions of each N2H+(1–0) HFS component expected from the HC5N(36–35) systemic velocity of −2.6 km s−1. The vertical dashed lines mark the peaks of the two HC5N velocity components.
from Herschel surveys of Galactic star-forming regions (see
Könyves et al. 2015), but can also be used with single-band con-tinuum data and spectral line data. Source extraction with this algorithm has only one free parameter, namely the maximum size of the structures to be extracted from the images. Here, we adopted a maximum size of 1500(or ∼0.12 pc), which is
compa-rable to the transverse full width at half maximum (FWHM) size of the filament as measured with ArTéMiS (André et al. 2016).
After running getsources on the 12 m-only data2 and applying post-extraction selection criteria (see AppendixC), we identified a total of 40 candidate compact 3.1 mm continuum sources. As shown in Fig.1a, 28 of these 40 sources are located within the main filament defined as the intersection of the area within ±3000 (or ±0.25 pc) from the filament crest and the area
enclosed within the 5 Jy beam−1 contour in the ArT´eMiS 350
µm map (see also Fig.3and Table2). Two of these 28 sources (IDs 15, 18 in Table2) are probably affected by contamination from free–free emission as mentioned in Sect. 3.1. The posi-tions and sizes of all of these 40 compact continuum sources are summarized in Table2, along with their basic properties.
To investigate whether the compact continuum sources identified above are associated with N2H+ emission, we also
applied getsources to each N2H+ velocity channel map (see
Appendix Cfor details). We found that 23 of the 40 compact continuum sources are associated with N2H+emission in at least
two consecutive channels. In addition, five of the 40 compact sources (IDs 3, 7, 13, 33, 35 in Table2) are associated with N2H+
(1–0) line emission in only one channel, but these sources did not pass our post-extraction selection criteria (see AppendixC). Although contamination of the 3.1 mm continuum data by free– free emission is an issue, compact sources robustly detected in both 3.1 mm continuum and N2H+ emission are unlikely to be
affected.
We estimated the mass (Mtot) of each compact continuum
source, under the assumption that all of the 3.1 mm continuum emission arises from dust and that the emission is optically thin.
2 We used the 12 m-only instead of the 12 m+7 m image as the sensi-tivity of the data is better for the detection of compact (<0.1 pc) sources (cf. Table2).
The mass was obtained from the integrated 3.1 mm flux den-sity Stot
3.1 mmderived from two-dimensional Gaussian fitting in the
12 m+7 m continuum image3using the formula: Mtot=
Stot 3.1 mmd2
κ3.1 mmB3.1 mm(Td), (1)
where d, κ3.1 mm, and B3.1 mm(Td) are the distance to the target,
the dust opacity (per unit mass of gas + dust), and the Planck function at dust temperature Td, respectively. We adopted the
same dust opacity law as the Herschel Gould Belt survey team, namely κλ= 0.1 (λ/300 µm)−βcm2g−1(cf.Hildebrand 1983;Roy
et al. 2014) with β = 2 and here λ = 3.1 mm. If β = 1.5 instead of β =2, the core masses would be a factor of ∼3 lower than the val-ues listed in Table2. For most sources, we adopted Tdust = 20 K
which corresponds to the median dust temperature derived from Herschel data along the crest of the filament (André et al. 2016;
Tigé et al. 2017). For source ID 1, we adopted a higher temper-ature value (Tdust= 50 K) as this object coincides with a bright
Spitzer 8 µm source and is most likely an internally-heated, rel-atively massive protostellar core. The 5σ mass sensitivity of the ALMA 12 m continuum data for compact sources is ∼2.0 M ,
corresponding to Stot
3.1 mm =0.7 mJy, assuming β = 2 and Tdust=
20 K. The average gas density (≡ nH2) of each source was then derived assuming spheroidal cores as follows:
nH2=
Mtot 4
3π[ pRmajorRminor]3
, (2)
where Rmajor and Rminorare the deconvolved FWHM sizes along
the major and minor axis of the source, respectively (cf.Könyves et al. 2015). The median mass of the 26 compact contin-uum sources embedded in the main filament4 is 9.6+3.0
−1.9 M
(lower quartile: 7.7 M , upper quartile: 12.6 M ) and their
median volume-averaged density 1.6 × 107cm−3(lower quartile:
1.0 × 107cm−3, upper quartile: 2.2 × 107cm−3). The 26
contin-uum sources embedded in the main filament are compact (with an estimated typical outer radius ∼5000 au) and have a very high volume-averaged density (∼107 cm−3), suggesting that they are
on their way to form stars. Moreover, their spatial distribution closely follows that of the ArT´eMiS 350 µm emission clumps (see Fig.3and Sect.4.1). In the following, we therefore regard these 26 compact 3.1 mm continuum sources as dense cores. 3.3.2. Extraction of fiber-like structures from the N2H+data
cube with getfilaments
Removal of unrelated velocity components. In the NGC 6334 region, we found evidence of the presence of sev-eral velocity components along the line of sight (see Sect.3.2.3). To avoid contamination of the N2H+(1–0) HFS 1 line
emis-sion from the main velocity component at Vsys= −2.6 km s−1
by the HFS 2–7 emission from other velocity components, we
3 We used the 12 m+7 m data to estimate the integrated flux densities and masses of the sources detected in the 12 m-only continuum map, in order to avoid missing-flux problems due to interferometric filtering of large scales as much as possible. For four weak unresolved sources, undetected above the 3σ level in the 12 m+7 m map, the 12 m-only data were used instead (cf. Table2).
4 The median mass of all 40 compact continuum sources is 9.4+3.4
−1.9 M (lower quartile: 7.5 M , upper quartile: 12.8 M ) and the median volume-averaged density 1.4 × 107 cm−3 (lower quartile: 0.8 × 107cm−3, upper quartile: 2.0 × 107cm−3).
A&A 632, A83 (2019)
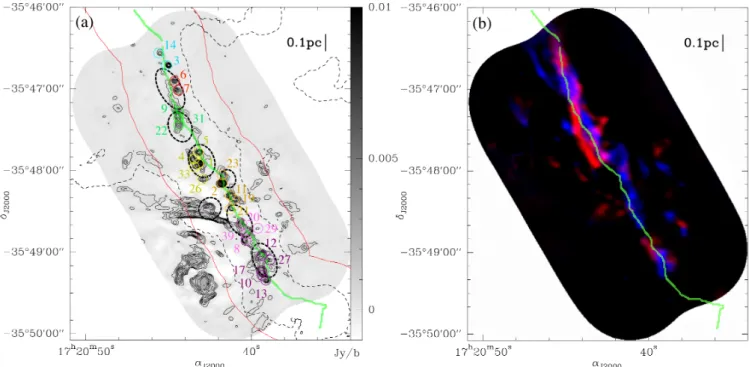
Fig. 3. Panel a: spatial distribution of the 26 ALMA compact cores (magenta, pink, orange, yellow, green, red, green, and light blue circles) and 7 ArT´eMiS clumps (larger black dashed ellipses – see Sect.4.1) embedded in the NGC 6334 main filament, overlaid on the ALMA 3.1 mm continuum image (grayscale and same solid contours as in Fig.1). The black dashed contour shows an ArT´eMiS 350 µm continuum emission level of 5 Jy/800-beam. The green curve marks the crest of the dusty filament traced with DisPerSE in the ArT´eMiS 350 µm continuum map (André et al.
2016, see Fig.1c). The red curves mark the area within ±3000(or ±0.25 pc) from this filament crest. Panel b: spatial distribution of the N2H+(1–0) velocity-coherent fiber-like sub-structures F-1 (blue, integrated over the velocity range −3 to −2.4 km s−1) and F-2 (red, integrated over the velocity range −2.0 to −1.2 km s−1) in the NGC 6334 filament. In panel a, the seven groups of ALMA 3.1 mm compact sources found by the nearest neighbor separation algorithm (see Sect.4.1and Fig.8) are indicated by small circles of different colors. The green curve is the same as in panel a.
fit the N2H+ emission observed at each pixel with a
multiple-velocity-component HFS model and subtracted the correspond-ing HFS 2–7 emission from the data cube. As shown in Fig.B.1, if the velocity width of each component is ∼1.0 km s−1, then the
N2H+HFS 1 emission of the main component can be
contami-nated by the HFS 2–7 emission of a more blue-shifted velocity component when the velocity difference between the two compo-nents along the line of sight is ∼5.0–7.0 km s−1. FigureB.2shows
four examples of N2H+(1–0) spectra obtained after subtraction
of contaminating components. Hereafter, we use the subtracted data cube in our scientific analysis.
Extraction of velocity-coherent fiber-like features with getfilaments. We extracted filamentary structures from the ALMA N2H+ data cube after subtraction of compact
N2H+ emission using the getfilaments algorithm (e.g.,
Men’shchikov 2013). Each N2H+ velocity channel map was
decomposed into a set of spatially-filtered single-scale images from small (300) to large (1600) scales. At each scale, the
algo-rithm separated filamentary structures and compact sources, and extracted significant filamentary structures in the source-subtracted image component. All extracted filamentary struc-tures were merged into a single image per velocity channel map. We selected only filamentary structures whose >90% pix-els along the crest were detected above the >3σ level in each channel. As the velocity resolution of our ALMA N2H+ data
(0.2 km s−1, that is, less than the isothermal sound speed in the
cloud) should be sufficient to resolve the velocity width of the filament, we also imposed that a selected filamentary structure should be detected in at least two consecutive velocity channels. By comparing velocity-channel maps, we therefore associated
filamentary structures with matching spatial distributions among channels (see AppendixD). Our procedure is similar to that used by Hacar et al. (2013) to trace velocity-coherent structures in data cubes, in the sense that both methods work in position– position–velocity (PPV) space5. In this way, we identified five distinct fiber-like structures, labeled F-1 to F-5, whose crests are displayed in Figs.4and5. Examples of individual N2H+(HFS
1) spectra across the two main fiber-like structures 1 and F-2 are shown in Fig.6. The spatial distribution of the structure labeled F-2 partly overlaps with the distribution of F-1 at −2.4 km s−1. But the northern portion of F-2 lies slightly to the west
of F-1, while the southern part of F-2 lies to the east of F-1 (see, e.g., Fig.4b). Moreover, at positions where F-1 and F-2 overlap in the plane of the sky, the N2H+spectra clearly exhibit distinct
velocity components (see, e.g., positions (c) and (d) in Fig.6). Therefore, F-1 and F-2 seem to be distinct velocity-coherent fea-tures. The five fiber-like structures are likely associated with the dust continuum filament seen in the ArT´eMiS 350 µm map. Similar sub-filamentary structures have been found in the low-mass star-forming filament B211/B213 in Taurus (Hacar et al. 2013) and have been called fibers in the literature (cf.Tafalla & Hacar 2015). At this point, we refer to the five features F-1– F-5 as fiber-like structures. (In Sect 4.3 below, we argue that only two of them, F-1 and F-2, may be genuine fibers, that is velocity-coherent sub-structures of the main filament itself.)
5 As only a small (≥5) number of velocity-coherent features appeared to be present in our N2H+ data cube (see Table 3) and we had no experience with the FIVE method developed by Hacar et al.
(2013), we preferred to follow a procedure based on channel-by-channel getfilamentsextractions and careful visual inspection of the data cube (see AppendixD).
Table 2. Results of compact source extractions on the ALMA 12 m-only 3.1 mm continuum map.
ID(1) RA Dec Rmajor× Rminor PA Speak
3.1mm S /N Stot3.1 mm Mtot nH2 Velocity channel at which Association with
source is detected in N2H+ N2H+features
[hms] [dms] [00×00](2), (3) [deg](2) [mJy/beam](2) [σ] [mJy](2) [M ](4) [×106cm−3](5) [km s−1]
1 17:20:43.13 −35:47:54.9 2.9 × 2.3 (0.02 pc × 0.02 pc) 1 5.1 ± 0.2 36.4 11.4 31.5 11.1 [−2.2, −1.8] F-2 2 17:20:41.78 −35:48:9.2 2.8 × 1.7 (0.02 pc × 0.01 pc) 10 6.9 ± 0.2 49.2 13.5 13.8 8.1 No N2H+ 3 17:20:45.00 −35:46:42.7 1.7 × 0.8 (0.01 pc × 0.01 pc) −33 2.9 ± 0.2 21.0 4.1 11.2 42.5 −1.2(6) 4 17:20:43.56 −35:47:51.4 2.2 × 1.1 (0.02 pc × 0.01 pc) 36 3.0 ± 0.2 21.4 4.7 12.8 22.6 [−1.4, −1.2] F-2 5 17:20:43.16 −35:47:46.6 1.2 × 0.8 (0.01 pc × 0.01 pc) −8 2.5 ± 0.2 18.2 3.2 8.9 54.3 [−2.6, −2.4],[−2.0, −1.8] F-1 6 17:20:44.66 −35:46:54.3 1.7 × 1.3 (0.01 pc × 0.01 pc) 6 2.4 ± 0.2 17.0 3.5 9.6 19.1 [−3.0, −2.8],[−1.8],[−1.4, −1.2] F-2 7 17:20:44.51 −35:47:0.8 2.0 × 1.1 (0.02 pc × 0.01 pc) −32 2.4 ± 0.2 17.3 3.7 10.1 19.1 −3.8, −2.8(6) F-1(marginal)/F-3(marginal) 8 17:20:40.42 −35:48:51.1 1.9 × 1.4 (0.02 pc × 0.01 pc) −22 3.0 ± 0.2 21.5 4.7 12.9 18.5 [−2.6, −1.4] 9 17:20:44.48 −35:47:17.1 1.9 × 1.5 (0.02 pc × 0.01 pc) 40 2.7 ± 0.2 19.4 4.3 11.9 14.7 [−2.8, −2.6],[−1.8, −1.2] F-2 10 17:20:39.27 −35:49:16.9 2.1 × 0.9 (0.02 pc × 0.01 pc) 35 3.3 ± 0.2 23.8 5.0 13.7 35.1 [−3.8, −3.0] F-1 11 17:20:41.25 −35:48:18.3 1.5 × 1.0 (0.01 pc × 0.01 pc) −39 2.3 ± 0.2 16.6 3.2 8.7 28.4 [−3.6, −2.6] 12 17:20:39.44 −35:49:2.8 2.4 × 1.4 (0.02 pc × 0.01 pc) −42 3.5 ± 0.2 24.8 6.0 16.6 15.8 [−3.8, −2.4] 13 17:20:39.05 −35:49:20.7 2.4 × 0.9 (0.02 pc × 0.01 pc) 19 1.8 ± 0.2 13.1 2.9 8.1 15.3 −3.8(6) 14 17:20:45.52 −35:46:33.6 1.7 × 1.5 (0.01 pc × 0.01 pc) −28 1.7 ± 0.2 12.1 2.6 7.1 10.7 [−3.2, −2.8],[−2.2, −2.0], −1.2 F-2 15(7) 17:20:41.58 −35:48:37.5 1.5 × 1.0 (0.01 pc × 0.01 pc) −23 2.6 ± 0.2 18.3 2.1 7.0 24.4 No N2H+/free−free contamination
16 17:20:43.38 −35:48:47.0 2.3 × 0.9 (0.02 pc × 0.01 pc) −32 4.5 ± 0.2 32.3 7.1 19.6 37.8 No N2H+/Out of main filament
17 17:20:39.39 −35:49:13.7 2.1 × 1.7 (0.02 pc × 0.01 pc) 6 3.9 ± 0.2 28.1 6.6 18.2 17.7 [−3.8, −2.8] 18 17:20:42.35 −35:48:34.2 2.0 × 1.7 (0.02 pc × 0.01 pc) −39 4.8 ± 0.2 34.5 8.1 22.3 21.9 −3.4,[−1.6, −1.4] free−free contamination 19(7) 17:20:40.97 −35:48:21.2 1.5 × 1.0 (0.01 pc × 0.01 pc) −19 2.0 ± 0.2 13.9 1.8 5.4 18.6 No N2H+ 20 17:20:40.66 −35:48:39.4 1.3 × 1.0 (0.01 pc × 0.01 pc) 44 2.1 ± 0.2 15.0 2.8 7.6 31.0 [−3.4, −2.6] F-1 21(7), (2) 17:20:41.20 −35:48:28.5 1.4 × 0.9 (0.01 pc × 0.01 pc) −33 1.1 ± 0.1 8.1 1.4 3.1 13.4 [−2.4, −1.2] F-1 22 17:20:44.39 −35:47:26.4 2.1 × 1.6 (0.02 pc × 0.01 pc) −2 2.2 ± 0.2 16.0 3.7 10.2 10.7 [−3.8, −3.2], [−1.8, −1.2] F-2 23 17:20:41.65 −35:48:3.1 3.0 × 1.3 (0.02 pc × 0.01 pc) 44 1.7 ± 0.2 12.2 3.2 8.9 7.0 [−3.4, −2.4] F-1 24 17:20:47.61 −35:47:53.7 1.6 × 1.5 (0.01 pc × 0.01 pc) 31 1.2 ± 0.2 8.3 1.7 4.8 8.1 [−3.4, −3.2], −2.0, −1.2 Out of main filament 25 17:20:42.87 −35:49:36.0 1.9 × 0.8 (0.02 pc × 0.01 pc) 34 1.9 ± 0.2 13.7 2.8 7.6 23.9 No N2H+/Out of main filament
26 17:20:42.87 −35:48:6.6 2.0 × 0.2 (0.02 pc × 0.00 pc) 28 1.5 ± 0.2 10.5 2.0 5.6 141.9 [−1.4, −1.2] F-2 27 17:20:38.94 −35:49:5.9 2.1 × 1.0 (0.02 pc × 0.01 pc) −19 1.9 ± 0.2 13.6 2.9 7.9 17.0 [−2.2, −1.6]
28 17:20:41.88 −35:49:1.6 3.4 × 0.9 (0.03 pc × 0.01 pc) −41 2.2 ± 0.2 16.0 4.3 11.9 14.4 No N2H+/Out of main filament
29(7), (2) 17:20:39.59 −35:48:42.6 1.4 × 0.9 (0.01 pc × 0.01 pc) 15 0.6 ± 0.1 4.5 0.3 1.7 7.4 No N2H+
30 17:20:42.35 −35:49:31.8 1.7 × 1.7 (0.01 pc × 0.01 pc) 1 2.7 ± 0.2 19.1 4.2 11.6 14.6 No N2H+/Out of main filament
31 17:20:44.42 −35:47:21.2 2.2 × 1.5 (0.02 pc × 0.01 pc) 22 2.1 ± 0.2 15.2 3.5 9.7 10.7 −3.8, [−2.0, −1.8] F-2 32(7), (2) 17:20:44.26 −35:49:14.1 1.4 × 0.9 (0.01 pc × 0.01 pc) 39 3.3 ± 0.1 23.4 1.1 9.0 38.5 No N2H+/Out of main filament
33(7) 17:20:43.39 −35:47:57.3 1.5 × 1.0 (0.01 pc × 0.01 pc) 42 2.3 ± 0.2 16.4 0.7 6.3 21.9 −1.8(6) F-2(marginal)
34 17:20:39.27 −35:47:59.3 2.3 × 1.3 (0.02 pc × 0.01 pc) 34 2.0 ± 0.2 14.4 3.4 9.2 10.7 [−3.8, −3.4], [−2.8, −2.6] Out of main filament 35(7), (2) 17:20:38.34 −35:48:32.4 1.4 × 0.9 (0.01 pc × 0.01 pc) 15 0.9 ± 0.1 6.7 1.2 2.6 11.0 −2.2(6) Out of main filament
36 17:20:42.92 −35:49:24.7 2.1 × 1.9 (0.02 pc × 0.02 pc) −19 3.8 ± 0.2 27.0 6.7 18.5 14.1 No N2H+/Out of main filament
37 17:20:36.73 −35:48:56.6 1.9 × 1.4 (0.02 pc × 0.01 pc) 38 1.4 ± 0.2 9.9 2.2 6.0 8.4 No N2H+/Out of main filament
38 17:20:43.44 −35:49:6.4 2.2 × 1.8 (0.02 pc × 0.01 pc) −4 1.8 ± 0.2 12.9 3.1 8.7 7.2 No N2H+/Out of main filament
39 17:20:40.25 −35:48:46.7 2.5 × 1.5 (0.02 pc × 0.01 pc) −36 2.3 ± 0.2 16.4 4.0 11.1 10.0 [−2.6, −2.2]
40 17:20:42.82 −35:49:20.4 2.0 × 1.9 (0.02 pc × 0.02 pc) 0 3.4 ± 0.2 24.4 5.9 16.3 13.8 No N2H+/Out of main filament
Notes.(1)ID numbers of 3.1 mm compact sources associated with N2H+emission in two or more contiguous channels are labeled in bold.(2)Results of the 2D Gaussian fitting on the 12 m+7 m map. For IDs 21, 29, 32, 35, the 12 m map was used since the 3.1 mm continuum emission is not detected with a >3σ on the 12m+7m map. (3)Deconvolved FWHM source diameters along the major and minor axes.(4)We adopted Tdust= 20 K for all sources, except for source ID 2 for which we assumed Tdust= 50 K (see Sect.3.3.1).(5)Volume-averaged gas density derived assuming spheroidal cores as in Eq. (2).(6)Marginal N2H+detection since it is detected in only one channel for this source.(7)Deconvolved source size are not obtained since the structure is not resolved. The peak flux was used to estimate the mass.
Their typical length is 0.5 ± 0.4 pc (see Table3, which also gives their velocity ranges).
A portion of the dusty filament seen in the ArT´eMiS 350 µm continuum map was not traced by getfilaments in the N2H+data, especially in the southern part of the field in Fig.1
although the filament can be recognized by eye in the N2H+(1–0)
integrated intensity map (Fig.1b). The reason why this southern portion was not traced in the N2H+velocity channel maps with
getfilamentsis that the N2H+emission becomes very clumpy
in this area and was subtracted out as a collection of point-like sources by getsources before identification of filamentary structures.
F-1 is the longest and F-2 the second longest of the five extracted velocity features. Both of these fiber-like structures are roughly parallel to the dust continuum filament seen in the ArT´eMiS 350 µm map. In contrast, the crest of F-5 is roughly perpendicular to the dust filament. In the northern part of the
N2H+map (north of −35◦4701000 in Figs.4 and 7a), the
spa-tial distributions of F-1, F-2, F-4 partly overlap in the plane of sky. The three features F-1, F-2, F-4 are nevertheless sepa-rated from each other in velocity space (see Table3). The crests of F-1, F-2, F-4 are also slightly shifted from one another by typically one ALMA beam (∼300, see Fig.7a). In the northern
part, they are distributed in the sequence F-1, F-2, F-4 from east to west (see Fig.7a). In contrast, the projected LSR velocities are in the order F-4 (∼−3.3 km s−1), F-1 (∼ −2.8 km s−1), F-2
(∼ −1.7 km s−1). Assuming F-1, F-2, F-4 are part of the same
filament, this different ordering between the spatial and velocity distributions cannot be explained by a simple transverse velocity gradient across the parent filament due to either accretion onto and/or rotation of the filament. In the southern part of the field (south of −35◦4701000 in Figs. 4 and 7b), F-4 is not detected
and F-1, F-2 are distributed in the order F-2, F-1 from east to west (see Fig.7b). These opposite spatial configurations for F-1,
A&A 632, A83 (2019)
Fig. 4.Panel a: ArT´eMiS 350 µm dust continuum map of the NGC 6334 region (André et al. 2016) and panel b: blow-up of the field imaged here with ALMA, with the skeleton of the velocity-coherent fiber-like structures identified in the N2H+data cube overlaid as colored curves (see Sect.3.3.2and Table3). In panel b, dark blue squares mark 3.1 mm compact sources associated with N2H+emission and embedded in F-1, light blue squares 3.1 mm sources associated with N2H+emission and embedded in F-2, yellow squares 3.1 mm sources embedded in F-1, F-2, or F-3 and marginally detected in only one N2H+channel, black squares 3.1 mm sources associated with N2H+emission in the main filament but not embedded in any N2H+velocity-coherent structure, and white squares 3.1 mm sources in the main filament not associated with any N2H+emission. The red triangles indicate 3.1 mm compact sources possibly contaminated by free–free emission.
Fig. 5. N2H+(1–0) position–position– velocity plot of the NGC 6334 filament system. Colored curves indicate the crests of the N2H+ velocity-coherent structures iden-tified with getfilaments, after applying the post-extraction selection criteria described in Sect.3.3.2, and using the same color coding as in Fig.4b.
F-2 between the northern and the southern part of the dust fila-ment are suggestive of an intertwined, double helix-like pattern (DNA-like) (see Fig.3b).
We also extracted filamentary structures from the ALMA HC3N, HC5N, CH3CCH, and H2CS integrated intensity maps
using getfilaments. We detected one filamentary structure in HC3N, one filamentary structure in HC5N, one filamentary
structure in CH3CCH, and two filamentary structures in H2CS.
These filamentary structures roughly correspond to the F-1 and/or F-2 “fiber-like” features identified in N2H+. Due to
the lower effective sensitivity of the H2CS(31,2–21,1) data, the
NGC 6334 filament is broken up into two segments in H2CS.
The H2CS filamentary structures coincide with the northern and
Fig. 6. Four examples of spectra showing the isolated component of the N2H+(1–0) multiplet (HFS 1) in the original data cube (i.e. before subtracting unrelated velocity components). The positions of these spectra are indicated at the top-left corner of each panel. The central panel is the N2H+(1–0) intensity map (integrated from −11.4 km s−1to +16.8 km s−1– cf. Fig.1b). The red filled circles in the central panel also mark the positions of the four spectra. Colored horizontal segments indicate the velocity ranges of the various fiber-like structures (see Table3).
Table 3. N2H+“fiber-like” structures identified with getfilaments.
ID Length Velocity range
F-1 1.21 pc [−3.4, −2.2 km s−1]
F-2 0.72 pc [−2.2, −1.2 km s−1]
F-3 0.33 pc [−3.6, −2.4 km s−1]
F-4 0.26 pc [−3.4, −3.2 km s−1]
F-5 0.17 pc [−2.2, −1.6 km s−1]
Owing to the lower line intensities and/or lower spectral resolu-tion of our data in HC3N, HC5N, CH3CCH, and H2CS, we could
not carry out as detailed a PPV analysis in these lines as in N2H+.
4. Discussion
Our ALMA study has revealed, for the first time, the presence of density and velocity sub-structure in the NGC 6334 filament. We discuss the two types of sub-structure in turn in the following. 4.1. Bimodal fragmentation in the NGC 6334 filament
While it was not clear whether dense cores were embedded in the NGC 6334 filament based only on the ArT´eMiS 350 µm data (André et al. 2016), our ALMA 3.1 mm continuum map with an angular resolution of ∼2.300 has allowed us to identify
26 candidate dense cores within the filament (cf. Sect. 3.3.1). These ALMA cores appear to be clustered in several groups closely associated with ArT´eMiS clumps (see Fig.3). Figure8
shows a dendrogram tree obtained when applying a nearest neighbor separation (NNS) analysis to the population of ALMA dense cores (with the scipy function cluster.hierarchy.linkage and the single method). Here, we adopted two values of the NNS
grouping threshold, 0.1 and 0.15 pc, consistent with both the typ-ical inner width of the filament and the typtyp-ical FWHM size of the ArT´eMiS clumps (see Table4). Based on the NNS analysis with a grouping threshold of 0.1 pc, the 26 dense cores can be divided into seven groups of cores (groups 1–7). Using a group-ing threshold of 0.15 pc instead of 0.1 pc, groups 2, 3 join group 1 and groups 4, 5, 6, 7 merge into the same group (see Fig.8).
Remarkably, the seven groups of ALMA compact cores roughly correspond to dense clumps visible as closed contours in the ArT´eMiS 350 µm map of the NGC 6334 filament at 800 resolution (see Figs. 1c and E.1). For the purpose of this
paper, we used GAUSSCLUMPS (Stutzki & Guesten 1990) to characterize the properties of the ArT´eMiS clumps. We applied GAUSSCLUMPS with a detection threshold of 1 Jy/800-beam
corresponding to 5σ (where 1σ = 0.2 Jy/800-beam). A total of
seven clumps were identified in this way within the footprint of the main filament, defined as the intersection of the area within ±3000 (or ±0.25 pc)6 from the filament crest and the interior of the 5 Jy/800-beam ArT´eMiS contour (see solid white contour in
Fig.8), whose positions, sizes, and estimated masses are given in Table 4. These seven ArT´eMiS clumps are also identified with the getsources (Men’shchikov et al. 2012;Men’shchikov 2013) and REINHLOD (Berry et al. 2007) source extraction algorithms, as described in AppendixF. They correspond to six groups of ALMA cores (groups 1, 2, 3, 5, 6, 7). More precisely, if we consider a group of ALMA dense cores to be associated with an ArT´eMiS clump when all of the cores in the group lie within the closed contours of the clump (Table4), then we find that each ArT´eMiS clump consists of at least two ALMA cores (Fig.3a).
6 The area within ±0.25 pc of the filament crest extends well into the power-law wing of the filament radial profile (see Fig. 3a ofAndré et al. 2016) and includes the bulk of the ArTéMiS 350 µm emission from the filament (see Fig.8).
A&A 632, A83 (2019)
Fig. 7.Close-up views of the northern (a) and southern (b) parts of the dusty filament seen in the ArT´eMiS 350 µm map. Symbols and curves are the same as in Fig.4b. The ALMA 3.1 mm continuum and ArT´eMiS 350 µm beams are shown as a filled ellipse and an open circle at the bottom left of each panel.
Fig. 8.Comparison of the spatial distributions and NNS analysis results obtained for the observed ALMA cores (left column) with those obtained for two examples of randomly-distributed source populations (middle and right columns of panels). Top row: distributions of observed cores (panel a) and randomly-placed sources (panels c and e) overlaid on the ArTeMiS 350 µm continuum map (color scale). In each panel, the solid white contour marks the footprint of the main filament, defined as the intersection of the area within ±3000from the filament crest and the interior of the 5 Jy beam−1contour in the ArTeMiS 350 µm map, within which randomly-placed sources were distributed. The dashed white contour marks the area within ±600(or 0.05 pc) of the filament crest, defining the inner filament footprint also discussed in the text. Bottom row: NNS analysis results for the observed cores (panel b) and the randomly-placed sources (panels d and f). Colored circles mark core positions in panels a, c, e, with colors corresponding to the groups defined by the NNS dendrograms shown in panels b, d, f.
To test whether the observed clustering of ALMA cores and close association with ArT´eMiS clumps may also be present in the case of randomly distributed cores, we inserted 26 sources at random positions within the footprint of the main filament (see solid white contour in Fig.8) using the python module random
and then applied the same NNS analysis. A total of 100 real-izations of such random source distributions were constructed. Two examples of resulting NNS dendrogram trees are displayed in Fig.8, where they are compared to the NNS tree obtained for the real ALMA cores. It can be seen that randomly distributed
Table 4. Properties of ArT´eMiS dense clumps.
ArT´eMiS RA Dec Rmajor× Rminor(a) PA Speak350 µm Stot350 µm Mclump(b) nH2 σN2H+ IDs of
clump [h:m:s] [d:m:s] [deg] [Jy/beam] [Jy] [M ] [×105cm−3] [km s−1] associated ALMA cores
1 17:20:44.9 −35:46:60 31.009 × 13.007 (0.26 pc × 0.11 pc) 15 17 227 320 2.1 0.5 6, 7 (Group 2) 2 17:20:44.3 −35:47:28 21.002 × 14.008 (0.17 pc × 0.12 pc) 22 11 106 149 1.7 0.8 9, 19, 24 (Group 1) 3 17:20:43.0 −35:47:53 23.006 × 16.009 (0.19 pc × 0.14 pc) 24 18 216 303 2.3 1.0 1, 4, 5, 21, 25 (Group 5) 4 17:20:41.4 −35:48:06 10.009 × 7.005 (0.09 pc × 0.06 pc) 26 9 36 51 4.2 0.3 2, 11, 16, 18, 20 (Group 7) 5 17:20:42.5 −35:48:28 14.007 × 13.007 (0.12 pc × 0.11 pc) −80 12 82 116 2.5 0.8 6 17:20:40.7 −35:48:37 24.006 × 13.000 (0.20 pc × 0.11 pc) 13 11 117 164 1.8 0.4 8, 17, 23, 26 (Group 6) 7 17:20:39.2 −35:49:06 25.003 × 14.000 (0.21 pc × 0.12 pc) 19 16 177 249 2.3 0.5 10, 12, 13, 15, 22 (Group 4)
Notes.(a)Deconvolved FWHM source diameters along the major and minor axes. (b)Estimated using an equation similar to Eq. (1) at λ = 350 µm assuming Tdust= 20 K.
sources tend to be less clustered than the observed cores, that is, a higher number of randomly-placed sources are isolated (not grouped by the NNS analysis) compared to the observa-tions. In contrast to the observed cores, there is also no clear association between the groups of randomly-placed sources and the ArT´eMiS clumps. The clustering of the observed ALMA cores within the ArT´eMiS clumps is highly significant, at the >5σ level according to binomial statistics: 16 out of 26 cores (>60%) lie within the FWHM ellipses of the clumps, while only 3 ± 2 (∼13%) of 26 randomly-placed objects would be expected within the clumps. Furthermore, the mean separation between observed cores (0.04 ± 0.01 pc) is smaller than the mean separation between randomly-placed sources found over 100 realizations (0.06 ± 0.01 pc).
It is also apparent in the top row of Fig.8that the observed cores lie significantly closer to the filament crest than randomly-placed objects within the filament footprint (solid white con-tour). Quantitatively, the distribution of offsets between the obs-erved cores and the filament crest has a median value of only 0.02 pc (lower quartile: 0.01 pc, upper quartile: 0.03 pc) while the median offset between randomly-placed sources and the crest is 0.07 pc (lower quartile: 0.03 pc, upper quartile: 0.13 pc). In other words, the spatial distribution of observed cores is almost one-dimensional (1D) along the filament crest. To fur-ther test whefur-ther significant 1D grouping of the cores exists along the crest, we repeated the same experiment with randomly-placed objects as described above but using a narrower footprint, defined as the area within ±600 (or 0.05 pc) of the filament
crest (dashed white contour in Fig. 8). The transverse width of this inner filament footprint is ∼0.1 pc, which is comparable to the dispersion of observed core positions about the crest. In this case, the mean separation between randomly-placed sources becomes identical to the mean separation between observed cores (0.04 ± 0.01 pc). The observed ALMA cores nevertheless remain more closely associated with the ArT´eMiS clumps than randomly-distributed objects along the filament crest: only 8 ± 3 of 26 randomly-placed sources would be expected within the clumps, while 16 are observed, a difference which is significant at the ∼3 σ level according to binomial statistics. We conclude that, even in 1D, there is marginal evidence of non-random core grouping along the filament axis.
The projected nearest-neighbor separation between the ArT´eMiS clumps ranges from 0.2 to 0.3 pc, and the typical pro-jected separation between ALMA dense cores embedded within a given ArT´eMiS clump is 0.04 ± 0.01 pc. These observational findings are interesting to compare with theoretical expectations. When the line mass of a cylindrical gas filament is close to the critical mass per unit length (thermal case) or the virial mass per
unit length (nonthermal case, more appropriate here – see end of Sect.1), the filament is expected to fragment into overdensities with a typical separation of about four times the filament width according to self-similar solutions which describe the collapse of an isothermal filament under the effect of self-gravity (e.g.
Inutsuka & Miyama 1992,1997). With a typical inner width of 0.15 ± 0.05 pc from the ArTéMiS results (André et al. 2016), the NGC 6334 filament can therefore be expected to fragment with a characteristic separation of ∼0.6 ± 0.2 pc. This separation scale is roughly consistent with the projected separation of 0.2– 0.3 pc observed between ArT´eMiS clumps, assuming a plausible inclination angle of ∼30◦between the filament axis and the line
of sight.
On the other hand, the effective Jeans length λJ,effor
Bonnor-Ebert diameter DBE,effwithin the filament and its clumps may be
estimated as (cf.Bonnor 1956): λJ,eff≡ DBE,eff≈ 0.98 s C2 s,eff G ρclump, (3) where Cs,eff= s σ2N2H++kTk 1 m − 1 mN2H+ ! , (4)
and G, ρclump, σN2H+, Tk, m, and mN2H+ are the gravitational constant, the density of each ArT´eMiS clump (see Table 4), the velocity dispersion measured in N2H+, the gas kinetic
tem-perature, the mean molecular mass, and the mass of the N2H+
molecule, respectively. Assuming a gas kinetic temperature of 20 K, which corresponds to the median dust temperature derived from Herschel data along the crest of the filament (André et al. 2016; Tigé et al. 2017) and using the velocity disper-sion measured in N2H+ for each ArT´eMiS clump (σN2H+ = δVFWHM/√8 ln(2), where δVFWHMis the FWHM linewidth), the
effective Jeans length in the clumps of the filament is estimated to range from ∼0.04 to ∼0.3 pc (median: 0.08 pc). This is roughly consistent with the typical projected separation between ALMA dense cores (0.04 ± 0.01 pc) assuming random projection effects within the ArT´eMiS clumps.
These two characteristic separation scales are suggestive of two distinct fragmentation modes within the NGC 6334 filament: (i) a cylindrical fragmentation mode into clumps or groups of cores with a separation of ∼4 times the filament width, and (ii) a spherical Jeans-like fragmentation mode into compact cores with a separation on the order of the effective Jeans length. Similar bimodal fragmentation patterns were first reported by
A&A 632, A83 (2019)
Fig. 9. Mass distribution of the 26 ALMA cores identified in the NGC 6334 main filament (magenta) compared to a scaled version of the prestellar CMF observed in the Aquila cloud (blue, fromKönyves et al. 2015). In both NGC 6334 and Aquila, cores were extracted from the data using the same algorithm getsources. For easier comparison, the Aquila CMF was re-normalized to have a peak value comparable to that of the NGC 6334 CMF. All error bars correspond to √N count-ing statistics. The magenta vertical dashed line indicates the estimated 90% completeness level (2.6 M ) of our ALMA 3.2 mm census of dense cores in the NGC 6334 filament. The blue vertical dashed line marks the 90% completeness level of the Aquila CMF (0.2 M ). (The blue shaded area reflects uncertainties associated with the uncertain classification of starless cores as bound or unbound objects.)
Takahashi et al.(2013) in Orion OMC3 andKainulainen et al.
(2013) in the infrared dark cloud (IRDC) G11.11-0.12 (see also
Teixeira et al. 2016 andKainulainen et al. 2017). Recent theo-retical works on filament fragmentation have tried to account for these two fragmentation modes based on perturbations to standard cylinder fragmentation models (cf.Clarke et al. 2016;
Gritschneder et al. 2017;Lee et al. 2017).
4.2. Unusually massive cores in the NGC 6334 filament Remarkably, the median mass of the ALMA cores (9.6+3.0
−1.9M )
is an order of magnitude higher than the peak of the prestel-lar core mass function (CMF) at ∼0.6 M as measured with
Herschel in nearby clouds (e.g. Könyves et al. 2015). This is illustrated in Fig. 9 which compares a rough estimate of the CMF in the NGC 6334 filament based on the present ALMA study to the CMF derived from Herschel data in the Aquila cloud. Although the two data sets differ somewhat in nature and wavelength (e.g., ALMA 3.1 mm vs. Herschel 160–500 µm), cores were extracted from dust continuum maps using the same algorithm (getsources) in both cases. Moreover, the ALMA 3.1 mm continuum data used here are sensitive to the typical size scales of dense cores identified with Herschel in Gould Belt clouds (∼ 0.02 to ∼ 0.1 pc – see Sect. 2 and Fig. 7 of
Könyves et al. 2015). The two CMFs shown in Fig. 9are thus directly comparable. The difference in typical core mass between NGC 6334 and Aquila largely exceeds possible uncertainties in the dust emissivity at 3.1 mm. For instance, if the dust emissiv-ity index β = 1.5 (instead of β = 2 as assumed in Table 2and Fig.9), the median core mass in NGC 6334 would still be a fac-tor ∼5 higher than the CMF peak in Aquila. The median mass of observed ALMA cores essentially corresponds to the peak of the NGC 6334 CMF, and lies more than a factor of three above the estimated 90% completeness level (2.6 M ) of the present core
census7. While the NGC 6334 CMF shown in Fig.9 is admit-tedly quite uncertain due to, for instance, low-number statistics and uncertainties in the 3.1 mm dust emissivity, we stress that it represents one of the first estimates of the CMF generated by a single, massive filament8(seeTakahashi et al. 2013;Zhang et al. 2015;Ohashi et al. 2016for examples of CMFs in somewhat less massive filaments or IRDCs with Mline<500 M pc−1).
The median core mass derived from the ALMA data is roughly consistent with the effective critical Bonnor-Ebert mass MBE,effin the clumps of the filament, which can be expressed as
(Bonnor 1956): MBE,eff=1.18 C3 s,eff q G3ρclump, (5)
or about 7.2 M (lower quartile: 5.0 M , upper quartile:
23.9 M ). Together with the results of Sect.4.1on core
group-ing, this supports the view that the ALMA dense cores arise from effective Jeans-like fragmentation of the ArT´eMiS clumps. Our results also suggest that more massive cores may form in denser/more massive filaments and are consistent with a pic-ture in which the global prestellar CMF, and possibly the stellar initial mass function (IMF) itself, originate from the superposi-tion of the CMFs generated by individual filaments with a whole spectrum of masses per unit length (André et al. 2019).
4.3. Likelihood of the NGC 6334 filament being a system of two velocity-coherent fibers
As described in Sect.3.3, our ALMA observations show that the ∼0.15-pc wide filament detected in the ArT´eMiS 350 µm dust continuum map is sub-structured in five fiber-like N2H+(1–0)
components with different velocities. The typical length of these fiber-like sub-structures is 0.5 ± 0.4 pc and the typical velocity difference between them is 0.8 km s−1(standard deviation of the
five N2H+ velocity components). The N2H+ velocity-coherent
sub-structures may be broadly categorized into two groups. The first group consists of the N2H+fiber-like sub-structures F-1 and
F-2, which are also detected in other molecular line tracers of dense gas such as CH3CCH, H2CS, HC3N, and HC5N and harbor
compact dense cores detected in 3.1 mm continuum emission. The second group (F-3, F-4, and F-5) is made up of velocity-coherent sub-structures detected only in N2H+ and which do
not seem to contain dense cores. There are at least two possible explanations for these two groups. First, the physical excitation conditions in the two groups of sub-structures may differ. Sec-ond, the low velocity resolution of the current CH3CCH, H2CS,
HC3N line data (see Table1) may prevent the identification of
fiber-like features in these tracers. To test the former explana-tion, observations in several transitions of each species would be required to estimate the excitation temperature, column density,
7 The 90% completeness level was estimated to be 2.6 M assum-ing Gaussian statistics and a 5σ peak-flux detection threshold of 0.7 mJy beam−1. Under these assumptions, ∼10% of sources with intrin-sic peak fluxes at the 6.3σ level of ∼0.9 mJy beam−1will have measured peak fluxes below 5σ. Thus, one can expect the 90% completeness level to roughly correspond to the 6.3σ level (cf.Belloche et al. 2011). 8 Despite the presence of fiber-like sub-structures, we regard the promi-nent filamentary structure seen in the ArTéMiS 350 µm continuum map and the ALMA N2H+(1–0) integrated intensity map (cf. Fig.1) as a single filament, comparable to the many filaments detected with Herschel in nearby clouds (Arzoumanian et al. 2011,2019) and to the B211/B213 filament in Taurus (Palmeirim et al. 2013;Hacar et al. 2013, and Sect.4.3).
and chemical abundance of the various molecules. To investi-gate the latter effect, ALMA observations of the same tracers at higher spectral resolution would be required.
The presence of velocity-coherent fiber-like sub-structures in molecular filaments was first reported byHacar et al.(2013) in the case of the low-mass star-forming filament B211–B213 in Taurus (d ∼ 140 pc). In this filament, Hacar et al.(2013) used their friends in velocity (FIVE) algorithm to identify at least 20 velocity-coherent components in N2H+ and C18O (see Table 3
in Hacar et al. 2013), which were subsequently called fibers. Since then, similar velocity-coherent components have also been detected in N2H+in the IRDC G035.39-00.33 (Henshaw et al.
2014), the NGC 1333 protocluster (Hacar et al. 2017), IRDC G034.43+00.24 (Barnes et al. 2018), and the Orion A integral-shaped filament (Hacar et al. 2018). The fiber-like sub-structures identified in NGC 1333 and Orion A may, however, differ in nature from those observed in the Taurus B211/B213 filament and in the present target NGC 6334 (see also Clarke et al. 2017). The velocity-coherent sub-structures observed in the NGC 1333 and Orion A cases are indeed well separated in the plane of the sky, while those in the Taurus and NGC 6334 filaments overlap in the sky and can mostly be distinguished in PPV space.
The typical length (0.6 ± 0.5 pc) and velocity difference between components (0.7 km s−1) reported byHacar et al.(2013)
for the fiber-like sub-structures of the (low-mass) B211/B213 fila-ment in Taurus are remarkably similar to the properties estimated here for the velocity-coherent sub-structures of the (high-mass) NGC 6334 filament. We further note that Hacar et al. (2013) divided up their B211/B213 fibers into two groups, fertile and sterile, depending on whether they contained dense cores or not. Most of the 35 velocity-coherent sub-structures identified in B211/B213 were sterile and detected mostly in C18O(1–0), while
only 7 fiber-like sub-structures were fertile and also detected in N2H+(1–0). This is reminiscent of the situation found here for
the NGC 6334 filament, where the two sub-structures detected in multiple dense gas tracers (F-1 and F-2) are the only two fertile fibers harboring ALMA dense cores. We argue below that these two categories of fiber-like structures differ in physical nature and possibly origin.
4.4. Possible origin(s) of the fiber-like sub-structures
Three scenarios for the formation of velocity-coherent fiber-like sub-structures have been proposed in the literature. One is the “fray and fragment” scenario proposed by Tafalla & Hacar
(2015) and supported byClarke et al.(2017). In this scenario, a main filament forms first by collision of two supersonic turbulent gas flows. Then, the main filament fragments into an intertwined system of velocity-coherent sub-structures, due to a combination of residual turbulent motions and self-gravity. In this picture, the sub-structures are formed by fragmentation of a single fil-ament, and the velocity-coherent sub-structures are expected to be roughly aligned with the main filament (cf.Smith et al. 2014). The second scenario is the “fray and gather” scenario, in which turbulent compression first generates short, velocity-coherent fil-amentary structures within the parent cloud, which are then gathered by large-scale collapse of the cloud, as proposed by
Smith et al.(2014). In a third, alternative picture, a dense star-forming filament forms within a shell-like molecular gas layer as a result of large-scale anisotropic compression associated with, for instance, expanding bubble(s) or cloud–cloud collision (Chen & Ostriker 2014;Inutsuka et al. 2015;Inoue et al. 2018), and subsequently grows in mass by accreting ambient gas from the surrounding shell-like structure due to its own gravitational
potential (cf.Palmeirim et al. 2013;Shimajiri et al. 2019). This accretion process supplies gravitational energy to the dense fil-ament, which is then converted into turbulent kinetic energy in the form of MHD waves (Hennebelle & André 2013), explaining the increase in velocity dispersion with column density observed for thermally supercritical filaments (Arzoumanian et al. 2013). A quasi-stationary state is reached as a result of a dynamical equilibrium between accretion-driven MHD turbulence and the dissipation of this MHD turbulence owing to ion-neutral friction, possibly accounting for the roughly constant filament width of ∼0.1 pc (Hennebelle & André 2013). In this “compress, accrete, and fragment” scenario, sterile fiber-like structures would corre-spond to portions of the accretion flow onto the central filament (see also Clarke et al. 2018), while fertile fiber-like structures would be the direct imprint of accretion-driven MHD waves within the main filament system.
While further observational constraints will be needed to fully discriminate between the above three pictures, the available constraints tend to support a scenario intermediate between the fray and fragment and the fray and gather picture, perhaps more similar to the compress, accrete, and fragment picture that we propose here. Indeed, the NGC 6334 region may be affected by cloud–cloud collision (Fukui et al. 2018, see also AppendixE), and some of the N2H+velocity-coherent sub-structures identified
here (e.g., F-5) are not aligned with, but roughly perpendic-ular to, the main filament traced at 350 µm by ArTéMiS and in N2H+ by the two main sub-structures (F-1, F-2 in Table3).
Furthermore,Shimajiri et al.(2019) recently reported kinematic evidence that the B211/B213 filament in Taurus may have formed inside a shell-structure resulting from large-scale compression. 5. Conclusions
To study the detailed density and velocity structure of the massive filament in the NGC 6334 complex, we carried out ALMA observations at ∼300resolution in the 3.1 mm continuum
and the N2H+(1–0), HC5N(36–35), HNC(1–0), HC3N(10–9),
CH3CCH(6–5), H2CS(3–2) lines. Our main results may be
summarized as follows:
– Both the 3.1 mm continuum emission and the N2H+(1–0),
HC5N(36–35), HC3N(10–9), CH3CCH(6–5), H2CS(3–2)
lines detected with ALMA trace the dusty filament imaged earlier at 350 µm at lower (800) resolution with the ArT´eMiS
camera on APEX.
– We identified a total of 40 compact dense cores in the ALMA 3.1 mm continuum map, 26 of them being embedded in the NGC 6334 filament. The majority (21/26 or 80%) of these dense cores are also detected in N2H+(1–0) emission. The
median core mass is 10+3
−2M (lower quartile: 8 M , upper
quartile: 13 M ), compared to a 5σ mass sensitivity of 2 M .
– The CMF derived from the sample of ALMA cores in the NGC 6334 filament (Fig.9) presents a peak at the median core mass of ∼10 M , which lies an order of magnitude
higher than the peak of the prestellar CMF measured with Herschel in nearby clouds.
– The projected separation between ALMA dense cores is 0.03–0.1 pc, which is roughly consistent with the effective Jeans length within the filament. The ALMA cores can be grouped into seven groups, approximately corresponding to dense clumps seen in the ArT´eMiS 350 µm continuum map. The projected separation between these groups is 0.2–0.3 pc, which roughly agrees with the characteristic spacing of four times the filament width expected from the linear fragmen-tation theory of nearly isothermal gas cylinders. These two