Publisher’s version / Version de l'éditeur:
Vous avez des questions? Nous pouvons vous aider. Pour communiquer directement avec un auteur, consultez la
première page de la revue dans laquelle son article a été publié afin de trouver ses coordonnées. Si vous n’arrivez pas à les repérer, communiquez avec nous à PublicationsArchive-ArchivesPublications@nrc-cnrc.gc.ca.
Questions? Contact the NRC Publications Archive team at
PublicationsArchive-ArchivesPublications@nrc-cnrc.gc.ca. If you wish to email the authors directly, please see the first page of the publication for their contact information.
https://publications-cnrc.canada.ca/fra/droits
L’accès à ce site Web et l’utilisation de son contenu sont assujettis aux conditions présentées dans le site LISEZ CES CONDITIONS ATTENTIVEMENT AVANT D’UTILISER CE SITE WEB.
Research Report (National Research Council of Canada. Institute for Research in
Construction), 2008-10-24
READ THESE TERMS AND CONDITIONS CAREFULLY BEFORE USING THIS WEBSITE. https://nrc-publications.canada.ca/eng/copyright
NRC Publications Archive Record / Notice des Archives des publications du CNRC : https://nrc-publications.canada.ca/eng/view/object/?id=f95c172f-14ec-4df4-bcd9-f454731b95f0 https://publications-cnrc.canada.ca/fra/voir/objet/?id=f95c172f-14ec-4df4-bcd9-f454731b95f0
NRC Publications Archive
Archives des publications du CNRC
For the publisher’s version, please access the DOI link below./ Pour consulter la version de l’éditeur, utilisez le lien DOI ci-dessous.
https://doi.org/10.4224/20377929
Access and use of this website and the material on it are subject to the Terms and Conditions set forth at
Survey Results of Combustible Contents and Floor Areas in
Multi-family Dwellings
http://irc.nrc-cnrc.gc.ca
S u r v e y R e s u l t s o f C o m b u s t i b l e C o n t e n t s a n d
F l o o r A r e a s i n M u l t i - F a m i l y D w e l l i n g s
R R - 2 5 3
B w a l y a , A . C . ; L o u g h e e d , J . D . ; K a s h e f , A . ; S a b e r , H . H .
2 0 0 8 - 1 0 - 2 4
A version of this document is published in / Une version de ce document se trouve dans:
Research Report, Institute for Research in Construction, National Research Council Canada, v. 253
The material in this document is covered by the provisions of the Copyright Act, by Canadian laws, policies, regulations and international agreements. Such provisions serve to identify the information source and, in specific instances, to prohibit reproduction of materials without written permission. For more information visit http://laws.justice.gc.ca/en/showtdm/cs/C-42
Les renseignements dans ce document sont protégés par la Loi sur le droit d'auteur, par les lois, les politiques et les règlements du Canada et des accords internationaux. Ces dispositions permettent d'identifier la source de l'information et, dans certains cas, d'interdire la copie de documents sans permission écrite. Pour obtenir de plus amples renseignements : http://lois.justice.gc.ca/fr/showtdm/cs/C-42
Survey Results of Combustible Contents and
Floor Areas in Canadian Multi-Family Dwellings
Research Report No. 253
Date: 24
thOctober, 2008
Author: Alex Bwalya, Gary Lougheed, Ahmed Kashef and
Hamed Saber
Institute for Research in Construction
Fire Research Program
Table of Contents
Preface ...ii
Abstract ... iii
1 Introduction... 1
2 Survey
Methodology... 2
2.1 Multi-Family
Residential Dwellings... 2
2.2 Residential
Care Dwellings ... 4
2.3 Calculation
of
Fire Load Density ... 4
3 Results ... 7
3.1 Multi-Family
Residential Dwellings... 7
3.2 Residential
Care Dwellings ... 23
3.3
Comparison of Results in Residential Care and Multi-family Dwellings ... 25
4
Case Study: Bedroom Arrangements with a Potentially High Fire Load Density.... 27
5 Discussion
of Results ... 29
6 Conclusion... 30
6.1 Recommendations
for Further Work ... 31
7 Acknowledgments ... 31
8 References ... 32
Appendix A: Results of Furniture Survey and Values of Weight and Heat of Combustion
Used in Calculating Fire Load Densities ... 34
Preface
This report presents the results of a survey of floor areas and combustible contents in multi-family dwellings such as semi-detached houses, town houses and low-rise apartments, conducted as part of the Characterization of Fires in Multi-Suite Residential Dwellings (CFMRD) project.
The CFMRD project is a four-year collaborative undertaking with industry, provincial governments and city authorities that was initiated by NRC-IRC in 2006 to study fires in low-rise multi-suite residential dwellings of light-frame construction. The project was undertaken due to the need to: a) address the lack of realistic characterized fire types, known as design fires, which are required to aid the development of methods for achieving performance-based solutions to fire problems, and b) further the understanding of how fires in residential buildings sometimes cause fatalities and substantial property losses, as revealed by fire statistics.
The CFMRD project focuses on fires in dwellings, such as apartments, semi-detached houses, duplex houses, townhouses or row houses, secondary suites and residential care facilities as these fires have a potentially greater impact on adjacent suites.
The main objectives of the project are:
1. To conduct fire experiments to characterize fires originating in various living spaces within multi-suite dwellings.
2. To conduct numerical simulations of various fire scenarios in order to interpolate and extend the data beyond that obtained in the experimental studies.
3. To produce a set of realistic design fires for multi-suite dwellings from the experimental data. 4. To develop an analytical method that can be used to calculate design fires for multi-suite
dwellings.
The research approach employed by the project utilizes literature reviews, surveys to determine typical configurations and combustibles, computer simulations and fire experiments. Medium- and full-scale fire experiments will be conducted to determine the combustion characteristics of typical household
furnishings found in living spaces that have a high incidence of fires, individually in an open calorimeter and collectively in realistically furnished and well-instrumented simulated residential rooms. Numerical modelling of fire development, using suitable fire models, will be conducted at various stages to assist in the design and instrumentation of the full-scale fire experiments as well as to study the effect of various parameters, such as the ventilation conditions, geometry, and fire load on the development of the fire.
NRC-IRC gratefully acknowledges the financial and technical support of the Project Consortium, which consists of representatives from the following participating organizations:
Canadian Automatic Sprinkler Association
Canadian Concrete Masonry Producers Association Canadian Furniture Manufacturers Associations The Canadian Wood Council
City of Calgary
FPInnovations - Forintek Division Gypsum Association
Masonry Worx
Ontario Ministry of Municipal Affairs and Housing Régie du Bâtiment du Québec
The authors acknowledge the contribution of all of the members of technical and advisory groups of the project at the NRC-IRC Fire Research Program
Abstract
This report presents the results of a survey of floor areas and combustible contents in multi-family dwellings such as semi-detached houses, town houses, low-rise apartments and residential care homes.
The survey was primarily based on measurements and photographic information obtained from real-estate websites. In addition to quantifying combustible contents, an important objective of the survey was to determine the similarities in combustible contents and configurations of these dwellings, which could be used in designing fire experiments. The survey provided an insight into the types and quantity of combustible contents found in residential dwellings, as well as the types of floor configurations and other information that is pertinent to fire issues. Typical
furnishings that constitute a significant portion of the movable fire load were identified and possible values of fire load densities were calculated for rooms such as: kitchens, dining rooms, living rooms and bedrooms.
The average fire load densities in various rooms were estimated to be: kitchens – 807 MJ/m2; dining rooms – 393 MJ/m2; living rooms – 412 MJ/m2; basement living rooms – 288 MJ/m2; primary bedrooms – 534 MJ/m2; and, secondary bedrooms – 594 MJ/m2. Although kitchens had the highest fire load densities the actual fire load (heat content) was found to be lower than bedrooms, which have a higher fire load due to the presence of mattresses, clothing and carpeting.
Survey Results of Combustible Contents and Floor Areas in Canadian
Multi-Family Dwellings
By
Alex Bwalya, Gary Lougheed, Ahmed Kashef and Hamed Saber
1
Introduction
This report presents the results of a survey of floor areas and combustible contents in multi-family dwellings such as semi-detached houses, town houses and low-rise apartments, as part of the Characterization of Fires in Multi-Suite Residential Dwellings (CFMRD) project, which seeks to characterize fires in these buildings and ultimately develop methods for use in fire safety engineering analysis and design. There are three distinct dwellings of interest in the CFMRD project, namely multi-family residential dwellings, residential care dwellings and secondary residential suites. For the purpose of the project, the term “multi-suite” reflects the fact that the three types of residential dwellings share a common attribute in that they all consist of multiple suites. Therefore, in addition to quantifying combustible contents an important objective of the survey was to determine the similarities in combustible contents and
configurations of these dwellings, with a view to designing an optimized experimental program with generally applicable results.
Information on the configuration of rooms in a building and their combustible furnishings is an essential requirement in any effort to characterize a fire. Therefore, the survey focused on combustible furnishings in key rooms, such as the kitchen, living room and bedroom, in which fires are more likely to originate. The most extensive survey was conducted for multi-family residential dwellings, whereas the survey of residential care dwellings was of limited extent. There were no surveys conducted in secondary suites, as they were inaccessible through all methods employed for the other dwellings. However, a few floor plans were reviewed to gain insight into their layout.
The survey of multi-family residential dwellings was conducted over a period of six months using information collected from real estate web sites that list homes for sale. Various websites around the country were considered in the survey, however many did not have the information structured in the form required for the survey. Therefore, the survey was primarily based on information from the Grapevine website [1] in Ottawa, which had all of the required information, such as room dimensions, floor plans and photographs of room furnishings. A
limited amount of information on room dimensions was collected from ReMax websites [2 - 5] in Vancouver (British Columbia), Calgary (Alberta), Toronto (Ontario), and St. Johns
(Newfoundland), and compared with the data from Ottawa.
2
Survey Methodology
Surveys are traditionally conducted by physically entering a building and listing the contents and their pertinent characteristics. However, this method is laborious, time consuming and for residential dwellings, in particular, progress can be hampered by privacy concerns, and hence there is a need for alternative approaches. Surveys conducted at NRC [6, 7] in living rooms demonstrated that using a questionnaire produced reasonable results. However, one of the main disadvantages of a questionnaire is that the results are largely qualitative since the accuracy and consistency of the information provided by respondents cannot be verified.
In this work the surveys were conducted using the traditional approach for residential care dwellings, which were accessible by courtesy of the fire services, whereas an internet-based survey was utilized for the survey of multi-family residential dwellings. In the context of this survey, the term ‘living room’ includes family rooms and recreation rooms that may be located on the basement level.
2.1 Multi-Family Residential Dwellings
The survey of multi-family residential dwellings utilized the widespread use of the Internet for advertising homes for sale, in order to circumvent the drawbacks associated with the
traditional and questionnaire surveys. Homes for sale are commonly listed on well-organized real estate websites, which are managed by realty firms. The listings were usually complete with the dimensions (likely taken from original floor plans) of all major rooms in the house and in some cases floor plans are also provided. In addition, and most importantly for the purpose of conducting a fire load survey, homeowners wishing to sell their property usually provide digital photographs of various rooms, which show furnishings and their layouts. Figures 1 and 2 show examples of photographs provided with such real estate listings.
Figure 1. Photograph of a 12.3 m2 basement living room obtained from a real estate website
Figure 2. Photograph of a 11 m2 secondary bedroom obtained from a real estate website
The presence of the photographs makes this a viable approach for conducting a fire load survey since major furnishings such as sofas and beds are clearly visible and it is possible to conduct a substantial inventory of the contents. However, this method also has some
limitations, such as:
1) The photographs often show a single view and all of the furnishings and some relevant details may not always be visible. This was particularly so for the bedrooms, where typical furnishings and contents such as dressers, drawer chests and clothing were not always visible in some photographs.
2) Many photographs show tidy room settings in an obvious effort by the seller to portray a positive image, whereas in reality some degree of clutter would be expected to occur (at times) in some areas of a house.
3) Calculation of fire load density is based on estimated weights and calorific values of representative furniture items, since physical weighing of the furnishings is not possible.
Despite these limitations, this approach is expected to provide a good insight into the typical furnishings and likely fire load densities in residential dwellings given that these dwellings are otherwise inaccessible for the purpose of fire load surveys.
The rooms covered in the survey were: 1) kitchen; 2) dining room; 3) main living room (main floor); 4) basement living room; 5) master bedroom; 6) second bedroom; 7) third bedroom. In this report, the master bedroom will be referred to as the primary bedroom, whereas the
second and third bedrooms will be termed secondary bedrooms. Secondary bedrooms are normally occupied by children or used for other purposes such as a home office.
2.2 Residential Care Dwellings
A traditional physical survey was only conducted for a limited number of residential care dwellings.
2.3 Calculation of Fire Load Density
The quantity of movable combustibles in a compartment is commonly expressed as the total heat energy (units in MJ) that can be released through complete combustion, and will be referred in this work as fire load (FL), which is essentially the potential heat energy that can be liberated during the combustion process. The FL is commonly expressed as an energy density (fire load per unit floor area in MJ/m2 ) and referred to as the fire load density (FLD). The fire load is also sometimes referred to as the fuel load. At times, the contribution of the combustible parts of the building structure (the fixed fire load) is included in the total fire load. However, this survey was only concerned with the movable fire load, which consists of any contents that are not part of the building structure, such as furnishings and other personal belongings.
For ‘n’ combustible items in a room, the fire load is calculated as follows: =
=
=
∑
i n i×
ii 1
FL
m
HC
(MJ)
(1)where ‘m’ is the mass of an item of furniture (kg), and ‘HC’ is it’s heat of combustion (MJ/kg), also known as the calorific value.
The fire load density is given as:
=
2r
FL
FLD
(MJ / m )
A
(2)where Ar is the floor area of the room (m2).
A computer algorithm was used to calculate the fire load density for each room. The input files for the program contained room dimensions, combustible contents (noted from the photographs) and weights and heat of combustion values for furnishings.
2.3.1 Assumptions, Furniture Weights and Calorific Values
2.3.1.1 Furniture weights and calorific values
Where possible, published data on heat of combustion [8 - 10] were used in the calculation of the fire loads. Weights, dimensions and the composition of representative furniture items were obtained from a previous survey [7] and an additional furniture survey that was conducted in local furniture stores. The results of the furniture survey as well as the weights and heats of combustion used in the calculation of the fire loads are given in Appendix A (Tables A-1 and A-2).
2.3.1.2 Flooring
The four common types of floor finishing materials that were included in the calculation of the fire load density are given in Table 1. The sub-floor was not included in the calculation since this is considered to be part of the building structure and is therefore a fixed component of the total building fire load.
From the photographs, it was not possible to differentiate between hardwood and laminate flooring unless it was specified in the listing. Therefore, hardwood was assumed in cases where laminate flooring was not mentioned specifically for a particular room in the listings, since it provides a greater fire load.
Table 1. Area and fire load density of various flooring materials
Flooring material Mass density (kg/m2)
Fire load density (MJ/m2)
1 Carpet with under-pad 4.2 109
2 Hardwood (Oak) 13.4 241
3 Laminated board (medium
density fire board) 6.0 108
4 Vinyl 2.1 53
5 OSB sub-floor1 9.2 165
OSB – Oriented strand board
1
The OSB sub-floor was not included in the calculation of fire load density. The value is provided for information only.
2.3.1.3 Clothing
Since clothing was not visible in most photographs, it was assumed that an adult would have enough clothing (including shoes) to fill three suitcases to a maximum weight of 23 kg per suitcase, which is permitted by most airlines on domestic and international flights, whereas a child would likely fill two suitcases. Therefore, it is reasonable to assume that an adult could have at least 69 kg (about 3 suitcases) of clothing whereas a child would have 46 kg (about 2
suitcases). These are conservative estimates considering that some airlines allow up to 32 kg per suitcase on international flights and most travelers would likely be able to fill two suitcases to this limit without completely emptying their closets. Each bedroom was assumed to be occupied by two people and therefore the weight of clothing in the primary and secondary bedrooms was taken to be 138 kg and 92 kg, respectively. In the case of residential care homes, each resident was assumed to have 23 kg of clothing. These quantities are modest considering that they include shoes and clothing contained in closets, drawer chests, laundry hampers and other concealed compartments within a bedroom.
2.3.1.4 Kitchen Cabinets and Appliances
Kitchen cabinets were assumed to be made of particleboard with a density of 995 kg/m3 and installed on approximately one length of a kitchen area. The weight of the cabinetry wooden materials (including the counter top) was estimated to be approximately 100 kg per meter length based on information from a major home renovation retail outlet.
In the case of kitchen appliances, it was assumed that the largest contribution to the combustible fire load came from refrigerators and dishwashers. The total combustible mass (excluding metal components) of kitchen appliances was taken to 30 kg based on published data from a European study [11].
2.3.2 Uncertainties
All surveys regardless of the methodology have a degree of uncertainty due to the number of assumptions and approximations made in the measurements and calculations since in many cases it is not practical to directly weigh every combustible item in a building. In physical surveys using an inventory technique, measurement errors have been reported to be about 10% [12], whereas the errors between different surveyors were of the order of 15% to 20%.
It is the authors’ opinion that reasonableness (of assumptions) plays an important role in the interpretation and use of information from fire load surveys such as this one since there is no truly statistically representative fire load survey considering that the actual population of interest ranges into millions of households in many countries and yet even the most extensive surveys only cover a few hundred households. For example, based on a Canadian census conducted in 2006, it was reported that there were approximately 13 million private dwellings. Therefore, a key assumption in this regard is that it is reasonable to assume that homes contain typical furnishings found in the market place and that there are numerous similarities in the way people furnish their homes.
In this light, the focus of this survey was not to assign specific levels of accuracy to numerical values, but rather to provide reasonable estimates of the likely magnitude of fire load densities and typical combustible contents in various areas, given that residential dwellings are otherwise inaccessible for fire load surveys. However, to improve the accuracy many of the typical furniture items used in calculating fire load densities were weighed accurately to better than +/- 0.1 kg during actual surveys of furniture stores so as to establish representative weights.
3
Results
3.1 Multi-Family Residential Dwellings
The number of homes surveyed from the Grapevine website was 515. A breakdown of the types of homes found in the survey is shown in Figure 1. The largest proportion (74 %) of the homes was town houses.
Figure 3. Types of homes found in the Grapevine survey
The average age of a random sample of 201 homes in the survey was 16 years with a standard deviation of 13 years. The ages of the homes ranged from 83 years (built in 1925) to 1 year (built in 2007).
3.1.1 General Layout (Analysis of floor plans)
Analysis of photographs and 53 floor plans collected from the Grapevine website revealed that the predominant layout of the main floor was of the so-called ‘open-concept’ design, which means that the kitchen, dining room and living room on the main floor are mainly
interconnected spaces without full-height (floor to ceiling) wall separations. Three types of rectangular-shaped main-floor configurations, with various permutations of the kitchen, living room and dining room areas, were identified: a) small aspect ratio; b) large aspect ratio (elongated), and; c) small aspect ratio with attached garage. Aspect ratios ranged from 0.6 to 3.6 with a mean value of 1.6. Figure 4 depicts the three general configurations. Configuration “C”, with an attached garage, was prevalent in larger town and semi-detached houses.
Figure 4. Typical main floor layouts in multi-family dwellings
Figure 5 illustrates the compartmented nature of the second floor, on which the bedrooms are normally located. The second floor is typically partitioned into bedrooms each having a doorway that leads to a common corridor. A portion of the floor area on the second floor accommodates a bathroom, closets and the staircase leading to the lower floor.
The configuration of the basement level was the most varied among all of the floors. Typical layouts included a single living room or compartmented areas for various uses. 3.1.1.1 Secondary Suites
Only a limited amount of information was found on floor plans of secondary suites. A few plans were provided by the Canada Mortgage and Housing Corporation, which indicated that secondary suites are essentially small apartments having a similar floor plan to the main floor layout in multi-family dwellings with the exception that one or two bedrooms are located on the same floor and in close proximity to a combined living room, dining room and kitchen area.
3.1.2 Floor Areas
Table 2 gives the statistical results of the distribution of floor areas of various rooms in descending order of the mean value. The results show that: 1) basement living rooms are typically larger than all other rooms in a dwelling; 2) living rooms on the main floor and the primary bedroom are of comparable intermediate size; and 3) secondary bedrooms, the kitchen and dining room are of a comparable small size. The average aspect ratio (length divided by width) was found to be about 1.1. As the main-floor in dwellings was of open-concept design, the mean and standard deviation of complete main floor areas (kitchen, dining and living room) was 34.8 m2 and 7.6 m2, respectively. The areas ranged from 22.0 m2 to 62.0 m2.
Table 2. Statistical results for floor areas of rooms in a multi-family dwelling in Ottawa (in
descending order) Room Average Area (m2) Standard Deviation (m2) Minimum (m2) Maximum (m2) Sample Size Kitchen 9.8 3.6 3.6 28.2 515 Dining room 9.7 2.3 4.2 21.2 415
Main living room 17.6 4.3 6.1 33.2 494
Basement living room 23.2 9.0 6.7 64.7 295
Primary bedroom 16.6 3.7 7.2 27.3 521
Secondary bedroom 1 10.5 2.0 6.1 26.5 514
Secondary bedroom 2 9.5 2.2 6.0 21.7 402
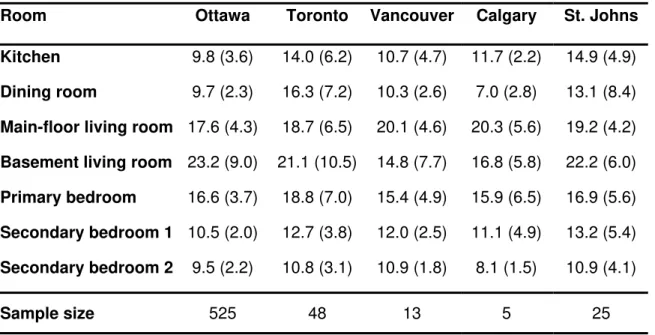
Table 3 gives the mean floor areas for seven rooms that were gathered from five Canadian cities. The results show that the sizes of main living room and all of the bedrooms are
comparable. The homes in St. Johns, Newfoundland, had larger rooms, likely due to the abundance of land as the population density in Newfoundland and Labrador (1.4 persons per km2) was the lowest among all of the other provinces: Ontario (12.6), Alberta (4.6) and British Columbia (4.2), based on information from Statistics Canada [13].
Table 3. Comparison of mean floor areas of various rooms in five Canadian cities (area in m2
with standard deviation in brackets)
Room Ottawa Toronto Vancouver Calgary St. Johns
Kitchen 9.8 (3.6) 14.0 (6.2) 10.7 (4.7) 11.7 (2.2) 14.9 (4.9)
Dining room 9.7 (2.3) 16.3 (7.2) 10.3 (2.6) 7.0 (2.8) 13.1 (8.4)
Main-floor living room 17.6 (4.3) 18.7 (6.5) 20.1 (4.6) 20.3 (5.6) 19.2 (4.2)
Basement living room 23.2 (9.0) 21.1 (10.5) 14.8 (7.7) 16.8 (5.8) 22.2 (6.0)
Primary bedroom 16.6 (3.7) 18.8 (7.0) 15.4 (4.9) 15.9 (6.5) 16.9 (5.6)
Secondary bedroom 1 10.5 (2.0) 12.7 (3.8) 12.0 (2.5) 11.1 (4.9) 13.2 (5.4)
Secondary bedroom 2 9.5 (2.2) 10.8 (3.1) 10.9 (1.8) 8.1 (1.5) 10.9 (4.1)
Sample size 525 48 13 5 25
3.1.3 Window Sizes
Table 4 gives the dimensional characteristics of living room and bedroom windows in multi-family residential dwellings, which were estimated from room photographs obtained from Grapevine’s website by using dimensions of items and features such as upholstered furniture, beds and the ceiling height as a yardstick. Due to the subjective nature of the values, it is difficult to ascertain the accuracy of the figures. However, a comparison with measurements taken from a home builder’s constructions plans (Table 5) and the Canadian Standards Association (CSA) (Table 6) indicates that the estimate’s from the survey are reasonable and highlight important trends in window sizes in living rooms and bedrooms. In particular, the results show that living rooms have significantly larger windows than bedrooms. It was also observed that multiple windows were more commonly found in living rooms than in bedrooms and this contributes to the larger overall widow sizes indicated for living rooms in Table 4. All of the windows found in the survey were estimated to be larger than the minimum area of 0.35 m2 specified in the National Building Code of Canada (NBC) [14] for sleeping areas.
Table 4 also lists a commonly used correlating parameter, the ventilation factor, which takes into account the existence of multiple openings. Window size is an important parameter that affects the availability of air required to sustain combustion and has an impact on the severity and duration of the fire. It is known that the flow of air into a room is proportional to the ventilation factor, Fv (
5 2
m
), which is given by: v o oF =A
H
(3)where Ao is the area of the opening (m2) and Ho is the height of the opening (m).
Table 4. Dimensional characteristics of window openings in living rooms and bedrooms
Living Rooms Bedrooms
Mean 3.1 1.7 SD 1.2 0.8 Maximum 8.0 4.0 Window Area (m2) Minimum 1.1 0.5 W H W H Mean 1.8 1.6 1.4 1.2 SD 0.6 0.3 0.4 0.4 Maximum 4.0 2.0 2.0 2.0 Dimensions (m) Minimum 0.6 0.3 0.8 0.6 Mean 4.3 1.8 SD 2.0 1.2 Maximum 11.3 5.7 Fv (m5/2) Minimum 1.2 0.4 Sample size 74 48
SD: Standard deviation; W: Width; H: Height
Table 5. Windows sizes obtained from a homebuilder in Ottawa
Living Rooms Bedrooms
W H W H Mean 1.9 1.3 1.1 1.3 SD 0.2 0.2 0.5 0.2 Maximum 2.8 1.9 1.9 1.4 Dimensions (m) Minimum 1.4 0.6 0.6 1.0
Sample size 6 plans 8 plans
Table 6. CSA A440 reference window sizes (no specific room). W H Mean 1.1 1.2 SD - - Maximum 1.6 1.6 Dimensions (m) Minimum 0.6 0.6
SD: Standard deviation; W: Width (m); H: Height (m)
Estimates of window sizes in basement living rooms were not conducted since a
previous survey [7] had shown that the average window area in multi-family dwellings was about 0.6 m2. Therefore, it is expected that the smallest windows in any dwelling will typically be found in a basement living area – an assertion supported by a review of the photographs collected during the survey. However, there are dwellings in which one side of a basement could be at grade level and would have large windows (similar to main-floor living rooms) or patio doors.
3.1.4 Fire Load Densities
Table 7 shows the calculated fire load densities for four rooms. The results show that kitchens have a significantly higher fire load density (mean of 807 MJ/m2) than any other area in a home due to a combination of the heavy wooden cabinets and a small floor area. This result is in good agreement with the results of a survey of single-family dwellings conducted in the USA [12], in which the highest fire load densities were found in kitchens and storage areas, although the values were reported to be higher than 1,000 MJ/m2.
The 95th percentile value of fire load density—a value exceed by only 5% of the survey population—has great significance in fire safety engineering in so far as designing buildings and structures against fire scenarios having a potentially severe impact. Some design guides recommend using at least a 90th percentile fire load density from representative surveys [15].
Since the fire load density has a direct bearing on fire duration, given identical fire development characteristics and floor area, the 95th percentile (or 90th percentile) values better reflect the inherent fire hazard and is often referred to as a credible but severe fire load density [16]. Assuming a lognormal distribution, the 95th percentile value is often approximated as: 1.64 times the standard deviation plus the mean. However, in the present case the distributions are not strongly lognormal, therefore the 95th percentile value was calculated to be consistent with each distribution.
Table 7. Fire load densities for various rooms Room Mean FLD (MJ/m2) Standard Deviation (MJ/m2) Minimum (MJ/m2) Maximum (MJ/m2) 95th Percentile Sample Size Mean FL (MJ) Kitchen 807 123 420 1244 940 515 7,908 Secondary bedroom 594 146 107 1,000 846 129 6,237 Primary Bedroom 534 125 249 920 753 347 8,864 Living Room 412 127 106 897 610 397 7,251 Dining Room 393 132 119 901 576 292 3,812 Basement Living Room 288 96 103 633 450 130 6,682
After kitchens, bedrooms, and in particular secondary bedrooms (mean of 594 MJ/m2 compared to 534 MJ/m2 in primary bedrooms), had the next highest fire load density. The higher mean fire load density obtained in secondary bedrooms is due to their smaller mean floor area (10.5 m2) compared to primary bedrooms (16.7 m2), yet both rooms contain similar furnishings albeit of different configurations, sizes and quantities. Basement living rooms had the lowest mean fire load density (288 MJ/m2) among all the rooms, which can be attributed to their higher mean floor area (23.2 m2) compared to main floor living rooms (17.6 m2) and primary bedrooms (16.7 m2). This is consistent with observations from the photographs that basement living rooms were generally more spacious, less crowded with furniture and had more floor area that was unoccupied by furniture compared to all other rooms.
Since the area of different rooms differs greatly, the fire load density alone may not be a particularly good indication of the likely impact of a fire given that a large room with lower fire load density may contain a greater overall quantity of combustible materials (greater fire load) than much smaller rooms having high fire load densities, as shown by the comparison of rankings based on mean fire load density (FLD) and fire load (FL), which is given in Table 8. Whereas the primary bedroom ranks third in terms of fire load density, it ends up in first position in terms of fire load. Another interesting case is the secondary bedroom, which drops from second position (FLD ranking) to fifth position in the FL ranking order. Under comparable fire growth and ventilation conditions, rooms with a greater fire load are likely to result in fires having a longer duration and a more severe impact.
Table 8. Ranking of rooms based on the mean FLD and FL.
Ranking based on: Room Mean FLD (MJ/m2) Mean FL (MJ) Kitchen 1 2 Secondary bedroom 2 5 Primary Bedroom 3 1 Living Room 4 3 Dining Room 5 6
Basement Living Room 6 4
FLD: Fire load density; FL: Fire load
The frequency distribution of fire load density in all the rooms is shown in Figures 6-11. All of the rooms have lightly positively skewed (median close the mean) distributions with the exception of the kitchen, which has a prominently negatively skewed distribution. A positively skewed distribution has more observations of low frequencies above the median than below it, whereas a negatively skewed distribution is the opposite.
Fire load density (MJ/m2)
0 100 200 300 400 500 600 700 800 900 1000 1100 Frequ ency 0 10 20 30 40 50 60 70 80 Mean: 412 MJ/m2 Skewness: 0.40
Figure 6. Distribution of fire load density in living
rooms
Fire load density (MJ/m2)
0 100 200 300 400 500 600 700 800 900 1000 1100 Frequ enc y 0 5 10 15 20 25 30 35 Mean: 288 MJ/m2 Skewness: 0.67
Figure 7. Distribution of fire load density in
Fire load density (MJ/m2) 0 100 200 300 400 500 600 700 800 900 1000 1100 Fr equ en c y 0 10 20 30 40 50 60 Mean: 534 MJ/m2 Skewness: 0.42
Figure 8. Distribution of fire load density in primary
bedrooms
Fire load density (MJ/m2)
0 100 200 300 400 500 600 700 800 900 1000 1100 Fr equ en c y 0 5 10 15 20 Mean: 594 MJ/m2 Skewness: 0.04
Figure 9. Distribution of fire load density in
secondary bedrooms
Fire load density (MJ/m2)
0 100 200 300 400 500 600 700 800 900 1000 1100 Fr equ en c y 0 10 20 30 40 50 60 70 80 90 Mean: 805 MJ/m2 Skewness: -5.6
Figure 10. Distribution of fire load density in
kitchens
Fire load density (MJ/m2)
0 100 200 300 400 500 600 700 800 900 1000 1100 Fr equ en c y 0 10 20 30 40 50 60 Mean: 393 MJ/m2 Skewness: 0.38
Figure 11. Distribution of fire load density in dining
rooms
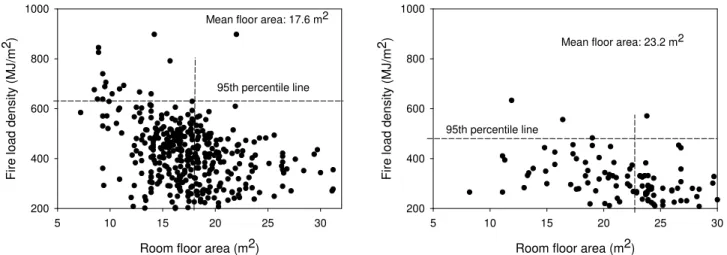
3.1.4.1 Variation of Fire Load Density with Floor Area
Figures 12-15 show graphs of fire load density against the floor area. The graphs show a considerable amount of scatter with a distinct trend that higher values of fire load density are found at small floor areas. The scatter also indicates that the variation of fire load density is somewhat random, since vastly different values can be found for the same floor area.
Figure 12. Variation of fire load density with floor area
in main floor living rooms
Figure 13. Distribution of fire load density in
basement rooms
Room floor area (m2)
5 10 15 20 25 30 Fir e l oad d ens ity ( M J /m 2) 200 400 600 800 1000 1200 95th percentile line Mean floor area: 16.6 m2
Figure 14. Variation of fire load density with floor area
in primary bedrooms
Room floor area (m2)
5 10 15 20 25 30 Fir e l oad d ens ity ( M J /m 2) 200 400 600 800 1000 1200 95th percentile line Mean floor area: 10.5 m2
Figure 15. Distribution of fire load density in
secondary bedrooms
3.1.4.2 Composition of Fire Load
Table 9 gives the composition of the combustible contents in all of the rooms broken down into three main material groups: wood and paper (cellulose-based), synthetic plastics and textiles (or fabrics). It is evident from these results that wood-based materials form a significant
Room floor area (m2)
5 10 15 20 25 30 Fi re load d ens ity (MJ /m 2) 200 400 600 800 1000 95th percentile line Mean floor area: 17.6 m2
Room floor area (m2)
5 10 15 20 25 30 Fi re load d ens ity (MJ /m 2) 200 400 600 800 1000 95th percentile line Mean floor area: 9.7 m2
Room floor area (m2)
5 10 15 20 25 30 Fi re load d ens ity (MJ /m 2) 200 400 600 800 1000 95th percentile line
proportion of the total combustible mass in every room, particularly in kitchens (86.5%), dining rooms (72.6%) and living rooms (65.8%).
Table 9. Composition of the fire load
Percent Weight (kg) Percent FL (MJ)
Room W P T W P T Kitchen 86.5 13.5 <<1% 80.2 19.8 <<1% Living Room 65.8 32.9 1.4 57.4 41.4 1.2 Dining Room 72.6 26.6 0.8 65.0 34.0 0.8 Primary Bedroom 42.3 26.4 31.4 37.8 34.1 28.1 Secondary bedroom 39.8 29.8 30.3 35.2 38.0 26.8 Basement Living Room 61.0 39.0 0.2 51.8 48.1 0.2
W: Wood and paper; P: Synthetic plastic materials (including polyurethane foam); T: Textiles (including clothing); <<1%: much lower than 1%
The higher percentage of wood in kitchens and dining rooms is due to the existence of large wooden furnishings and fittings – kitchen cabinets and dining sets (table, display unit and hutch). In dining rooms, a considerable portion of the combustible plastic mass comes from carpeting given that dining chairs includes only a small amount of polyurethane foam on the seat and backrest sections. The percentage of wood in living room appears high relative to plastics largely due to the popularity of hardwood flooring. The sub-floor material (typically an
engineered wood board) was not taken into account.
As for bedrooms, the weight distribution is markedly different from all other rooms because textiles (clothing) constitute a significant portion (about 30%) of the combustible mass. However, wood still claims the largest proportion (about 40%) of the combustible mass. The overall percentage of wood-based (cellulose) materials may actually be greater if clothing were to be divided up into synthetic and cotton materials – it is estimated that 50% of clothing will be cotton, a cellulose material.
In all cases, Table 9 shows that the percentage contribution of the plastics the fire load (MJ) increases proportionately since plastics have higher calorific values than wood-based materials.
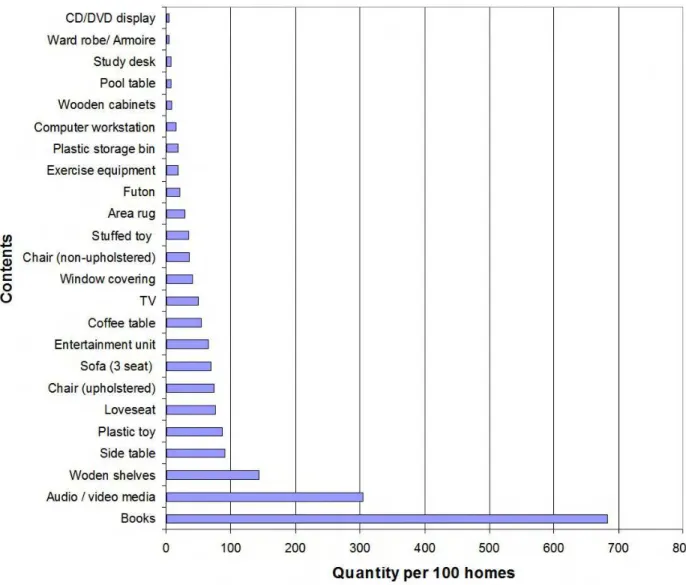
3.1.5 Typical Combustible Contents
The survey revealed considerable variations in the types and arrangements of
furnishings found in residential dwellings, which reflects the unique nature of every occupant. Figures 16-20 show the typical combustible contents of significance in living rooms, dining rooms and bedrooms. A similar graph was not produced for kitchens since kitchen cabinets are the main combustible contents in these areas. While all of the rooms contain a group of
furnishings that characterize the use of the room, secondary bedrooms and basement living rooms were found to contain a greater variety of furnishings than other rooms.
Although, Figures 16-20 do not show any results for pillows and throw (toss) cushions, it was observed that toss cushions were widely used in living rooms and bedrooms, as shown by the results in Table 10. The number of pillows and toss cushions on a bed generally increased with the size of the bed and ranged from one pillow on a twin-size bed to six pillows on a queen-size bed.
Table 10. Typical number of pillows and toss cushions in 66 samples
Number of pillows Number of toss cushions Type of
Furniture Average Maximum Average Maximum
Twin-size bed 2 2 1 2
Double-size bed 2 4 1 4
Queen size bed 4 6 2 4
Sofa - - 2 4
3.1.6 Arrangement of Bedclothes
Table 11 shows the results of an analysis of 66 random samples to determine how beds were made based on the arrangement of the comforter and pillows. The results show that the most popular arrangement had a comforter laid all the way to the head side of the bed with a pillow placed on top of it. The arrangement of the comforter (whether folded back or not) may affect the surface flame spread behavior and consequently fire growth.
Table 11. Arrangement of comforters for a sample of 66 beds
Comforter Arrangement Percentage
1 - Under pillow 71%
2 - Over pillow 19 %
4 - Folded back and touching pillow 8 % 5 - Folded back and not touching pillow 2 %
3.1.7 Floor Coverings
The distribution of floor covering materials in various rooms is given in Table 12.
commonly used floor covering in bedrooms (67% and 77%) and basement living rooms (88%). Vinyl flooring was very common (75%) in kitchens. The percent reported as unknown in
kitchens is most likely ceramic flooring since the non-combustible flooring materials were not documented. In most cases, dining rooms were observed to have the same floor finishing
material as living rooms since these are interconnected areas on the same floor. The results for living rooms are in good agreement with a previous survey [7] in which it was found that usage of hardwood and carpeting floor finishing was 49% and 41% , respectively.
Table 12. Distribution of floor covering materials in various rooms Floor covering Kitchen Living room Primary bedroom Secondary bedroom Basement living room Carpet 0% 33% 77% 67% 88% Hardwood 7% 63% 17% 18% 11% Vinyl 75% 4% 0% 1% 1% Unknown 18% - 6% 14% - Sample size 241 396 347 143 129
3.1.8 Combustible Wall or Ceiling Finishes
There were very few cases (about 1% - only six cases) where combustible wall or ceiling finishing materials were found and 60% of these cases were basement living rooms. Figures 21. and 22.show two such cases, one with a combustible ceiling finish and the other a combustible wall finish consisting of wood panels. Combustible wall and ceiling finishes were included in the calculation of fire load densities for these cases.
3.2 Residential Care Dwellings
The survey of residential care homes was conducted in four different dwellings and included a total of 22 bedrooms containing a total of 31 beds. The buildings covered in the survey included: 1) a duplex building in which two neighboring units were combined to form a residential care home; 2) a single family dwelling located in a residential neighborhood; 3) a converted two-storey single family dwelling which had been extensively modified to
accommodate 16 residents, and; 4) a town house in which residents were accommodated on the main and basement floors, while the owner occupied the upper floor. Figures 23 and 24 show two of the buildings covered in the survey, and Figures 25 and 26 show how some of the rooms were furnished.
Figure 23. Duplex building Figure 24. Single family dwelling modified into a
multi-bedroom facility
Figure 25. Spacious residential care bedroom with
The residents in the dwellings included patients with various mental disabilities and the elderly, and in general very limited nursing care was provided. All of the beds in the dwellings surveyed were single beds and 29% of the rooms contained two beds, which was the maximum number of beds found in any room. The mean fire load density was calculated to be 593 MJ/m2 with a standard deviation of 109 MJ/m2. The maximum value was 786 MJ/m2 and the minimum value was 379 MJ/m2. The prevalent floor finishing material (95% of the cases) was hardwood flooring; this contributed to the high values on fire load density since the flooring material contributed 40% to the fire load density. When the flooring was excluded, the mean fire load density was calculated to be 356 MJ/m2. All of the bedrooms were of a comparable size to typical secondary bedrooms in residential dwellings with a mean floor area of 11 m2.
Figure 27 shows the major combustible furnishings found in the residential care homes, which were all typical residential furnishings.
3.3 Comparison of Results in Residential Care and Multi-family Dwellings
Table 13 shows a comparison of the floor areas of various rooms in multi-family dwellings, secondary suites and residential care dwellings. The results show that secondary bedrooms in all three types of dwellings are of comparable dimensions. Additionally, the primary bedroom in the secondary suite appears to be of similar dimensions to secondary bedrooms. The size of the living rooms in secondary suites are also smaller than in multi-family dwellings, which is to be expected since secondary suites typically exist within a primary dwelling. Table 13. Comparison of common rooms in secondary suites, multi-family and residential care dwellings Multi-family Dwelling (m2) Secondary Residential Suite (m2) Residential Care Dwelling (m2) Dining Room 9.7 9.0 - Primary Bedroom 16.0 10.8 - Secondary Bedroom 10.0 9.1 11.0 Living room 18.1 14.7 -
A comparison of the calculated mean fire load densities indicates that values in
residential care bedrooms (593 MJ/m2) were the same as in secondary bedrooms in multi-family dwellings (594 MJ/m2). However, the fire load density in residential care bedrooms had a large flooring component since the hardwood flooring was installed in 95% of the cases compared with 18% in multi-family dwellings. Therefore, a fire load density calculated without including the contribution of flooring provides a meaningful indication of the combustible movable contents. In this case, the corresponding fire load densities for residential care bedrooms and secondary bedrooms in multi-family dwellings are 356 MJ/m2 and 478 MJ/m2, respectively. Therefore, residential care bedrooms contain less movable combustible contents due to their transitional nature – many residents arrive from hospital facilities with very limited personal belongings and in addition the owner of the building likely limits the number of furnishing items that residents can accumulate, as well as the level of clutter in order to maintain a clean environment.
Table 14 summarizes the types of combustible contents in both residential dwellings and residential care. The tables clearly show the similarities and combustibles which are specific to a particular room.
Table 14. Typical furnishings found in various rooms
No. Type of furnishing BLR LR DR PB SB RCB
1 Area rug / carpet X X X X X X
2 Audio / video media X X X X
3 Audio / video media display unit X X X
4 Books X X X X X X
5 Ottoman / bench X X X
6 Chair (non-upholstered / dining type) X X X X X
7 Chair (upholstered) X X X X X
8 Loveseat X X X
9 Sofa X X
10 Futon X X
11 Coffee / side tables X X
12 Entertainment unit X X X X X
13 Exercise equipment X X
14 TV (under 27 inches) X X X X X
15 TV (over 32 inches) X X
16 Dining display unit X
17 Dining table X 18 Hutch X 19 Window covering X X X X X X 20 Single bed X X 21 Bunk bed X 22 Double bed X X 23 Queen bed X 24 Crib X X
25 Dresser / drawer chest X X X
26 Laundry basket X X X
27 Night table X X X
28 Plastic storage bin / tote X X X X X
29 Plastic toys X X X
30 Waste paper basket X X X X X
31 Portable stereo / radio X X X
40 Shoes X X X
41 Study desk / table X X X
42 Stuffed toys X X X X
43 Wardrobe / armoire X X X
44 Computer workstation X X X
45 Clothes X X X
Abbreviations: BLR – Basement living room; LR – Living room; DR – Dining room;
PB – Primary bedroom; SB – Secondary bedroom; RCB – Residential care bedroom
4
Case Study: Bedroom Arrangements with a Potentially High Fire Load Density
In view of survey results from this work, which show that bedrooms have potentially higher fire loads compared to most other areas in a dwelling (excluding storage areas), a further analysis of bedroom layouts was conducted in order to identify arrangements of bed sets that could result in high fire load densities. It is assumed that the fire load contribution from all other contents, such as clothing remains comparable. The analysis is based on the results taken from an actual survey of bedroom furniture sold in typical furniture shops. Figures 28 and 29 show two types of primary bedroom layouts based on a mate’s bed and wood frame bed setconfigurations that were displayed. A mate’s bed consists of a wooden foundation incorporating drawers in order to increase storage space. However, from a fire load stand point, this results in a mate’s bed having a significantly greater mass of combustible material compared to other types of foundations using identical mattresses and bedclothes, as shown in Table 15.
In the survey of bedroom contents in a residential dwelling using photographs from the real estate website, there were more instances of mate’s beds observed in secondary bedrooms than in primary bedrooms. Nevertheless, as shown by the photograph in Figure 28 and the results in Table 15, this is an arrangement that is likely to result in a very high fire load density with an estimated value of approximately 560 MJ/m2 based on a 16 m2 room without even including the contribution of flooring finishing materials, clothing, bedclothes and other items. Therefore, this example could, in reality, exceed the 95th percentile fire load density of 753 MJ/m2, which was calculated for primary bedrooms.
Figure 28. Five-piece queen-size bedroom set
(laminated particle board) displayed in a furniture store
Figure 29. Wooden bed frame with
mattress and box spring displayed in a furniture store
Table 15. Component weights for various primary bedroom sets
Item no. Component description Mate’s bed set (Figure 15)
Box spring bed bet (with wood frame) (Figure 16)
Box spring bed Set with no head and foot board
Mass (kg) Mass (kg) Mass (kg)
1 Mate’s bed 98 -
2 Mattress (sprung)1
37 37 37
3 Head board wall unit 150 - -
4 5 drawer chest 57 57 57
5 6 drawer dresser 83 83 83
6 6 drawer armoire 51.5 52 52
7 Box spring - 25 25
8 Solid wood bed frame (with
head and foot boards) - 62
-
Totals 474 (100%) 316 (67%) 254 (54%)
Fire load density in 16 m2 room
(MJ/m2) 560 375 300
1
The combustible mass of the mattress in Figure 28 having an interconnected internal spring design was estimated to be about 40% of the total weight.
In the case of a secondary bedroom, high fire load densities are likely to be obtained with arrangements such as the double-twin wood-frame bunk and drawer chest that is shown in Figure 30. However, a room containing two mate’s beds such as the one shown in Figure 31 could easily exceed the fire density resulting from a bunk bed, which is indicated in Table 16.
Figure 30. Double–twin bunk bed (pine frame)
Table 16. Component weights for various secondary bedroom bed sets
Bunk Bed Set Twin Mate’s Bed Set
Box Spring Bed Set
Item
no. Description
Mass (kg) Mass (kg) Mass (kg) 1 Bunk bed (frame and
drawer chest) 92 - -
2 Double-size Mattress 37 - -
3 Twin-size mattress 17 17 17
4 Box Spring - - 15
5 Mate’s bed - 62 -
6 Mate’s bed head board - 26
7 Lightweight head board - - -
Totals 146 (100%) 105 (72%) 32 (22%)
5
Discussion of Results
Many published fire load surveys have shown that fire loads in houses vary greatly, even within the same geographical location[12, 17 - 19]. The values obtained in the current survey are within the range of values of about 450 MJ/m2 , which have been reported in the literature for the U.S. [19] [12] for living rooms in residential buildings based on a survey conducted 25 years ago. Some engineering design guides [20, 21] recommend single values ranging from 780 MJ/m2 to 900 MJ/m2, which are comparable with the 95th
percentile values calculated for bedrooms in the current survey. Bwalya [6, 22] reviewed fire load densities reported in the literature found that mean values of 610 MJ/m2 and 720 MJ/m2 were reported in surveys conducted in Japan and New Zealand, respectively. Much of the fire load data found in the literature is often dated and generalized for an entire dwelling, whereas this survey has found that the fire load density and the composition of combustible contents varies from room to room. Moreover, changes in fashion trends and materials used for furnishings have likely resulted in differences in the composition of the fire load in present day homes versus 25 years ago. For example, in recent years there has been an increase in the use of materials such as engineered wood products, visco elastic (memory) polyurethane foams in bed systems and upholstery fabrics made with polyester microfibers have gained popularity due to attributes relating to cost-effectiveness (e.g. engineered wood), comfort (e.g. memory foam) and ease of cleaning (e.g. microfiber fabrics). Although there is a general perception that modern day homes contain a greater composition of synthetic materials, there is insufficient information in the literature to
quantify the differences. Therefore, surveys such as this one are important in establishing present day contents in residential dwellings and reducing reliance on outdated fire load data.
6
Conclusion
This survey, which was primarily based on information from a real estate website [1], has provided a substantial insight into the types and quantity of combustible contents found in residential dwellings, as well as the types of floor configurations and other information that is pertinent to fire issues. The results of the survey will be valuable in providing the basis for designing a test facility and fire experiments for the CFMRD project. Typical furnishings that constitute a significant portion of the movable fire load have been identified and possible values of fire load densities have been calculated. Some of the main findings from this survey are that:
1) The main floor in a residential dwelling is of the open-concept design (not compartmented), whereas the upper floor(s) containing bedrooms are highly
compartmented. Basements have a combination of an open-concept layout with some degree of compartmentation depending on their usage.
2) Residential care bedrooms have floor areas having a comparable room size (of about 10 m2) to secondary bedrooms and contain similar types of residential furnishings.
However, the actual moveable fire load (excluding flooring) in residential care bedrooms is less than in secondary bedrooms.
3) Although there was insufficient information on secondary suites, the survey found that these could be considered to be apartments of reduced dimensions with the living room, dining room, kitchen and bedrooms located on the same level.
4) Primary bedrooms and main-floor living rooms have a mean floor area of about 16 m2, whereas basement living rooms have larger floor areas with a mean of around 23 m2. Kitchens, dining rooms and secondary bedrooms have comparable floor areas of about 10 m2.
5) The fire load density and composition of combustible contents varies according to the type of room. The kitchen, dining room and living room have a higher composition of wood compared to bedrooms due to the popularity of hardwood flooring in living and dining rooms, and the presence of heavy wooden cabinets in kitchens.
6) Bedrooms have fire loads consisting of a significant amount of textiles compared to other rooms. The use of mate’s beds and bunk beds likely results in significantly greater combustible fire loads compared with other bed types.
7) The average fire load densities in various rooms were estimated to be (95th percentile values in brackets): Kitchens – 807 (940) MJ/m2; dining rooms – 393 (576) MJ/m2; living rooms – 412 (610) MJ/m2; basement living rooms – 288 (450) MJ/m2; primary
bedrooms – 534 (753) MJ/m2; secondary bedrooms – 594 (846) MJ/m2. Although kitchens have the highest fire load densities the actual fire load (heat content) is lower than bedrooms, which have the highest fire load due to the presence of contents with a high calorific value such as mattresses and carpeting.
8) The fire load density alone does not provide a complete picture of the associated fire hazard since parameters such as floor area and composition of the fire load can affect the total heat energy content and its rate of release during a fire, assuming that other
parameters remain identical.
9)
Windows in living rooms are typically larger (mean of 1.9 m wide x 1.3 m high) than bedroom windows (mean of 1.1 m high x 1.3 m high).6.1 Recommendations for Further Work
Since numeric values of fire load densities do not completely characterize fire behavior, a further understanding of how components of the fire load which are ignited first influence fire growth and how the remainder of the fire load that gets involved during the post-flashover stage affect the fully developed phase of a fire is important in characterizing fires. Therefore, there is a need to conduct additional case studies to evaluate how parameters such as fire load
composition, first item ignited, flooring materials, fire load arrangement and ventilation conditions interact in a fire scenario with a view to identifying scenarios that will likely cause challenging conditions. Particularly in the case of floor finishing materials, hardwood was found to increase the fire load density quite significantly compared with other types of floor finishing materials, such as carpeting. However, it can be expected that there will be differences in burning
characteristics of these two major flooring materials, which could affect the course and impact of a fire.
7
Acknowledgments
The authors kindly acknowledge the contribution of Shameea Nowsin and Brandon Caldwell, co-op students from Ottawa University, who were involved in collecting and analyzing
some of the survey data, as well as the Montreal Fire Services for facilitating the survey in residential care dwellings.
8
References
1) http://www.grapevine.on.ca/. The Grape Vine Home Marketing Consultants, Real-estate website, accessed: 2006 – 2007.
2) http://www.faithwilson.com . Real-estate website, accessed: 2007. 3) http://www.petershandera.com, real-estate website, accessed: 2007 4) http://www.getleo.com. Real estate website, accessed: 2007
5) http://www.remax-oa.com/FindProperty/Newfoundland.asp. Real-estate website, accessed: 2007.
6) Bwalya, A. C., Sultan, M. A., and Bénichou, N., 2004, A Pilot Survey of Fire Loads in Canadian Homes. Research Report no 159. Institute for Research in Construction, National Research Council Canada, pp. 24, Ottawa, Ontario, Canada.
7) Bwalya, A. C., 2004. An Extended Survey of Combustible Contents in Canadian
Residential Living Rooms. Institute for Research in Construction, Research Report IRC-RR-176, National Research Council Canada , pp. 25, Ottawa, Ontario, Canada.
(November 5).
8) Babrauskas, V., Lawson, R. J., Walton , W. D., and Twilley, W. H., 1982, Upholstered Furniture Heat Release Rates Measured With a Furniture Calorimeter, NBSIR 82-2604, US Dept of Commerce, National Bureau of Standards, USA.,
9) Sundström, B. (ed.), “Fire Safety of Upholstered Furniture - The Final Report of the CBUF Research Programme”, Report EUR 16477 EN, Directorate-General Science, Research and Development (Measurements and Testing), European Commission, Interscience Communications Ltd, London, 1995.
10) Sardqvist, S., 1993, Initial Fires: RHR, Smoke Production and CO Generation From Single Items and Room Fire Tests, Department of Fire Safety Engineering, Lund University, Lund, Sweden, ISRN LUTVDG/TVBB-3070-SE.
11) Hietaniemi, J., Mangs, J. and Hakkarainen, T., 2001, Burning of Electrical Household Appliances: An Experimental Study, VTT Technical Research Centre of Finland, Building Technology, VTT Research Notes 2084, Finland.
12) Issen, L. A., 1980, Single-Family Residential Fire and Live Loads Survey. National Bureau of Standards, Washington D.C., USA.
14) National Research Council of Canada, 1990, National Building Code of Canada (NBCC) – Part 9, Ottawa, Ontario, Canada.
15) Buchanan, A. H, 2001,Structural Design for Fire Safety, Wiley, New York.
16) Mehaffey, J. R., 1999, Performance-Based Design for Fire Resistance in Wood-Frame Buildings, InterFlam 1999, p.293-304.
17) Yii, H. W. Jennifer, 2000, Effect of Surface Area and Thickness on Fire Loads, University of Canterbury Research Report 00/13, New Zealand.
18) Kose, S., Morishita, Y.; Hagiwara, I. and Tsukagoshi, I., 1988, Survey of Movable Fire Load in Japanese Dwellings, Fire Safety Science-Proceedings of the Second
International Symposium, p. 403-412 .
19) Fang, J. B. and Breese, J. N., 1980. Fire development in residential basement rooms. National Bureau of Standards, Washington, D.C., USA.
20) Fire Code Reform Centre Limited, Fire Engineering Guidelines, 1990.
21) Thomas, P. H. Coordinator, 1986, Design Guide: Structural Fire Safety - Workshop CIB W14, Fire Safety Journal, Vol.10, No.2 CIB W14 Workshop , p.77-137.
22)
Bwalya, A. C., Bénichou, N., and Sultan, M. A., 2003, Literature Review on Design Fires, Research Report IRC-RR-137, National Research Council Canada, Institute for Research in Construction, Ottawa, Canada.Appendix A: Results of Furniture Survey and Values of Weight and Heat of
Combustion Used in Calculating Fire Load Densities
Table A-1. Weights of typical household furnishing obtained from a furniture store
Weight (kg) Item
Mean Minimum Maximum
Twin-size mate’s bed (foundation) 57.0 52.6 61.5
Twin-size mattress 15.8 12.8 23.2
Queen-size mate’s bed (foundation) 98.3 - - Queen-size box spring 21.9 19.7 25.3 Queen-size mattress 31.6 24.6 36.65
King-size mattress 47.35 - -
King-size box spring 29.5 - -
Bed in a bag (comforter, pair of sheet,
pillow cases) 8.0 - -
Night table 26.0 17.2 29.5
Linen chest 31.2 - -
Drawer chest 56.6 47.0 60.0
Dresser 74.5 66.0 82.0
Futon (wood frame) 33.6 - -
Armoire 46.6 42.0 52.0 Dining table 61.9 - - Sofa 56.8 52.5 65.5 Loveseat 44.3 40.7 51.7 Ottoman 23.0 12.2 33.8 Chair (upholstered) 26.7 12.0 37.0 Chair (dining) 9.75 9.3 10.3 Side table 17.35 15.5 19.2 Computer desk 36.9 14.0 41.0 Computer chair 9.0 5.6 15 27 inch TV (CRT) 36.6 - - 51 inch Projection TV 75.5 - -
Table A-2. Weight and heat of combustion values
Item # Furniture Type Relative Size Calorific Value
1 - Small 2- Medium 3- Large (MJ/kg) 1 14 inch CRT TV 10.0 10.0 10.0 25 2 20 inch CRT TV 16.0 15.0 15.0 25 3 27 inch CRT TV 35.0 35.0 35.0 25 4 32 inch CRT TV 67.0 67.0 67.0 25 5 40 inch + LCD/Plasma TV 50.0 50.0 50.0 25 6 40 inch+ Projection TV 75.7 75.7 95.0 25 8 Air Hockey Table 30.0 30.0 30.0 20 9 Animal skin wall decoration 3.0 3.0 3.0 20 10 Area rug 5.0 15.0 30.0 20 11 Audio tape 0.1 0.1 0.1 20 12 Bunk bed 50.0 75.0 100.0 20 13 Bath towels 1.0 1.5 2.0 20
14 Blinds 4.0 4.0 4.0 20
15 Blower heater (plastic case) 2.0 2.0 2.0 20
16 Book 0.5 1.0 2.0 18
17 Cardboard box 1.0 1.0 1.0 19 18 Cardboard box filled with toys 15.0 15.0 15.0 20
19 Carpet and under-pad (kg/m2) 3.1 3.9 4.3 26 20 Carton box 1.0 1.0 1.0 18
21 CD case 0.3 0.3 0.3 20
22 CD/DVD display 5.0 10.0 15.0 20 23 Chair - leather no arm rests 10.0 10.0 10.0 20 24 Chair - plastic garden chair 5.0 5.0 5.0 20 25 Chair - wooden no padding 8.0 10.0 12.0 18 26 Chair (dining) - metal frame 8.0 10.0 12.0 20 27 Chair (dining) - wood frame 9.3 9.9 10.3 20 28 Chair leather 12.0 26.8 37.1 20 29 Chair upholstered 12.0 26.8 37.1 20 30 Clothes in closet (built-in) 40.0 60.0 125.0 20 31 Coffee table 23.3 23.3 26.0 18 32 Computer Chair - executive leather 12.0 15.0 20.0 20 33 Computer Chair - regular upholstered 6.0 10.0 15.0 20 34 Computer CPU 10.0 10.0 10.0 20 35 Computer desk (wooden) 14.3 37.0 55.5 18 36 Computer keyboard, mouse, pad 1.0 1.0 1.0 20 37 Computer monitor ( LCD) 4.0 5.0 8.0 20 38 Computer monitor (CRT) 10.0 10.0 10.0 20 39 Curtain 2.0 3.0 4.0 20 40 Dehumidifier 5.0 5.0 5.0 20 41 Double bed 65.4 72.8 84.7 20 42 Drapes 2.0 3.0 4.0 18 43 Drawer chest 47.9 54.8 60.0 18 44 Dresser 66.3 74.5 82.6 18
Item # Furniture Type Relative Size Calorific Value
1 - Small 2- Medium 3- Large (MJ/kg)
45 DVD case 0.3 0.3 0.3 20
46 DVD player 2.0 2.0 3.0 20 47 Entertainment unit 37.5 61.5 85.5 18 48 Fabric folding chairs 5.0 5.0 5.0 20 49 Fabric toy bin filled with stuffed and plastic toys 20.0 20.0 20.0 20 50 Foam cushion - polyurethane 1.5 1.5 1.5 20 51 Foam cushions - stacked 5.0 5.0 5.0 20 52 Framed pictures/paintings 1.0 1.0 1.0 20 53 Garbage bag with clothes 8.0 8.0 8.0 20 54 Heap of clothes 8.0 8.0 8.0 20 55 Heap of clothes on bed 5.0 5.0 5.0 20 56 Heap of curtains 10.0 10.0 10.0 20 57 Heap of linen 10.0 10.0 10.0 20 58 Home theatre system (many speakers) 15.0 15.0 15.0 20 59 Ironing table 5.0 5.0 5.0 20 60 King-size bed 76.9 76.9 135.0 20 61 Kleenex box 0.5 0.5 0.5 20 62 Ladies handbag 0.2 0.2 0.2 20 63 Large plastic toy (pushing and ride-on types) 1.0 1.0 1.0 20 64 Love seat - leather 40.7 44.5 51.7 20 65 Love seat - upholstered 40.7 44.5 51.7 20 66 Night table 17.2 26.0 49.0 20 67 Paper towel 0.5 0.5 0.5 20 68 Plastic clothes rack/bin 10.0 10.0 10.0 20 69 Plastic doll/toy 0.5 0.5 0.5 20 70 Plastic garden chair with heaped cloth/towels 15.0 15.0 15.0 20 71 Plastic laundry basket 15.0 15.0 15.0 20 72 Plastic laundry hamper 15.0 15.0 15.0 20 73 Plastic storage bin 3.0 3.0 3.0 20 74 Plastic storage bin 3.0 3.0 3.0 20 75 Plastic storage bin filled with toys 20.0 20.0 20.0 20 76 Plastic tool storage boxes 4.0 4.0 4.0 20 77 Plastic waste basket 1.0 1.0 1.0 20 78 Pool table 115.0 115.0 115.0 20 79 Portable stereo 5.0 5.0 5.0 20
80 Printer 5.0 5.0 5.0 20
81 Queen bed 44.3 57.6 134.9 20 82 Rocking wooden chair - padded 20.0 20.0 20.0 20
83 Shoes 1.0 1.0 1.0 20
84 Shopping paper bags 5.0 5.0 5.0 18 85 Shopping plastic bags 5.0 5.0 5.0 20 86 Side table 15.5 22.9 33.8 20 87 Single mate’s bed type 30.0 45.0 80.0 18 88 Single bed no box spring 30.0 30.0 30.0 20