HAL Id: hal-02871198
https://hal.sorbonne-universite.fr/hal-02871198
Submitted on 17 Jun 2020
HAL is a multi-disciplinary open access
archive for the deposit and dissemination of
sci-entific research documents, whether they are
pub-lished or not. The documents may come from
teaching and research institutions in France or
abroad, or from public or private research centers.
L’archive ouverte pluridisciplinaire HAL, est
destinée au dépôt et à la diffusion de documents
scientifiques de niveau recherche, publiés ou non,
émanant des établissements d’enseignement et de
recherche français ou étrangers, des laboratoires
publics ou privés.
OSIRIS-REx spectral analysis of (101955) Bennu by
multivariate statistics
M. Barucci, P. Hasselmann, A. Praet, M. Fulchignoni, J. Deshapriya, S.
Fornasier, F. Merlin, B. Clark, A. Simon, V. Hamilton, et al.
To cite this version:
M. Barucci, P. Hasselmann, A. Praet, M. Fulchignoni, J. Deshapriya, et al.. OSIRIS-REx spectral
analysis of (101955) Bennu by multivariate statistics. Astronomy and Astrophysics - A&A, EDP
Sciences, 2020, 637, pp.L4. �10.1051/0004-6361/202038144�. �hal-02871198�
https://doi.org/10.1051/0004-6361/202038144 c M. A. Barucci et al. 2020
Astronomy
&
Astrophysics
L
ETTER TO THEE
DITOROSIRIS-REx spectral analysis of (101955) Bennu by multivariate
statistics
M. A. Barucci
1, P. H. Hasselmann
1, A. Praet
1, M. Fulchignoni
1, J. D. P. Deshapriya
1, S. Fornasier
1,2, F. Merlin
1,
B. E. Clark
3, A. A. Simon
4, V. E. Hamilton
5, J. P. Emery
6, E. S. Howell
7, J. R. Brucato
8, E. A. Cloutis
9, X. D. Zou
10,
J.-Y. Li
10, P. Michel
11, S. Ferrone
3, G. Poggiali
8,12, D. C. Reuter
4, D. N. DellaGiustina
7, and D. S. Lauretta
71 LESIA, Observatoire de Paris, Université PSL, CNRS, Université de Paris, Sorbonne Université, 92195 Principal Cedex Meudon,
France
e-mail: antonella.barucci@obspm.fr
2 Institut Universitaire de France (IUF), Paris, France
3 Department of Physics and Astronomy, Ithaca College, Ithaca, NY 14850, USA 4 NASA Goddard Space Flight Center, Greenbelt, MD, USA
5 Southwest Research Institute, Boulder, CO, USA
6 Department of Astronomy and Planetary Science, Northern Arizona University, Flagstaff, AZ, USA 7 Lunar and Planetary Laboratory, University of Arizona, Tucson, AZ, USA
8 INAF Astrophysical Observatory of Arcetri, Florence, Italy
9 Department of Geography, University of Winnipeg, Winninpeg, Canada 10 Planetary Science Institute, Tucson, AZ, USA
11 Université Côte d’Azur, Observatoire de la Côte d’Azur, CNRS, Laboratoire Lagrange, Nice, France 12 University of Florence, Department of Physics and Astronomy, Firenze, Italy
Received 10 April 2020/ Accepted 1 May 2020
ABSTRACT
Contact.The NASA New Frontiers asteroid sample return mission Origins, Spectral Interpretation, Resource Identification, and Security–Regolith Explorer (OSIRIS-REx) has provided a large amount of data on the asteroid (101955) Bennu, including high-quality spectra obtained by the OSIRIS-REx Visible and InfraRed Spectrometer (OVIRS).
Aims.To better constrain the surface properties and compositional variations of Bennu, we studied the visible and near-infrared spectral behavior across the asteroid surface by means of a statistical analysis aiming to distinguish spectrally distinct groups, if present.
Methods.We applied the G-mode multivariate statistical analysis to the near-infrared OVIRS spectra to obtain an automatic statistical clustering at different confidence levels.
Results.The statistical analysis highlights spectral variations on the surface of Bennu. Five distinct spectral groups are identified at a 2σ confidence level. At a higher confidence level of 3σ, no grouping is observed.
Conclusions.The results at a 2σ confidence level distinguish a dominant spectral behavior group (group 1, background) and four small groups showing spectral slope variations, associated with areas with different surface properties. The background group contains most of the analyzed data, which implies a globally homogeneous surface at the spectral and spatial resolution of the data. The small groups with redder spectra are concentrated around the equatorial ridge and are associated with morphological surface features such as specific craters and boulders. No significant variation is detected in the band area or depth of the 2.74 µm band, which is associated with hydrated phyllosilicate content. The spectral slope variations are interpreted as a consequence of different regolith particle sizes, and/or porosity, and/or space weathering, that is, the presence of more or less fresh material. The OSIRIS-REx mission primary sampling site, Nightingale, and a boulder known as the Roc, are redder than the background surface.
Key words. minor planets, asteroids: individual: (101955) Bennu – methods: statistical – instrumentation: spectrographs
1. Introduction
The NASA asteroid sample return mission Origins, Spectral Interpretation, Resource Identification, and Security–Regolith Explorer (OSIRIS-REx) was launched on September 8, 2016, and arrived at the near-Earth asteroid (101955) Bennu on December 3, 2018. The primary objective of the mission is to collect and return to Earth a pristine sample from Bennu. For asteroid characterization and sample site selection, the OSIRIS-REx spacecraft carries two camera suites (OCAMS and
TAGCAMS), a laser altimeter (OLA), and two hyperspectral point spectrometers (OVIRS and OTES), along with a student-led X-ray imaging spectrometer (REXIS) (Lauretta et al. 2017). The initial observations of Bennu confirmed its spinning-top shape (i.e., a spheroid with an equatorial bulge), as expected from the inversion of Earth-based radar data (Nolan et al. 2013;
Lauretta et al. 2015), with a mean diameter of 490.06 ± 0.16 m, a
sidereal rotational period of 4.296057 ± 0.000002 h, and a global geometric albedo of 4.4 ± 0.2% (Lauretta et al. 2019a). Track-ing the spacecraft usTrack-ing NASA Deep Space Network, combined
Open Access article,published by EDP Sciences, under the terms of the Creative Commons Attribution License (https://creativecommons.org/licenses/by/4.0),
A&A 637, L4 (2020)
with navigation images from the spacecraft, allowed determining the mass of Bennu and deriving a low density of 1190±13 kg m−3
(Scheeres et al. 2019;Barnouin et al. 2019).
Bennu is classified as a B-type asteroid. This type of aster-oid is thought to be analogous to organic-rich, hydrated car-bonaceous chondritic meteorites (Clark et al. 2011) and may have contributed to the supply of water and organic material that were essential for the emergence of life on Earth. Obser-vations by OCAMS revealed a surface rich in craters, boulders with a wide range of sizes and unexpectedly broad albedo vari-ations, and different regolith particle sizes (DellaGiustina et al. 2019). The boulder population varies in morphology and distri-bution, which may indicate variable effects of surface processes or may be linked to the formation of Bennu from the catas-trophic disruption of its parent body. The analysis of the four OCAMS/MapCam filters shows spectral photometric variations associated with geologic features, including boulders, craters, and areas of mass flow (DellaGiustina et al. 2020). Moreover, a few very bright boulders of several meters were discovered
by DellaGiustina et al. (2020) in the high-resolution images
acquired by OCAMS; the detection of pyroxene in OVIRS spec-tra collected on these boulders confirmed a subordinate presence of exogenic material.
OVIRS acquired reflectance spectra from 0.4 µm to 4.3 µm, showing blue spectra (negative spectral slopes with respect to the Sun), with a deep absorption band of hydrated phyllosilicates at 2.74 ± 0.01 µm typical of CI and CM meteorites (Hamilton et al. 2019). The analogy with these meteorites is also confirmed by OTES, which operates from 5.7 to 100 µm at lower spatial reso-lution (Hamilton et al. 2019).
OSIRIS-REx has performed several mission phases with dif-ferent observation strategies to best characterize Bennu and the prospective sampling sites. The Detailed Survey (DS) phase started with the Baseball Diamond subphase of flybys from March to April 2019, which was followed by the Equatorial Sta-tions subphase from April to June, during which the asteroid was observed at multiple local solar times. Starting in October 2019 and extending into spring 2020, Reconnaissance (Recon A, B, and C) observations obtained the highest spatial resolution data of the candidate sampling sites identified from the DS data (Lauretta et al. 2017).
Here we use a multivariate statistical method to analyze the OVIRS spectra (level L3c) obtained at DS equatorial sta-tion 3 (EQ3). We selected EQ3 for analysis because it is the best-quality OVIRS dataset (at maximum solar illumination) that provides near-global coverage. We investigate the possible spec-troscopic heterogeneity on the surface of Bennu, as we have done previously for asteroid (162173) Ryugu using data obtained by the JAXA Hayabusa2 mission (Barucci et al. 2019).
2. Data analysis
2.1. OVIRS data
The OVIRS instrument is a hyperspectral point spectrometer working in the spectral region from 0.4 to 4.3 µm with a circular 4 mrad field of view (FOV;Reuter et al. 2018, andSimon et al. 2018). During EQ3, the spacecraft was located approximately above the equator, scanning north-south at several local solar times of the day. EQ3 occurred on May 9, 2019, at local time 12:30 pm, which allowed us to obtain the best available homoge-neous observations for a complete map of the surface of Bennu. The spacecraft was at a distance of 4.8 km from the surface of
Bennu, covering phase angles ranging from 7◦.75 to 10◦.37.
Dur-ing this station, 17 790 spots were observed with a spatial resolu-tion per spot of about 20 m cross-track and 30m along-track. We selected all the spectra with a fill factor=1, i ≤ 70◦and e ≤ 70◦ for a total of 7151 spectra.
The data were calibrated as described bySimon et al.(2018) and corrected for illumination conditions using the shape model v20 (Barnouin et al. 2019) and the Akimov disk function model
(Shkuratov 2011, Zou et al., in prep.), and the thermal tail was
removed (Emery et al. 2019;Hamilton et al. 2019).
For our analysis, we filtered the spectral range from 0.5 to 3.3 µm to avoid low-quality data and potential influence of ther-mal removal at longer wavelengths. We used as variables the spectral reflectance (normalized at 0.55 µm) at 24 wavelengths (0.5, 0.55, 0.6, 0.7, 0.8, 1, 1.2, 1.5, 1.7, 2.0, 2.2, 2.3, 2.5, 2.6, 2.67, 2.7, 2.73, 2.74, 2.77, 2.8, 3.0, 3.1, 3.2, and 3.3 µm) cho-sen from those that are the most significant for band detection and eliminating those with a possible overlap of order residuals after smoothing (to avoid point-to-point noise). The smoothing was performed using a Savitzky-Golay filter (Savitzky & Golay 1964) with a polynomial of third order and a running box of five channels. A detailed analysis of the spectral region 3.0–3.6 µm is in progress (Kaplan et al. 2020).
2.2. G-mode multivariate statistical method
To investigate the surface compositional variation of Bennu, we applied the G-mode multivariate method (Gavrishin et al. 1992), which is widely used in planetary science, including recently for comet 67P/Churyumov-Gerasimenko using data obtained by the ESA Rosetta mission (Perna et al. 2017) and for Ryugu using data obtained by Hayabusa2 (Barucci et al. 2019).
The advantage of the method is that it allows the user to obtain an automatic statistical clustering of a sample con-taining N objects (in this work, the spectra) described by M variables (24 normalized reflectances at the selected set of wavelengths) in terms of homogeneous groups without any a priori criteria and taking the instrumental errors into account in measuring each variable. The original multivariate sample is collapsed into a univariate sample through successive transfor-mations. The membership of an object in a given group (the selection criteria) is based on the statistical inference rules. The confidence level defines the probability of accepting the hypoth-esis that an object belongs to the given group, and this is the only a priori choice in the decision process. The objects belonging to each group follow a Gaussian distribution normalized to mean 0 and standard deviation 1. The user selects the confidence level that corresponds to a given critical value q1: the higher q1, the less detailed the classification. If the user wishes to classify the whole sample with a 99.7% probability of making the correct decision in inserting a sample into a group, the critical value of q1 has to be 3.00, which is the value corresponding to the 3σ level of a standardized normal distribution (i.e., a probability of misclassifying 0.3% of the samples).
When a lower confidence level is chosen, the probability of making an incorrect decision increases, but a more detailed clas-sification is also possible. The method also indicates the relative importance of the variables in separating the groups. We were unable to classify a few spectra because their spectral behav-ior is highly different from that of the identified groups. For a detailed description of the method, we refer toBarucci et al. (1987,2019).
a)
b)
c)
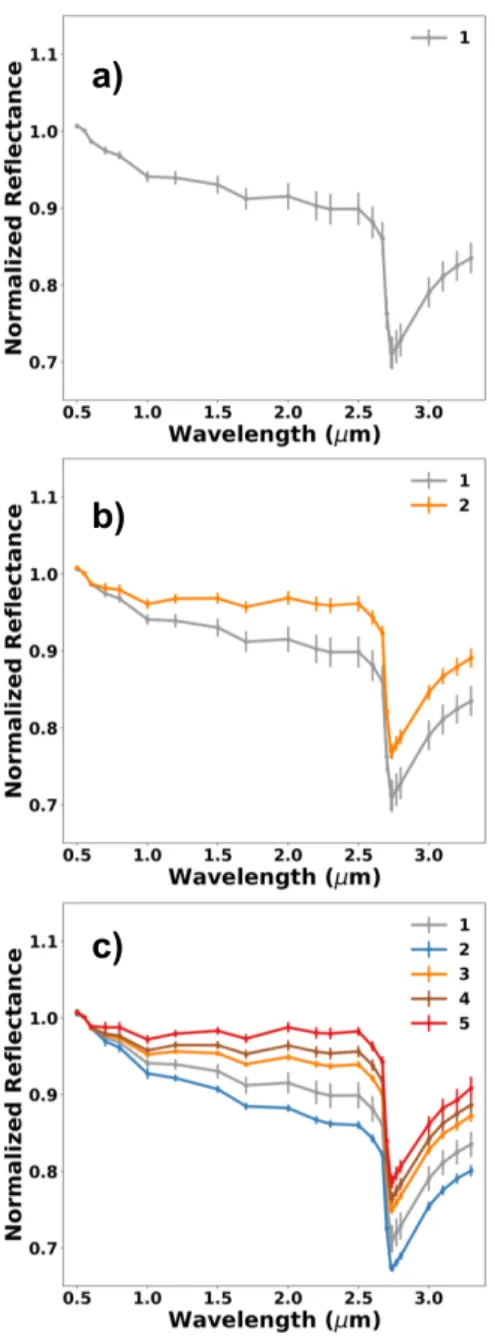
Fig. 1.Average value of variables (normalized reflectance at 0.55 µm of the selected wavelengths) in groups identified from the OVIRS global data analysis: (a) average spectrum of the only groups obtained at a 3σ confidence level, (b) average spectra of the two groups distinguishable at a 2.7σ confidence level, and (c) average spectra of the five groups that can be distinguished at a 2.0σ confidence level. The error bar cor-responds to the standard deviation of the distribution of the spectra in each group and at each wavelength.
3. Results
We started our analysis of the 7151 spectra from EQ3 by choos-ing a confidence level 3σ, and we obtained only one spectral group (Fig.1a). This implies a surface with globally homoge-neous spectral properties. The spectra split into two groups only at 2.7σ confidence level (Fig.1b), which implies a misclassifica-tion probability of 0.7%. At this confidence level, the first group (hereafter called background) contains most of the data (98%) and has a blue mean spectrum. The smaller group contains spec-tra whose behavior is different from that of the background; this group represents only 2% of the data. The average spectrum of the second group is less blue (flatter slope).
A finer subdivision is apparent when the confidence level is settled at 2.0σ, which implies a misclassification probability of 4.5%. The five groups at this confidence level are well sepa-rated, and the mean of each is shown in Fig.1c. The differences among these groups are mainly due to the variation in the spec-tral slope; the relative histograms are shown in Fig. 2. Group 1 (background) again contains most of the spectra (89%), an the other four groups constitute smaller fractions. The obtained groups are distinguished by their different spectral slopes mainly in the range from 1.0 to 2.5 µm. Group 2 (represented in blue in Fig. 1c) has a bluer slope and high reflectance. It contains about 4.5% of the total data. The other three groups (groups 3 to 5) show flatter spectral slopes (less blue) and lower mean reflectance (Figs.2and3) than the background and contain 4%, 2%, and 0.5% of the total data. The reddest group (group 5), with a spectrally flat behavior, is the smallest group.
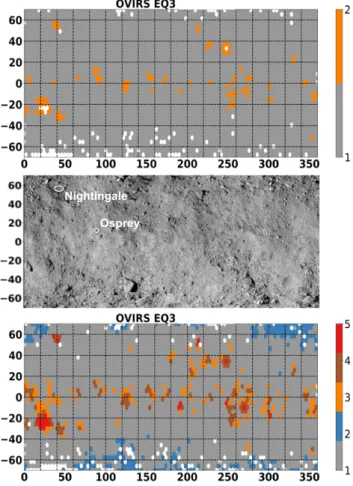
The map in Fig. 4 shows the surface distributions of the five groups. Groups 3 to 5 (with redder spectra) are distributed around the equator; at a large boulder called the Roc (centered at latitude −24◦, longitude 28◦); in the two preselected sample sites: Nightingale (latitude 56◦, longitude 43◦) and Osprey
(lat-itude 11◦, longitude 88◦); at a large crater of 160 m diameter (centered at latitude −8◦, longitude 269◦); and in an area with
higher abundance of large boulders (around latitude −20◦, lon-gitude 250◦), as identified byWalsh et al.(2019).
A different clustering analysis is in progress using the four-color-filter data obtained in the visible by MapCam (Rizos et al. 2019). The preliminary results obtained on some specific areas also shows five clusters for which the main variation is connected to albedo.
4. Discussion and comparison with Ryugu
The interpretation of the five identified groups is not obvious because many properties and processes overlap (particle size, porosity, space weathering, geometry effects, and temperature). Space weathering can contribute to changes in spectral slope and albedo. The red slopes might also be attributable to smaller par-ticle size or different surface porosity. Laboratory analyses of carbonaceous chondrites (e.g., Cloutis et al. 2018) have shown a correlation between particle size and spectral slope: powdered samples with smaller particle size have redder spectra than those with larger particle sizes, and they are less compact. Stronger effects are observed in the near-infrared than in the visible wave-lengths. The contribution of space weathering is not easily dis-tinguished from particle size. No clear shift has been detected for the center of the band at 2.74 µm in our groups, as expected for space weathering at these wavelengths (Lantz et al. 2015,2017).
Deshapriya et al.(2020) performed an analysis at higher
spec-tral resolution (Recon A data) inside the Nightingale crater and detected a shift of the spectral center of band at 2.74 µm toward shorter wavelengths in comparison to the mean spectrum taken out of the border of the crater. This was interpreted, follow-ing laboratory experiments (Lantz et al. 2015,2017) on irradi-ated carbonaceous chondrites, as fresher material (less altered by space weathering).
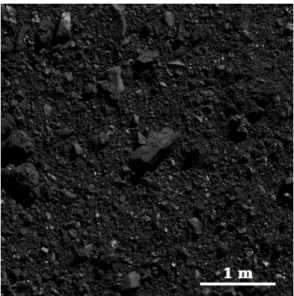
The Nightingale and Osprey prime and backup sampling sites are part of groups with redder slopes. We interpret the red-der spectra as indicative of smaller particle sizes and possibly of relatively fresh material. Nightingale, part of the reddest group (group 5), is known to have millimeter-scale grains from high-resolution Recon imaging (Fig.5).
A similar statistical analysis was carried out on the data of the top-shaped C-type asteroid Ryugu (Watanabe et al. 2019)
A&A 637, L4 (2020)
a)
b)
Fig. 2.Distribution of the slope of all spectra obtained for each of the five groups for q1= 2.0σ: (a) spectral slope between 0.5 and 1.0 µm, and (b) spectral slope between 1 and 2.5 µm. The color code is the same in both panels.
Fig. 3.Distribution of the reflectance measured at 0.55 µm of the spectra for each of the five obtained groups with q1= 2.0σ confidence level. The reddest spectral group (group 5) has the lowest reflectance.
and obtained similar results (Barucci et al. 2019), although the spectra are different from those of Bennu. Bennu appears slightly more spectrally homogeneous than Ryugu because Ryugu showed two groups at the 3σ confidence level. Ryugu has a red slope with a smaller hydrated band at 2.72 µm asso-ciated with Mg-rich phyllosilicates (Kitazato et al. 2019). The groups detected around the equator have a bluer slope than the background. This slope has been associated with fresher mate-rial that is less strongly altered by space weathering (Sugita et al. 2019). The spectral characteristics of groups localized around the equator on Ryugu behave differently than the groups detected around the equator of Bennu, which are redder than the back-ground. At the current spin rate of the asteroid, the motion of material on Ryugu is away from the equator (Watanabe et al.
2019; Sugita et al. 2019), which is the opposite of Bennu
(Scheeres et al. 2019). The evidence on both asteroids that di ffer-ent spectral groups are localized on the equator might be a sign of different resurfacing directions and possibly different effects of space weathering (darkening and reddening, or brightening and blueing) that is correlated with the initial albedo and com-position (Lantz et al. 2017).
5. Conclusions
From the results of the multivariate statistical analysis of OVIRS spectral (visible and near-infrared) data of Bennu, we confirm small spectral variations evident in the detection of statistically
Nightingale Osprey
Fig. 4. Cylindrical projection maps of Bennu’s surface: geographic distribution of the two groups (grey and orange) obtained at a 2.7σ confidence level (top), map of the surface with craters and fea-tures generated from mosaicked V-band images as described by
DellaGiustina et al.(2019) (center), and geographic distribution of the five groups obtained at 2.0σ confidence level (bottom). White dots indi-cate data that are not available or not classified.
different spectral groups, whose number increases as the con-fidence level decreases. The statistical analysis of the spectral data at 3σ confidence level indicates a homogeneous surface at the spectral and spatial resolution (20 × 30 m/spot) of the data. Slightly different areas comprising only about 2% of the ana-lyzed data are separated into their own group at a confidence level of 2.7σ. When the confidence level is lowered to 2.0σ, four
Fig. 5.Portion of the primary sample site, Nightingale (field of view, 4 m), imaged by the OCAMS/PolyCam camera (Rizk et al. 2018) on March 3, 2020, from a distance of 0.3 km. The image was obtained dur-ing the mission Recon C phase. The targeted touchdown point is visible in the lower left quadrant, southwest of the rock (70 cm long) in the center of the image.
groups are detected that comprise about 11% of the dataset and are well separated from the predominant group, the background. This shows that in general, Bennu has a global homogeneous surface at the resolution of the data we used, although some areas are characterized by clear variations on the spectral slopes. The identified groups show very small variation in the depth of the 2.74 µm band, which implies a uniform content of hydrated phyllosilicates.
The different spectral slopes characterizing the identified sta-tistical groups may be explained by differing particle size and porosity in the corresponding regions. Our analysis confirms that Bennu is an asteroid with a globally homogeneous surface in terms of spectral properties, although a few small regions show different degrees of variations. On the basis of our analysis, we suggest that the areas containing groups with redder (less blue) spectral slopes correspond to surface zones where the regolith is composed of particles with smaller sizes. Our work supports the sampling site selection: we confirm with the multivariate sta-tistical analysis that the Nightingale area has the reddest spec-tra, implying the smallest particle sizes and possibly the freshest material. Analysis of the Recon phase observations will allow us to distinguish more variations at better spatial resolution.
These observations strongly suggest that the surface equato-rial area is composed in general of mateequato-rial with smaller particle sizes, and/or higher porosity, and/or fresher material.
Although the spectra themselves differ, the results for Bennu and Ryugu (Barucci et al. 2019) show consistent color trends when the likely motion of material away or toward the equator is considered. Part of the equatorial regions of Ryugu, from which material moves away in the current epoch, have bluer spectra than the background, whereas the areas around the equatorial ridge of Bennu, to which material is currently directed, appear spectrally redder than the background. Bennu is slightly more spectrally homogeneous than Ryugu because a lower confidence level was needed to distinguish any groups on Bennu. The mod-est heterogeneity detected at this spatial resolution on the sur-faces of Bennu and Ryugu is important to better understand the evolution of these two bodies. Bennu and Ryugu are
rubble-pile asteroids, and the surface spectral variations are important to constrain their collisional and surface motion history.
Although different parameters (particle size, porosity changes due to accumulation or removal of material from the equator) can influence the different spectral behavior around the equator in comparison to the background spectra (redder for Bennu and bluer for Ryugu), we cannot exclude the possibil-ity that differing effects of space weathering may be at work. This would indicate different original compositions or different thermal histories of the same composition.
Hayabusa2 and OSIRIS-REx are expected to return pristine samples of the two asteroids to Earth in late 2020 and 2023, respectively. Laboratory analysis of the return samples will offer unique information on the nature of the two asteroids, their ori-gin, and their evolution. Laboratory analysis of the samples will also allow direct detection of space weathering for ground truth to better interpret the surface composition from remote-sensing observations.
Acknowledgements. We are grateful to the entire OSIRIS-REx Team for mak-ing the encounter with Bennu possible. This material is based on work supported by NASA under Contract NNM10AA11C issued through the New Frontiers Program. MAB, PHH, AP, MF, JDPD, SF, FM and PM acknowledge funding support from CNES. PHH acknowledges funding support by the DIM ACAV+ program of the Region Ile de France. JRB and GP were supported by Italian Space Agency grant agreement n. 2017-37-H.0. PM acknowledges funding sup-port from the European Union Horizon 2020 research and innovation programme under grant agreement No 870377 (project NEO-MAPP), as well as Academies of Excellence: Complex systems and Space, environment, risk, and resilience, part of the IDEX JEDI of the Université Côte d’Azur. The authors acknowledge C.W.V. Wolner for her precious support.
References
Barnouin, O. S., Daly, M. G., Palmer, E. E., et al. 2019,Nat. Geosci., 12, 247
Barucci, M. A., Capria, M., Coradini, A., et al. 1987,Icarus, 72, 304
Barucci, M. A., Hasselmann, P. H., Fulchignoni, M., et al. 2019,A&A, 629, A13
Clark, B. E., Binzel, R. P., Howell, E. S., et al. 2011,Icarus, 216, 462
Cloutis, E. A., Pietrasz, V. B., Kiddell, C., et al. 2018,Icarus, 305, 203
DellaGiustina, D. N., Emery, J. P., Golish, R. D., et al. 2019,Nat. Astron., 3, 341
DellaGiustina, D. N., Golish, D. N., & Burke, K. N. 2020,LPSC, 2363
Deshapriya, J. D. P., Barucci, M. A., Bierhaus, E. B., et al. 2020, Icarus, submitted
Emery, J. P., Rozitis, B., & Christensen, P. R. 2019, EPSC-DPS2019-304-1 Gavrishin, A. I., Coradini, A., & Cerroni, P. 1992,Earth Moon Planets, 59, 141
Hamilton, V. E., Simon, A. A., Christensen, P. R., et al. 2019,Nat. Astron., 3, 332
Kaplan, H. H., Simon, A. A., & Emery, J. P. 2020,LPSC, 1050
Kitazato, K., Milliken, R., Iwata, T., et al. 2019,Science, 364, 272
Lauretta, D. S., Bartels, A. E., Barucci, M. A., et al. 2015,Meteorit. Planet. Sci., 50, 834
Lauretta, D. S., Balram-Knutson, S. S., Beshore, E., et al. 2017,Space Sci. Rev., 212, 925
Lauretta, D. S., DellaGiustina, D. N., Bennett, C. A., et al. 2019a,Nature, 568, 55
Lauretta, D. S., Antreasian, P., & Bartels, A. E. 2019b, EPSC-DPS2019-711 Lantz, C., Brunetto, R., Barucci, M. A., et al. 2015,A&A, 577, 41
Lantz, C., Brunetto, R., Barucci, M. A., et al. 2017,Icarus, 285, 43
Nolan, M. C., Magri, C., Howell, E. S., et al. 2013,Icarus, 226, 629
Perna, D., Fulchignoni, M., Barucci, M. A., et al. 2017,A&A, 600, 115
Reuter, D. C., Simon, A. A., Hair, J., et al. 2018,Space Sci. Rev., 214, 54
Rizk, B., Drouet d’Aubigny, C., Golish, D., et al. 2018,Space Sci. Rev., 214, 26
Rizos, J.L., de Leon, J., & Licandro, J. 2019, EPSC-DPS2019-169 Savitzky, A., & Golay, M. J. E. 1964,Anal. Chem., 36, 1627
Scheeres, D. J., McMahon, J. W., French, A. S., et al. 2019,Nat. Astron., 3, 352
Shkuratov, Y., Kaydash, v., Korokhin, V., , et al. 2011,Planet Space Sci., 59, 1326
Simon, A. A., Reuter, D. C., Gorius, N., et al. 2018,Remote Sens., 10, 1486
Sugita, S., Honda, R., Morota, R., et al. 2019,Science, 364, 252
Walsh, K. J., Jawin, E. R., Ballouz, R.-L., et al. 2019,Nat. Geosci., 12, 1038
Watanabe, S., Hirabayashi, M., Hirata, N., et al. 2019,Science, 364, 268