HAL Id: hal-01607587
https://hal.archives-ouvertes.fr/hal-01607587
Submitted on 26 May 2020
HAL is a multi-disciplinary open access
archive for the deposit and dissemination of
sci-entific research documents, whether they are
pub-lished or not. The documents may come from
teaching and research institutions in France or
abroad, or from public or private research centers.
L’archive ouverte pluridisciplinaire HAL, est
destinée au dépôt et à la diffusion de documents
scientifiques de niveau recherche, publiés ou non,
émanant des établissements d’enseignement et de
recherche français ou étrangers, des laboratoires
publics ou privés.
Distributed under a Creative Commons Attribution - ShareAlike| 4.0 International
License
Marie Larousse, Corinne Rancurel, Camille Syska, Ferran Palero, Catherine
Etienne, Benoit Industri, Xavier Nesme, Marc Bardin, Eric Galiana
To cite this version:
Marie Larousse, Corinne Rancurel, Camille Syska, Ferran Palero, Catherine Etienne, et al.. Tomato
root microbiota and Phytophthora parasitica-associated disease. Microbiome, BioMed Central, 2017,
5:56, �10.1186/s40168-017-0273-7�. �hal-01607587�
R E S E A R C H
Open Access
Tomato root microbiota and
Phytophthora
parasitica-associated disease
Marie Larousse
1, Corinne Rancurel
1, Camille Syska
1, Ferran Palero
1,2, Catherine Etienne
1, Benoît Industri
1,
Xavier Nesme
3, Marc Bardin
4and Eric Galiana
1*Abstract
Background: Interactions between pathogenic oomycetes and microbiota residing on the surface of the host plant root are unknown, despite being critical to inoculum constitution. The nature of these interactions was explored for the polyphagous and telluric species Phytophthora parasitica.
Results: Composition of the rhizospheric microbiota of Solanum lycopersicum was characterized using deep re-sequencing of 16S rRNA gene to analyze tomato roots either free of or partly covered with P. parasitica biofilm. Colonization of the host root surface by the oomycete was associated with a shift in microbial community
involving a Bacteroidetes/Proteobacteria transition and Flavobacteriaceae as the most abundant family. Identification of members of the P. parasitica-associated microbiota interfering with biology and oomycete infection was carried out by screening for bacteria able to (i) grow on a P. parasitica extract-based medium (ii), exhibit in vitro probiotic or antibiotic activity towards the oomycete (iii), have an impact on the oomycete infection cycle in a tripartite interaction S. lycopersicum-P. parasitica-bacteria. One Pseudomonas phylotype was found to exacerbate disease symptoms in tomato plants. The lack of significant gene expression response of P. parasitica effectors to Pseudomonas suggested that the increase in plant susceptibility was not associated with an increase in virulence. Our results reveal that Pseudomonas spp. establishes commensal interactions with the oomycete. Bacteria preferentially colonize the surface of the biofilm rather than the roots, so that they can infect plant cells without any apparent infection of P. parasitica. Conclusions: The presence of the pathogenic oomycete P. parasitica in the tomato rhizosphere leads to a shift in the rhizospheric microbiota composition. It contributes to the habitat extension of Pseudomonas species mediated through a physical association between the oomycete and the bacteria.
Keywords: Oomycete, Biofilm, Host plant, Metagenomics 16S, Flavobacteriaceae, Pseudomonadaceae
Background
Microbiota associated either with hosts or/and pathogens regulate the course of infection. For plants, microbiota en-compass various functional contexts. This includes stimu-lation of seed germination and plant growth, promotion of resistance to abiotic stresses, as well as elicitation of plant systemic defense, and antibiosis functions against patho-gens [1–5]. For plant pathopatho-gens, the incidence of microbe-microbe interactions on virulence is investigated. Studies suggest that fitness results of ability to suppress host de-fenses and acquire nutrients from host tissues, and also of features that minimize or maximize events associated with
undesirable or beneficial co-infections [6, 7]. For example, interactions between microbes may promote pathogenicity by production of bacterial toxins that are essential for fungal virulence or by co-infection events that enhance ef-fector gene expression [6, 8, 9]. Such results contribute to evaluate the updating of our view of pathogenic processes taking into account a broader vision of pathogenesis. Then the question of pathogenicity is not restricted at the single genotype or species level, but is extended at level of micro-biota that represent a pathogenic entity [6, 10, 11]. To ad-dress these issues, mixed-species biofilms formed by pathogens and resident microbiota in the host vicinity are good models. They constitute an adaptation both for sur-vival, by protecting species from fluctuating conditions, and for molecular dialogs favored by promiscuity between species [12–14].
* Correspondence:[email protected]
1Université Côte d’Azur, INRA, CNRS, ISA, Sophia Antipolis, France
Full list of author information is available at the end of the article
© The Author(s). 2017 Open Access This article is distributed under the terms of the Creative Commons Attribution 4.0 International License (http://creativecommons.org/licenses/by/4.0/), which permits unrestricted use, distribution, and reproduction in any medium, provided you give appropriate credit to the original author(s) and the source, provide a link to the Creative Commons license, and indicate if changes were made. The Creative Commons Public Domain Dedication waiver (http://creativecommons.org/publicdomain/zero/1.0/) applies to the data made available in this article, unless otherwise stated.
Pathogenic oomycetes are eukaryotic and filamentous microrganisms infecting various hosts (plants, insects, vertebrates, and other microorganisms) [15, 16]. Plant pathogens of the genera Phytophthora and Pythium, to-gether with some obligate parasites (downy mildews and white rusts) cause highly destructive diseases on many dicots, thereby having major ecological and economic consequences worldwide [16]. They have evolved the ability to suppress PAMP-triggered immunity (PTI), a key aspect of plant innate immunity which contributes to microbial growth inhibition [17, 18]. Pathogen sup-pression involves secreted effectors which act in the plant apoplast or are delivered directly into the cytoplasm of host cells, leading to effector-triggered susceptibility [19, 20]. Additionally, oomycetes interact with host resi-dent microbiota before achieving infection. The contribu-tion to pathogenicity of oomycetes/resident microbiota interactions is largely unknown. Recent studies suggest that interactions may act on growth and virulence of the oomycete either at the host–pathogen contact interface or inside host tissues [5, 9]. However, different microorganisms growing in the rhizosphere may exhibit anti-germinative properties against plant-pathogenic oomycetes [21–23], while some inter-specific interactions may promote plant infection [24–26] or may contribute to oomycete propagule dissemination [27]. Phytophthora parasitica has been shown to exploit intraspecific zoo-spore communication to improve adhesion to host cells and to express a set of effector and mucin-like genes by means of biofilm formation [28, 29].
A first analysis of the microbiota dynamics in relation to oomycete infections has been carried out in fish [30, 31]. A meta-taxonomic analysis of Saprolegnia-associated fish egg diseases indicated a correlation between a low incidence of saprolegniasis on salmon eggs having an immature adap-tive immune system and a high richness and abundance of specific commensal Actinobacteria, with species from the Frondihabitansgenus inhibiting attachment of Saprolegnia to eggs [30]. In the case of plant infections, the oomycete-microbiota interactions interfacing with the disease cycle are scarcely documented [6]. In this report, we sought to explore changes in the composition of the rhizosphere microbiota following infection of tomato roots by P. para-sitica. This issue was addressed through the analysis of in-teractions occurring within a biofilm formed by the oomycete on the root surface [13, 14]. To test whether there is a subset of the rhizosphere microbiota able to interact with oomycete and affect plant disease onset, a first aim was to characterize composition and specificity of the rhizopheric microbiota having the ability to colonize biofilms. For this purpose, re-sequencing of 16S rRNA gene amplicons was performed to characterize, from phylum to family, content of microbiota resulting from the colonization by soil microorganisms of roots (i) free or (ii)
partly covered with a P. parasitica biofilm. The second aim was to proceed to culture-dependent functional analyses of the incidence on disease cycle of bacterial species able to colonize the biofilm. Strains were isolated on a P. parasi-tica extract-based medium. They were screened for pro-biotic or antipro-biotic activity towards P. parasitica, as well as for influence on oomycete pathogenicity in the context of a tripartite host plant-P. parasitica-bacteria interaction. Methods
Soil sampling
Sampling was performed on soil supporting tomato growth (Solanum lycopersicum cv. Marmande). The experimental site was an E-W-oriented greenhouse lo-cated at the INRA Pathologie Végétale research unit in Montfavet (43.9 N, 4.8 E). In this environment, plants were under natural light. Sampling was performed on the 31 May 2014 (10am–2pm) in the following conditions: greenhouse temperature (20, 4–24, 2 °C); air relative hu-midity (56–73%); soil moisture tension (17–45 cbar). Soil samples were taken from the rhizosphere of 30 plants 6 weeks post-seeding. Plants were randomly selected by groups of three from ten different areas located on two rows, the easternmost and the westernmost within the greenhouse. Samples were then grouped by ten into three biological replicates (R1, R2, and R3) based on the distribution of three samples from each area in distinct replicates. Plants and soil characteristics are described in Additional file 1: Table S1.
Microbial community constitution
A subsample (10 g) of each biological replicate was mixed with 50 ml of sterile water, and the resulting microbial sus-pension was decanted for 5 min before recovering superna-tants. In order to achieve biofilm formation, microbe-free roots of tomato seedlings (2 weeks post germination) were incubated for 3 h at 20 °C with zoospores (106cells/ml) of the P. parasitica strain 149, reported as highly aggressive on tomato [32]. Seedlings were selected under binocular for a biofilm coverage of root surface estimated at 30–50%. Supernatants recovered from microbial suspensions were then placed in a 15-cm plastic Petri dish and were incu-bated at 20 °C under regular agitation in the presence of tomato roots with or without P. parasitica biofilms. Twenty seedlings roots were used to constitute experiment replicates. After 3 days, roots were washed 3 times with sterile water. Three replicates of microbial communities physically structured on roots (M1R1, M1R2, and M1R3) or on the root-biofilm complex (M2R1, M2R2, and M2R3) were prepared for metagenomic analysis and screening.
DNA extraction and high-throughput sequencing
Microbial material for each replicate was obtained via dissociation by mechanical trituration: 20 passes through
the opening of a standard Pasteur pipette. DNA was ex-tracted from the homogenate using the FastDNA spin kit for soil (MP Biomedicals, Solon, USA) according to manu-facturer’s protocol. Quality of soil DNA was assessed by electrophoresis on 1% agarose, spectrophotometry at 200– 300 nm using a NanoDrop 2000 Spectrophotometer (Thermo scientific) and rRNA gene confirmation by PCR using 27F and 1492R primers (Additional file 2: Figure S1). PCR amplification of template DNAs was carried out for the hypervariable V3-V5 region (~570 bp length) using the 357F and 926R primers (Additional file 3: Table S2). Conditions for PCR amplification were as previously de-scribed [27]. Gel electrophoresis using a 1.5% agarose gel was used to verify amplification. PCR products were ex-cised and purified using the QIAEX II DNA Purification from Agarose Gel kit (QIAGEN) according to manufac-turer’s protocol. The quantity of DNA was determined by spectrophotometry (Nanodrop 2000 spectrophotometer). Amplicon libraries were constructed for each replicate using the InViewTM Microbiome Profiling 2.0 service and paired-end sequenced with Illumina MiSeq sequencing at GATC Biotech (Konstanz, Germany).
Treatment and phylogenetic classification
Sequence analysis was performed using the Ribosomal Database Project tools, following RDP Release 11.4 rec-ommendations [33]. Sequences generated from the 357F primer were subjected to quality filtering with FastQC for average percentage of A, G, C, and T across the read length, average GC content, location and frequency of N positions, sequence length distribution, duplicate se-quences, and overrepresented k-mer sequences. Utilizing quality scores, sequence reads were cleaned by PRINSEQ and RDP. Initial processing used criteria: removal of 5 and 74 nucleotide residues at the 3′ and 5′ ends, respectively; deletion of reads with N residues or with an average quality score ≥32. Chimeric sequences (n = 64108) were also deleted after identification with UCHIIME [34] via USEARCH [35] and against the RDP Gold v9 database. After processing, 644019 sequence reads (including the V3 region) were selected for further analyses. Alignment was performed using the HMMER3 model [36]. The RDP’s mcClust algorithm [37] and the naïve Bayesian classifier [38] were used to define 38730 operational taxonomic units (OTUs) at 98% sequence identity. A multivariate data analysis of OTUs was performed using Phyloseq. Principal component analysis (PCA) and signifi-cant features were identified for all treatments using Phyloseq. The R Vegan package [39] was used for com-munity dissimilarity calculations (alpha diversity indices combining species richness and abundance into a single value) with for each replicate a OTU number normalized relative to the lowest number of OTUs generated from M2R1. The Shannon–Weaver index was ranged from 0.74
to 0.88 for M1R1, M1R2, and M1R3and from 0.77 to 0.87 for M2R1, M2R2, and M2R3. The Simpson index was ranged from 0.41 to 0.52 and from 0.51 to 0.52 for M1 and M2 replicates, respectively (Additional file 4: Figure S2).
Root-biofilm complex (M2) screening
Bacterial isolates were generated as described by Galiana et al. [27]. Mixed-species biofilms were recovered from M2, were rinsed three times in water, and were gently dis-sociated by mechanical trituration (as described above). Cell suspensions obtained were spread on agar plates con-taining a Phytophthora extract as sole nutrient source [Phytophthora crude extract 10 g/l; NaCl 10 g/l; agar 1.5% (P/V)] and were incubated at 25 °C. Phytophthora crude extract was prepared from a 2-week mycelium of P. parasitica strain 149 (INRA, Sophia Antipolis, France). Colonies appeared within 3 days. After subculturing in the same conditions, bacteria were transferred to LB medium for mass culture and further analyses.
Characterization of genetic diversity by 16S rRNA gene sequencing
Bacteria were grown in LB medium over night at 28 °C. Genomic DNA was extracted from cell cultures using the UltraClean®Microbial DNA Isolation kit (MO BIO). Extracted DNA was amplified with 27F and 1492R primers. Amplification was performed under the follow-ing conditions: initial denaturation step at 94 °C for 5 min; 40 cycles of denaturation at 94 °C for 40 s, an-nealing at 55 °C for 40 s, and extension at 72 °C for 1.5 min; and a final extension at 72 °C for 7 min. PCR products were separated on a 1% agarose gel, were stained with ethidium bromide, and were visualized on a transilluminator. Sequencing was performed in both di-rections with primers 27F and 1492R, and consensus se-quences were obtained using CAP3 [40]. Identification was performed at the genus level by blast against the “procaryota_SSU-rDNA-16S_stringent 277957” leBIBI-QBPP database (https://umr5558-bibiserv.univ-lyon1.fr/ lebibi/lebibi.cgi). 16S rRNA gene sequences closest to the isolates (98% sequence homology) were recovered for phylogenetic analysis. Two groups were formed and ana-lyzed separately per higher-level taxonomy. Sequence alignment was performed with MUSCLE [41], and the phylogenetic tree was constructed using the GTR model in PhyML [42] as implemented in the software Seaview4. A bootstrap confidence analysis was per-formed with 1000 replicates.
Generation of green fluorescent protein-labeled bacterial strains
Bacteria were grown in LB medium and washed with ice-cold 10% glycerol. The pFK78 plasmid [43] was trans-ferred into competent cells using the MicroPulser™
electroporation apparatus (Bio-Rad) with recom-mended protocols for bacteria. Transformed bacteria were selected on LB agar plates supplemented with gentamycin (10 μg ml−1) and identified using a LEICA MZFLIII binocular and AxioCamHR camera equipped with AxioVision 4_7 software (Zeiss, Germany). GFP was excited at 440–520 nm light and emission was de-tected through a 520–600 GFP filter.
Biofilm colonization assay
To generate biofilm, roots of tomato seedlings were in-oculated for 3 h with 10 ml of P. parasitica zoospore suspension (strain 149, 500 cells μl−1) and were washed three times with sterile water [28]. The biofilm-root complex was inoculated with GFP-expressing bacteria (E. coli and I-1G6) by adding 10 ml of a cell suspension in water (OD = 0.2) and was incubated for 3 h at 20 °C. Analysis of biofilm-root colonization was performed at 20 °C and was visualized at different time points (3, 6, 18, 24, 48, 72, and 96 h) by fluorescence microscopy. For quantitative image acquisition, 8 bit images (512 × 512 pixels) were acquired on a ZEISS LSM 880 laser scan-ning confocal microscope (λex = 488 nm). In order to measure root and biofilm colonization, a mean fluores-cent intensity signal was determined for four 1000 μm2 areas on each sample (2-biofilm and 2-root material), from 10 serial confocal sections (5 μm) using the ZEN 2012 lite software (Zeiss, Germany).
Tripartite inoculation and protection assay
Roots were inoculated for 3 h with 10 ml of P. parasitica zoospore suspension (strain 149, 10 cells μl−1), were washed three times with sterile water, and were inocu-lated with bacterial isolates suspended in sterile water (OD = 0.2). Plants were grown at 24 °C under growth chamber conditions; 16 h photoperiod at a light intensity of 100 mEm−2 s−1. Disease incidence was measured at different time points as the percentage of plantlets exhi-biting symptoms (yellowed leaves, root rot, and plant stunting). Experiment was performed using two repli-cates of five plants each.
Real-time qPCR analyses
Gene expression was quantified by real-time RT-qPCR using the fluorescent intercalating dye SYBR-Green in an AriaMx Realtime PCR System (Agilent Technologies, Santa Clara, USA). Total RNA from the bacteria-biofilm-root complex was isolated with TRIzol reagent (Invitrogen GmbH, Karlsruhe, Germany). mRNA was treated with Ambion® rDNase I (Thermo Fisher Scientific, Waltham, USA), and cDNA was synthesized from 1 μg RNA, by iScript cDNA Synthesis (Bio-Rad, Hercules, USA). The cDNA was used as a template in real-time PCR with gene-specific primers (Additional file 3: Table S2) and
the qPCRTM Mastermix Plus for SybrTM Green I (Eurogentec, Belgium), following the manufacturer’s instructions. PCR amplification and statistical analyses was carried out as previously described [29].
Results
Structure of P. parasitica-associated microbiota
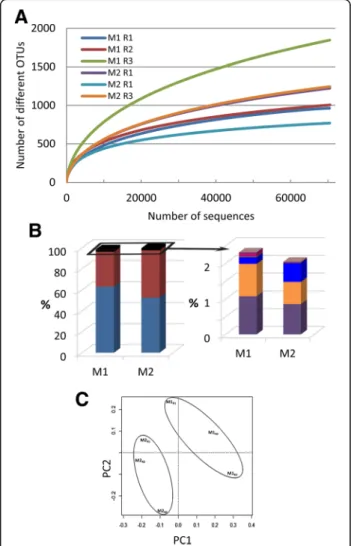
Metagenomic analyses allowed characterization of rhizosphere-associated microbiota colonizing roots of tomato seedlings without (M1) or previously coated with P. parasitica (M2). Rarefaction curves for six replicates (M1R1–3 and M2R1–3) using a 3% dissimilarity cut-off were non-asymptotic in spite of a good coverage (Fig. 1a). Thirty-eight 730 bacterial operational taxonomic units (OTUs) were detected in the 6 samples. The overall mi-crobial diversity of all samples was relatively high, but no
Fig. 1 a Rarefaction curves of observed OTUs richness for each of the three M1 and M2 replicates and using an OTU threshold of≥97% identity. b Percentage of high-confidence OTUs grouped by phylum: Proteobacteria (blue) and Bacteroidetes (red) (left panel); Latescibacteria (purple), Actinobacteria (orange), Firmicutes (blue), Verrucomicrobia (dark pink) (right panel). c PCA ordination based on Hellinger distances
reliable differences were identified between rhizospheric microbiota of M1 and M2 (Additional file 4: Figure S2). The most abundant groups were adequately covered in all samples, with over 97% of sequences assigned to Proteo-bacteria or Bacteroidetes along with a limited number of OTUs assigned to additional phyla, including Firmicutes and Actinobacteria (Fig. 1b). As a matter of fact, all these phyla are known to characterize a number of rhizosphere microbiota [2, 44], indicating that the microbiota we stud-ied have the same overall content as that of other rhizo-sphere microbiota. The relative contents of all samples were highly correlated (data not shown); nevertheless, PCA ordination as well as hierarchical clustering revealed that M1 and M2 samples separated (Fig. 1c). A total of 322 OTUs exhibited significant differences (p < 0.05) in relative abundance between M1 and M2 (Additional file 5: Figure S3), with 49 OTUs defined by an average of at least 10 sequences in M1 or M2 (data not shown).
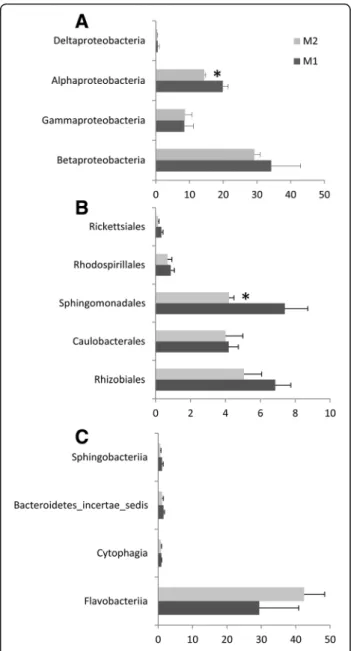
Our results suggest that the presence of oomycete on root surfaces led to an enrichment of sequences assigned belonging to Bacteroidetes (33% ± 10.8, 45% ± 5.2 for M1 and M2, respectively), and a reduction in the proportion of sequences assigned to the phylum Proteobacteria (63% ± 10.1, 52% ±3.9 for M1 and M2, respectively). Fur-thermore, our results indicate an effect of oomycetes on rhizosphere microbiota capable of colonizing tomato root. The distribution of sequences assigned to the four classes of Proteobacteria showed a significant reduction (p = 0.03) in Alphaproteobacteria abundance (Fig. 2a); a reduction largely supported by a significant lower number of sequences assigned to the order Sphingomona-dales (p = 0.05) (Fig. 2b). A reduction in the relative abun-dance of Alphaproteobacteria families was also found to be associated with the presence of oomycete for Sphingo-monadaceae (p = 0.04) in the order Sphingomonadales, and for Hyphomicrobiaceae (p = 0.02) and Bradyrhizobia-ceae (p = 0.03) in the order Rhizobiales (Fig. 3). Within Bacteroidetes, most OTUs found in both M1 and M2 were related to Flavobacteriia (Fig. 2c) with Flavobacteriaceae as the most abundant family (Fig. 3c). Flavobacteriaceae sup-ports thus the higher relative abundance of Bacteroidetes found associated with the presence of oomycete (M2 vs. M1, p = 0.07). The overall taxonomic assignment of anno-tated rRNA gene sequences at the family level and relative percentage in M1 and M2 are shown in Additional file 6: Table S3. Ten families explain 55.3 and 63.5% of the micro-bial diversity both in M1 and M2, respectively (Fig. 3). The range of 16S gene copy number in the genome is given for each of these families in Additional file 7: Table S4 wher-ever data was available [45].
Partnerships between P. parasitica and bacteria M2
M2 replicates were screened for bacterial species associ-ated with P. parasitica and regulassoci-ated plant infection. After
dissection and dilaceration of mixed-biofilms, a collection of 1200 isolates was recovered from M2 on a P. parasitica crude extract-based medium. A total of 300 isolates were tested for activity towards the in vitro and in planta growth of the oomycete. Eleven percent of the isolates inhibited (9.8%) or promoted (1.2%) radial growth of three distinct P. parasitica strains in a confrontation assay on nutrient agar plates (Fig. 4a). A similar tendency was ob-served for the growth effect in zoospore germination assay and in the presence of isolate-conditioned V8 medium for each of these isolates (data not shown). Our results sug-gest in vitro isolates that potentially secrete compounds
Fig. 2 Relative abundance histograms (percentage ± SD) of Proteobacteria (a), Alphaproteobacteria orders (b), and Bacteroidetes classes (c) present in M1 or M2. Differences between M1 and M2 were significant for Alphaproteobacteria (p = 0.03) and Sphingomonadales (p = 0.05) in a Student’s t test (n = 3)
which interfere either negatively or positively with P. parasitica growth. Sequencing of 16S rRNA genes and searches of the procaryota_SSU-rDNA-16S_stringent 277957 database of the leBIBI-QBPP [46] established that isolates belonged to three phylotypes of Pseudomonas spp. and one phylotype of Enterobacter spp. (Additional file 8: Figure S4). In the M2 treatment, the mean proportion of OTUs affiliated to Pseudomonadaceae or Enterobacteria-ceaewas 3.7 and 0.009%, respectively.
Twenty isolates were tested using a co-inoculation assay system for detecting their effect on the ability of a virulent P. parasiticastrain to infect tomato roots. Each individual isolate was applied directly to the roots, none was found to cause symptoms on leaves or roots of plantlets for pe-riods of up to 14 days (see Additional file 9: Figure S5 for Pseudomonas isolates). No correlation with the in vitro effect of isolates on the oomycete growth were observed. Indeed, for all isolates similar root application at 2 h post-zoospore inoculation did not lead to curative protection of
plants (data not shown). For four isolates belonging to the Pseudomonasphylotype II and III worsening of symptoms was noted. The rate at which the symptoms appeared and progressed was faster than the appearance of symptoms in control plants inoculated with zoospores or co-inoculated with zoospores and cells of E. coli lab strain. The disease rate was significantly higher for two isolates at 3 and 5 days post-inoculation (Fig. 4b).
Pseudomonas spp. preferentially colonizes P. parasitica biofilm and infects plant cells
In order to further analyze the root-P. parasitica-Pseudomonasspp. association, a GFP expressing strain
I-Fig. 3 Relative abundance histograms (percentage + SD) of the ten most abundant families listed for M1 and M2 (threshold >0.5%) in the presence (light gray) and in the absence (dark gray) of P. parasitica biofilm. a Alphaproteobacteria. b Gammaproteobacteria. c Bacteroidetes
Fig. 4 Bacterial isolate analyses. a Plate confrontation assay of the E. coli strain and the M2-isolates (I-1G6, I-3G9, I-1E12, and I-1G3) exhibiting antimicrobial activity against P. parasitica (P) performed on V8 extract agar medium. b Histogram of the disease rate measured at different days post zoospore inoculation (○) or during a tripartite interaction with E. coli (□),I-3G9 (●), I-1E12 (▲), I-1G6 (♦), or I-1G3 (■). Disease symptoms of individual plants were monitored at 3, 5, 8, and 13 days (dpi). I-3G9 as well as I-1E12 differed from E.coli and mock inoculation in disease index measured at 3 and 5 dpi (n = 5, Student’s t test, 0.004 < p < 0.035). Values are the means ± SD of two replicates
1G6-GFP was generated. A kinetic study was then carried out by immersing tomato roots covered with biofilm in a bacterial suspension of I-1G6-GFP or an E. coli expressing GFP. Samples were observed under a confocal microscope at different times (3, 24, and 48 h post-inoculation or hpi). Fig. 5a and Additional file 10: Figure S6, show micrographs with the presence of bacteria at 3 hpi. At this early stage the I-1G6-GFP bacterial cells were poorly distributed along root surface and were mainly located on biofilm-forming hemispherical or sleeve-shaped biofilms. Quantification of fluorescence intensities showed that the colonization of biofilms was preferential when compared to root surfaces for I-1G6-GFP (Fig. 5c). At 24 and 48 hpi, similar observa-tions were made with an increase of colonization on bio-film surfaces by I-1G6-GFP, suggesting a phase of cell division at the surface of the biofilm. For the E. coli-GFP strain, the colonization of biofilms surface was sparser and unspecific compared to root surface (Fig. 5b, c). At 2 dpi, I-1G6-GFP bacteria may have accumulated at the inter-face between the root surinter-face and the structure of the bio-film (Fig. 5d), and infection of plant cells adjacent to the biofilm was also observed (Fig. 5e). At 8 dpi, preferential colonization of biofilm was well marked (Fig. 5f, g), exten-sive intercellular growth of I-1G6-GFP was observed in the root cortex, mainly along the longitudinal axis of the
root (Additional file 11: Figure S7). At different time points, conversely to plant cell, no intracellular infection event of P. parasitica could be observed.
Pseudomonas spp. does not induce P. parasitica effector gene regulation
Previous investigations on the P. parasitica biofilm scriptome led to the identification of upregulated tran-scripts encoding (i) mucin-like proteins of the PPMUCL family [29], (ii) pectate lyases (PPTG03562/02949/4818) identified as involved in the degradation of pectin, com-ponents of the plant cell wall [47], and the RxLR effector PSE1 accumulating in penetrating appressoria [48]. To characterize the effect of Pseudomonas spp. gene expres-sion at early stages of infection, a kinetic study was per-formed by quantitative RT-PCR during colonization of the biofilm-root complex by I-1G6. Fig. 6 shows the mRNA changes for the three classes of genes at the dif-ferent time points. The presence of I-1G6 strain does not appear to affect the expression levels of the genes despite a slight reduction in expression levels 2–20 h after colonization. Our results suggest that, at early stages of tripartite interaction, the abundance of assessed transcripts were not upregulated in response to the colonization of the biofilm by Pseudomonas spp.
Fig. 5 Location of I-1G6-GFP. Micrographs illustrating the preferential location of 1G6-GFP cells on biofilm (b) compared to root (r) at 3 hpi (a), 48 hpi (d, e), and 8 dpi (f). The colonization observed for I-1G6-GFP at 3 hpi (a) 8 dpi (f) can be compared to the lesser one observed for E. coli-GFP (b) and (g), respectively. c Histogram of the relative fluorescence intensity at 3 and 24 hpi for I-1G6-GFP and E.coli-GFP, measured as the ratio of the mean values at the surface of the biofilms and of roots. Bars: 200μm in a, b, f, and g; 50 μm in d and e. The dotted lines delineate the interface between biofilm and root. In (e) dotted lines delineate an epidermal cell infected by I-1G6-GFP-and located beneath a biofilm
Discussion
The Bacteroidetes/Proteobacteria shift
Here, we report the change in the composition of the rhizosphere microbiota of Solanum lycopersicum at root surface in association with P. parasitica biofilm formation, at phylum (Fig. 1b), class, order (Fig. 2), and family (Fig. 3) level assignments. Among ten families characterized as the most abundant in M1 and M2 (Fig. 3), Rhodospirilla-ceae, PseudomonadaRhodospirilla-ceae, and Flavobacteriaceae exhibit a high range of 16S gene copy number in their ge-nomes, with an average of 4.5, 4.8, and 3.9, respectively (Additional file 7: Table S4). This indicates that the relative abundance values in M1 and M2 may not be an accurate representation for these families. Nevertheless, Flavobac-teriaceaeremains the most abundant family, with a repre-sentation eight to ten times higher compared to the other nine main families identified.
Our results suggest a P. parasitica-associated shift in-volving a Bacteroidetes/Proteobacteria transition in micro-biota composition at the root surface. The Bacteroidetes
dominate colonization of tomato roots inoculated with P. parasitica. The infection of a host plant by P. parasitica re-lies on the secretion of plant cell wall-degrading enzymes that leads to successful penetration of the host and to subsequent acquisition of nutrients [47]. The ability of the oomycetes to efficiently depolymerize polysac-charides could contribute to the observed enrichment of Bacteroidetes within P. parasitica-associated microbiota. Research indicates that the abundance of Bacteroidetes in soils is positively correlated to carbon mineralization rates [49], influenced by oomycetes through pectin digestion [50]. Localized degradation of plant cell wall at root sites of biofilm formation should constitute a favorable niche for soil Flavobacteriaceae, the predominant family found in M2. Furthermore, within Flavobacteriaceae family, ge-nomes exhibit a high abundance and diversity of genes in-volved in metabolism of carbohydrates such as xylose, arabinose, and pectin [51]. The increased expression of three genes encoding P. parasitica pectate lyases (Fig. 6b), included in the top 20 most expressed genes in biofilm (present study and [52]), is consistent with a causal rela-tionship between P. parasitica pectin digestion ability and Bacteroidetes enrichment.
From a pathological perspective, the question of if/how Bacteroidetes/Proteobacteria community shift interferes with the infection cycle of oomycetes remains open. Our research functionally assessed the roles of P. parasitica-as-sociated bacteria and tested hypotheses generated via culture-independent profiling. Screening of root-biofilm complex M2 led us to characterize members of Pseudomo-nadaceae, one of the ten most abundant families of the microbiota (OTU affiliation rate of 3.7%), and isolates of Enterobacteriaceae; a family representing a low part of M2 microbial diversity (OTU affiliation rate of 0.009%, data not shown). While no Bacteroidetes strains were charac-terized from M2 with the employed strategy. Further in-vestigations are required to design effective screening for isolation of Bacteroidetes strains from the P. parasitica-as-sociated microbiota [53].
Effects of Pseudomonas spp.-P. parasitica association on pathogenicity
Associations with bacteria can have a considerable influ-ence on the growth, physiology, and pathogenicity of filamentous pathogens [8]. Previous studies reported that bacteria growing in the rhizosphere may compete with oomycetes for nutrients or may exhibit properties that negatively affect growth/survival. For example, competi-tion for plant-derived unsaturated long-chain fatty acids has been reported between Enterobacter cloacae and the seed-rotting oomycete, Pythium ultimum [22]. Here, the interference of Pseudomonas spp. and Enterobacter spp. on the biology of oomycete was assessed both in vitro and in planta. Interactions via antibiosis and probiosis
Fig. 6 P. parasitica gene expression patterns in response to I-1G6-GFP. Roots of 2-week-old plants covered with a P. parasitica biofilm after 3 h of incubation with zoospores. They were then incubated in water or in the presence of I-1G6-GFP. mRNAs relative abundance were measured by RT-qPCR at 2, 6, and 20 h post-bacterial inoculation and for PPMUCL1, PPMUCL2, PPMUCL3 (a), PPTG03562, PPTG02949, PPTG4818 (b) and PSE1 (c). A Student’s t test indicated no significant differences between mock and inoculated situations (0.06 < p < 0.92, n = 3) except at 2 dpi for PPMUCL1, PPMUCL2, and PPTG4818 (p = 0.01, 0.02, and 0.04, respectively)
were clearly observed in vitro for members of two bacterial genera and involving secreted compounds. Our results indicate that bacteria-oomycete interac-tions, in the rhizosphere, may have detrimental or beneficial impact on the growth of the stramenopile. However, in the context of tripartite interaction S. lycopersicum-P. parasitica–bacteria strain, the activ-ities characterized in vitro were not expressed or had no influence on the ability of the oomycete to colonize a host plant.
We identified one Pseudomonas phylotype (exhibiting antibiosis activity), which significantly increased symp-tom severity on treated plantlets. When inoculated alone (without P. parasitica), the phylotype never provoked visible symptoms (Additional file 9: Figure S5D). These results suggest either an enhancement of the P. parasi-tica pathogenicity by bacteria or a potentiation of the infectiveness/pathogenicity of Pseudomonas spp. by the oomycete. Further studies are required to discriminate among these alternative hypotheses. Nevertheless, our results suggest that oomycete infection may facilitate op-portunistic infection by Pseudomonas spp. The first as-sumption has been evaluated at the transcriptomic level through the analysis of gene expression of targeted genes recruited for structural functions [29] or by brute force [54] and stealth [48] modes of infection [54]. No influ-ence of the bacteria-oomycete interaction was observed on the mRNA abundance of genes during the oomycete infection process. On the other hand, the second as-sumption is supported by the location of bacteria at the P. parasiticainfection site which is favored by the pref-erential adhesion on oomycete material. It is also sup-ported by the occurrence of subsequent Pseudomonas infections of adjacent plant cells. Pseudomonas oppor-tunistic pathogens may have acquired the ability to ad-here to the oomycete to maximize access to plant nutrients. At wound sites [43, 55], the oomycete material would constitute a boarding gate for bacteria of this family to gain access to nutrients.
Conclusions
Significant changes in microbiota composition during the oomycete plant infection were identified. Establish-ment of host-oomycete interaction is characterized by a higher relative abundance of taxa within Bacteroidetes and a lower relative abundance of Proteobacteria. The present study further illustrates an aspect of cooperation between an oomycete and opportunistic bacteria by demonstrating that oomycete infection extends the habi-tat availability for Pseudomonas spp. to host-plant tis-sues. Future mechanistic insights into bacterial adhesion on oomycete surfaces and possible optimization of re-source allocation due to infection will be obtained through microbial genetics and functional analyses.
Additional files
Additional file 1: Table S1. Plant characteristics and soil properties at each sampling location. (PDF 348 kb)
Additional file 2: Figure S1. PCR analysis of DNA extracted from replicates M1R1–3and M2R1–3. PCR amplificons corresponding to full-length 16S rRNA gene were generated using 27F and 1492R primers and analyzed by 1% agarose gel electrophoresis. Lane MW corresponds to molecular-weight size markers (MassRuler DNA Ladder Mix, Thermo Scientific). (PDF 5664 kb)
Additional file 3: Table S2. Nucleotide sequences (5-3′) of the primers used in this study. (PDF 451 kb)
Additional file 4: Figure S2. Graphic summary of alpha-diversity indices. Comparison of Chao1, Shannon, Fisher, and Simpson indices calculated for M1 and M2 replicates. (PDF 13600 kb)
Additional file 5: Figure S3. Dendrogram showing hierarchical clustering of the six biological replicates using the unweighted pair-group average algorithm and the Bray–Curtis similarity index (n = 1000). The dendogram is drawn based on the relative abundances of OTUs showing significant difference between M1 and M2 (p < 0.05). (PDF 695 kb)
Additional file 6: Table S3. Rhizosphere bacterial families identified in M1 or M2, and responded to the presence of P. parasitica biofilm. (PDF 655 kb) Additional file 7: Table S4. 16S gene count statistics (20 March 2017). (PDF 445 kb)
Additional file 8: Figure S4. Phylogenetic trees showing the relationship between the Pseudomonadaceae (A) and Enterobacteriaceae (B) isolates from M2 and related Pseudomonadaceae or Enterobacteriaceae species, respectively. Trees were constructed using PhyML with default settings and 1000 bootstrap replicates. The position of rhizospheric isolates are indicated by vertical bars. (PDF 7876 kb)
Additional file 9: Figure S5. Two-week-old plants were first root-inoculated (A, C) or not root-inoculated (B, D) with a 10 ml suspension of zoospores (2 cells/μl) from the P. parasitica strain 149. Two replicates of five plants were subsequently inoculated with the indicated bacterial isolates and photographed 8 days post-inoculation (C, D). As shown in (C), when inoculated alone the tested isolates (I-3G9, I-1G6, I-1G3) did not cause visible disease symptoms on plants. As illustrated in (C), the co-inoculation of rhizospheric isolates with P. parasitica led to aggravation of symptoms when compared to the co-inoculation of E. coli cells with P. parasitica zoospores. (PDF 31934 kb)
Additional file 10: Figure S6. Three representative optical section Z-series illustrating the preferential location of 1G6-GFP cells on different P. parasitica biofilms (b) formed on the surface of roots (r) (3 hpi). Fluorescence intensities were measured on ten consecutive serial sections (5μm), (i) at the left and right parts of the biofilm (1000μm2), and (ii) at the root surface
not covered by P. parasitica and located on the left and right sides of the biofilm (1000μm2). Bars: 100μm in A and C; 200 μm in B. (PDF 29611 kb)
Additional file 11: Figure S7. Location of I-1G6-GFP in the root cortex at 8 dpi. (A, B, C) Roots nude (A) or recovered with P. parasitica biofilm (B, C) inoculated with E. coli-GFP cells. (D, E, F) Roots nude (D) or roots covered with P. parasitica biofilm (E, F) and inoculated with I-1G6-GFP. (G) Enlargement of the two inlets indicated in F, showing root cortex colonization along the longitudinal axis of the xylem. Bars: 100μm. (PDF 24571 kb)
Acknowledgements
The authors thank Renaud Canaguier (NIXE, Sophia Antipolis) for supporting this work, Mathieu Gourgues for the helpful discussion, William Rhamey for edition of the paper and Renier van der Hoorm for the generous gift of pFK78. The authors also thank the Microscopy Platform-Sophia Agrobiotech Institut-INRA 1355-UNS-CNRS 7254-INRA PACA Sophia Antipolis for the access to instruments and technical advice. Thanks are extended to expert reviewers for their fruitful suggestions, constructive recommendations, and comments, as well as for their extensive revision of the manuscript.
Funding
This work was supported by a 3-year grant to Marie Larousse funded by INRA and the PACA region (France), and by a 1-year ATER position funded by the University of Nice Sophia Antipolis. Ferran Palero acknowledges a post-doctoral contract funded by the Beatriu de Pinos Programme of the Generalitat de Catalunya.
Availability of data and materials
The datasets supporting the conclusions of this article are available in the NCBI repository (BioProject PRJNA354847, https://www.ncbi.nlm.nih.gov/ bioproject/354847). Data for each biological replicate (M1R1, M1R2, M1R3,
M2R1, M2R2and M2R3) can be obtained from the BioSample database
(https://www.ncbi.nlm.nih.gov/biosample), accessions SAMN06052955-SAMN06052960.
Authors’ contributions
XN, MB, and EG designed the experiments. ML, CR, BI, and FP carried out the metagenomic analyses. ML, CS, and CM carried out the cellular and molecular analyses. ML, FP, XN, and EG wrote the manuscript. All authors read and approved the final manuscript.
Competing interests
The authors declare that they have no competing interests. Consent for publication
Not applicable. Ethics approval Not applicable.
Publisher’s Note
Springer Nature remains neutral with regard to jurisdictional claims in published maps and institutional affiliations.
Author details
1
Université Côte d’Azur, INRA, CNRS, ISA, Sophia Antipolis, France.2Centre d’Estudis Avançats de Blanes (CEAB-CSIC), Carrer d’Accés a la Cala Sant Francesc 14, 17300 Blanes, Spain.3Université de Lyon, UCBL, CNRS, INRA,
Ecologie Microbienne (LEM), 69622 Villeurbanne, France.4Plant Pathology,
INRA, 84140 Montfavet, France.
Received: 15 December 2016 Accepted: 2 May 2017 References
1. Lebeis SL. The potential for give and take in plant-microbiome relationships. Front Plant Sci. 2014;5:287.
2. Bulgarelli D, Schlaeppi K, Spaepen S. Ver Loren van Themaat E, Schulze-Lefert P. Structure and functions of the bacterial microbiota of plants. Annu Rev Plant Biol. 2013;64:807–38.
3. Bulgarelli D, Garrido-Oter R, Munch PC, Weiman A, Droge J, Pan Y, et al. Structure and function of the bacterial root microbiota in wild and domesticated barley. Cell Host Microbe. 2015;17(3):392–403.
4. Berg G, Rybakova D, Grube M, Koberl M. The plant microbiome explored: implications for experimental botany. J Exp Bot. 2016;67(4):995–1002. 5. Mendes R, Kruijt M, de Bruijn I, Dekkers E, van der Voort M, Schneider JH,
et al. Deciphering the rhizosphere microbiome for disease-suppressive bacteria. Science. 2011;332(6033):1097–100.
6. Kemen E. Microbe-microbe interactions determine oomycete and fungal host colonization. Curr Opin Plant Biol. 2014;20:75–81.
7. Kemen AC, Agler MT, Kemen E. Host-microbe and microbe-microbe interactions in the evolution of obligate plant parasitism. New Phytol. 2015;206(4):1207–28. 8. Frey-Klett P, Burlinson P, Deveau A, Barret M, Tarkka M, Sarniguet A.
Bacterial-fungal interactions: hyphens between agricultural, clinical, environmental, and food microbiologists. Microbiol Mol Biol Rev. 2011;75(4):583–609.
9. Larousse M, Galiana E. Microbial partnerships of pathogenic 0omycetes. PLoS Pathog. 2017. doi:10.1371/journal.ppat.1006028.
10. Petersen C, Round JL. Defining dysbiosis and its influence on host immunity and disease. Cell Microbiol. 2014;16(7):1024–33.
11. Vayssier-Taussat M, Albina E, Citti C, Cosson JF, Jacques MA, Lebrun MH, Le Loir Y, Ogliastro M, Petit MA, Roumagnac P, et al. Shifting the paradigm
from pathogens to pathobiome: new concepts in the light of meta-omics. Front Cell Infect Microbiol. 2014;4:29.
12. Danhorn T, Fuqua C. Biofilm formation by plant-associated bacteria. Annu Rev Microbiol. 2007;61:401–22.
13. Angus AA, Hirsch AM. Biofilm formation in the rhizosphere. Multispecies Interactions and Implications for Plant Growth. In: Molecular Microbial Ecology of the Rhizosphere. Hoboken: John Wiley & Sons, Inc.; 2013. p. 701–12 14. Mousa WK, Shearer C, Limay-Rios V, Ettinger CL, Eisen JA. Raizada MN
Root-hair endophyte stacking in finger millet creates a physicochemical barrier to trap the fungal pathogen Fusarium graminearum. Nat Microbiol. 2016;1:16167. 15. Thines M. Phylogeny and evolution of plant pathogenic oomycetes—a
global overview. Eur J Plant Pathol. 2014;138:431–47.
16. van West P, Beakes GW. Animal pathogenic Oomycetes. Fungal Biol. 2014; 118(7):525–6.
17. Jones JD, Dangl JL. The plant immune system. Nature. 2006;444(7117):323–9. 18. Nurnberger T, Brunner F, Kemmerling B, Piater L. Innate immunity in plants
and animals: striking similarities and obvious differences. Immunol Rev. 2004;198:249–66.
19. Birch PR, Armstrong M, Bos J, Boevink P, Gilroy EM, Taylor RM, et al. Towards understanding the virulence functions of RXLR effectors of the oomycete plant pathogen Phytophthora infestans. J Exp Bot. 2009;60(4):1133–40. 20. Dong S, Raffaele S, Kamoun S. The two-speed genomes of filamentous
pathogens: waltz with plants. Curr Opin Genet Dev. 2015;35:57–65. 21. Picard K, Tirilly Y, Benhamou N. Cytological effects of cellulases in the
parasitism of Phytophthora parasitica by Pythium oligandrum. Appl Environ Microbiol. 2000;66(10):4305–14.
22. van Dijk K, Nelson EB. Fatty acid competition as a mechanism by which Enterobacter cloacae suppresses Pythium ultimum sporangium germination and damping-off. Appl Environ Microbiol. 2000;66(12):5340–7.
23. Gerbore J, Benhamou N, Vallance J, Le Floch G, Grizard D, Regnault-Roger C, et al. Biological control of plant pathogens: advantages and limitations seen through the case study of Pythium oligandrum. Environ Sci Pollut Res Int. 2014;21(7):4847–60.
24. Kong P, Tyler BM, Richardson PA, Lee BW, Zhou ZS, Hong C. Zoospore interspecific signaling promotes plant infection by Phytophthora. BMC Microbiol. 2010;10:313.
25. Kong P, Hong C. Soil bacteria as sources of virulence signal providers promoting plant infection by Phytophthora pathogens. Sci Rep. 2016;6:33239.
26. Belhaj K, Cano LM, Prince DC, Kemen A, Yoshida K, Dagdas YF, Etherington GJ, Schoonbeek H-j, van Esse HP, Jones JDG, Kamoun S, and Schornack S. Arabidopsis late blight: infection of a nonhost plant by Albugo laibachii enables full colonization by Phytophthora infestans. Cell Microbiol.2017;19:1-15. doi: 10.1111/cmi.12628.
27. Galiana E, Marais A, Mura C, Industri B, Arbiol G, Ponchet M. Ecosystem screening approach for pathogen-associated microorganisms affecting host disease. Appl Environ Microbiol. 2011;77(17):6069–75.
28. Galiana E, Fourre S, Engler G. Phytophthora parasitica biofilm formation: installation and organization of microcolonies on the surface of a host plant. Environ Microbiol. 2008;10(8):2164–71.
29. Larousse M, Govetto B, Seassau A, Etienne C, Industri B, Theodorakopoulos N, et al. Characterization of PPMUCL1/2/3, three members of a new oomycete-specific mucin-like protein family residing in Phytophthora parasitica biofilm. Protist. 2014;165(3):275–92.
30. Liu Y, de Bruijn I, Jack AL, Drynan K, van den Berg AH, Thoen E, et al. Deciphering microbial landscapes of fish eggs to mitigate emerging diseases. Isme J. 2014;8(10):2002–14.
31. Liu Y, Rzeszutek E, van der Voort M, Wu CH, Thoen E, Skaar I, et al. Diversity of aquatic pseudomonas species and their activity against the fish pathogenic oomycete Saprolegnia. PLoS One. 2015;10(8):e0136241. 32. Le Berre JY, Engler G, Panabieres F. Exploration of the late stages of the
tomato-Phytophthora parasitica interactions through histological analysis and generation of expressed sequence tags. New Phytol. 2008;177(2):480–92. 33. Cole JR, Wang Q, Fish JA, Chai B, McGarrell DM, Sun Y, et al. Ribosomal
database project: data and tools for high throughput rRNA analysis. Nucleic Acids Res. 2014;42(Database issue):D633–42.
34. Edgar RC, Haas BJ, Clemente JC, Quince C, Knight R. UCHIME improves sensitivity and speed of chimera detection. Bioinformatics. 2011;27(16):2194–200. 35. Edgar RC. Search and clustering orders of magnitude faster than BLAST.
Bioinformatics. 2010;26(19):2460–1.
36. Finn RD, Clements J, Eddy SR. HMMER web server: interactive sequence similarity searching. Nucleic Acids Res. 2011;39(Web Server issue):W29–37.
37. Fritsch A, Ickstadt K. An improved criterion for clustering based on the posterior similarity matrix. Bayesian Anal. 2009;4:367–91.
38. Wang Q, Garrity GM, Tiedje JM, Cole JR. Naive Bayesian classifier for rapid assignment of rRNA sequences into the new bacterial taxonomy. Appl Environ Microbiol. 2007;73(16):5261–7.
39. Oksanen J, Blanchet FG, Kindt R, Legendre P, Minchin PR, O’Hara RB et al. vegan: community Ecology Package. R package version 2.0-7. http://CRAN.R-project.org/package=vegan. 2013.
40. Huang X, Madan A. CAP3: a DNA sequence assembly program. Genome Res. 1999;9(9):868–77.
41. Edgar RC. MUSCLE: multiple sequence alignment with high accuracy and high throughput. Nucleic Acids Res. 2004;32(5):1792–7.
42. Guindon S, Dufayard JF, Lefort V, Anisimova M, Hordijk W, Gascuel O. New algorithms and methods to estimate maximum-likelihood phylogenies: assessing the performance of PhyML 3.0. Syst Biol. 2010;59(3):307–21. 43. Misas-Villamil JC, Kolodziejek I, Crabill E, Kaschani F, Niessen S, Shindo T,
et al. Pseudomonas syringae pv. syringae uses proteasome inhibitor syringolin A to colonize from wound infection sites. PLoS Pathog. 2013;9(3):e1003281. 44. Philippot L, Raaijmakers JM, Lemanceau P, van der Putten WH. Going back
to the roots: the microbial ecology of the rhizosphere. Nat Rev Microbiol. 2013;11(11):789–99.
45. Stoddard SF, Smith BJ, Hein R, Roller BR, Schmidt TM. rrnDB: improved tools for interpreting rRNA gene abundance in bacteria and archaea and a new foundation for future development. Nucleic Acids Res. 2015;43(Database issue):D593–8.
46. Devulder G, Perriere G, Baty F, Flandrois JP. BIBI, a bioinformatics bacterial identification tool. J Clin Microbiol. 2003;41(4):1785–7.
47. Blackman LM, Cullerne DP, Hardham AR. Bioinformatic characterisation of genes encoding cell wall degrading enzymes in the Phytophthora parasitica genome. BMC Genomics. 2014;15:785.
48. Evangelisti E, Govetto B, Minet-Kebdani N, Kuhn ML, Attard A, Ponchet M, et al. The Phytophthora parasitica RXLR effector penetration-specific effector 1 favours Arabidopsis thaliana infection by interfering with auxin physiology. New Phytol. 2013;199(2):476–89.
49. Fierer N, Bradford MA, Jackson RB. Toward an ecological classification of soil bacteria. Ecology. 2007;88(6):1354–64.
50. Kuramae EE, Zhou JZ, Kowalchuk GA, van Veen JA. Soil-borne microbial functional structure across different land uses. Scientific World Journal. 2014; 2014:216071.
51. Kolton M, Sela N, Elad Y, Cytryn E. Comparative genomic analysis indicates that niche adaptation of terrestrial Flavobacteria is strongly linked to plant glycan metabolism. PLoS One. 2013;8(9):e76704.
52. Theodorakopoulos N, Govetto B, Industri B, Mass L, Gaysinski M, Deleury E, et al. Biology and Ecology of Biofilms formed by a plant pathogen Phytophthora parasitica: from biochemical Ecology to Ecological Engineering. Procedia Environ Sci. 2011;9:178–82.
53. Nishioka T, Elsharkawy MM, Suga H, Kageyama K, Hyakumachi M, Shimizu M. Development of culture medium for the Isolation of Flavobacterium and Chryseobacterium from rhizosphere soil. Microbes Environ. 2016;31(2):104–10. 54. Liu H, Coulthurst SJ, Pritchard L, Hedley PE, Ravensdale M, Humphris S, et al.
Quorum sensing coordinates brute force and stealth modes of infection in the plant pathogen Pectobacterium atrosepticum. PLoS Pathog. 2008;4(6):e1000093. 55. Misas-Villamil JC, Kolodziejek I, van der Hoorn RA. Pseudomonas syringae
colonizes distant tissues in Nicotiana benthamiana through xylem vessels. Plant J. 2011;67(5):774–82.
• We accept pre-submission inquiries
• Our selector tool helps you to find the most relevant journal • We provide round the clock customer support
• Convenient online submission • Thorough peer review
• Inclusion in PubMed and all major indexing services • Maximum visibility for your research
Submit your manuscript at www.biomedcentral.com/submit