HAL Id: hal-01081030
https://hal.inria.fr/hal-01081030
Submitted on 6 Nov 2014
HAL is a multi-disciplinary open access
archive for the deposit and dissemination of
sci-entific research documents, whether they are
pub-lished or not. The documents may come from
teaching and research institutions in France or
abroad, or from public or private research centers.
L’archive ouverte pluridisciplinaire HAL, est
destinée au dépôt et à la diffusion de documents
scientifiques de niveau recherche, publiés ou non,
émanant des établissements d’enseignement et de
recherche français ou étrangers, des laboratoires
publics ou privés.
Mining social media to create personalized
recommendations for tourist visits
Adrian Popescu, Gregory Grefenstette
To cite this version:
Adrian Popescu, Gregory Grefenstette.
Mining social media to create personalized
recommen-dations for tourist visits.
COM.Geo, May 2011, Washington, DC, United States.
pp.1 - 6,
Mining Social Media to Create
Personalized Recommendations for Tourist Visits
Adrian Popescu
CEA, LIST
Vision & Content Engineering Laboratory 92263 Fontenay aux Roses, France
[email protected]
Gregory Grefenstette
Exalead Paris, France[email protected]
ABSTRACT
Photo sharing platforms users often annotate their trip photos with landmark names. These annotations can be aggregated in order to recommend lists of popular visitor attractions similar to those found in classical tourist guides. However, individual tourist preferences can vary significantly so good recommendations should be tailored to individual tastes. Here we pose this visit personalization as a collaborative filtering problem. We mine the record of visited landmarks exposed in online user data to build a user-user similarity matrix. When a user wants to visit a new destination, a list of potentially interesting visitor attractions is produced based on the experience of like-minded users who already visited that destination. We compare our recommender to a baseline which simulates classical tourist guides on a large sample of Flickr users.
Categories and Subject Descriptors
H.2.8 [Database Management]: Database Applications – data
mining, spatial databases and GIS. H.4.3 [Information System
Applications]: Miscellaneous.
General Terms
Algorithms, Experimentation, Human Factors.
Keywords
Collaborative filtering, tourist photographs, photo collections, Flickr, personalization, landmarks, recommendation.
1.
INTRODUCTION
When describing a destination, classical tourist guides usually favor the most popular tourist attractions in this area. If a visitor follows their recommendations, she will see these popular spots but may miss attractions more suited to her tastes. Mass printed guide books, for obvious economic reasons, describe the average tourists’ experience.
This model, once acceptable, now becomes obsolete, as many Web 2.0 platforms containing user data about their travels become available. Collaborative filtering [8] has been successfully applied to filter online information and propose personalized recommendations for: books, music or films. Personalization is obtained by gleaning information from a community and combining this information with a user’s preferences and such a method is appealing for tailoring visit recommendations.
In the tourist domain, user’s interests can be mined from her implicit travel records contained by photo annotations. Here we show how to apply a collaborative filtering approach to visit personalization. Past investigation [2] has shown that people tag pictures both for personal and social reasons. In particular, Flickr users tag their tourist photos both in order to keep track of their trips but also to show other people what they visited and considered interesting. These photos and associated metadata are a multimodal description of user trips. A large set of landmarks extracted from Wikipedia is compared to a user’s annotations in order to determine what was visited. After the extraction of a list of visited landmarks for each user, tourist preferences similarity between user pairs is computed based on the number of common elements in the two lists of landmarks and a similarity matrix is built. When the target user visits a new destination, interesting landmarks are recommended based on the visit records of like-minded users that already visited the destination. The extraction is non intrusive since it relies on textual metadata a user chose to make public and which are associated to photos in a non constrained manner. Our preference similarity extraction can be applied to large volumes of data because it is computationally inexpensive.
2.
DATA PREPROCESSING
2.1
Landmark Extraction from Wikipedia
Automatic landmark extraction from user-contributed resources has been the topic of much research ([17], [14], [4], [16], [10]), though the accuracy of extracted POIs is not perfect. Extraction accuracy is very important for landmark recommendation we use Wikipedia, which contains better quality landmark descriptions than geotagged photo sets exploited in [4] or [17]. To obtain coverage of a large number of tourist destinations, we follow [14] and exploit georeferenced Wikipedia articles as a data source. Contributors have described a large number of visitor attractions, providing geotags and categories. As of October 2009, the English Wikipedia contains over 326,000 georeferenced articles (available from DBPedia [5]). Considering the interest of multilingual processing of user-contributed collections, we follow Wikipedia structure to get article translations in up to 18 languages. We complete the list of georeferenced articles with Wikipedia categories. To extract potential landmarks, we exploit a
vocabulary of 79 geographic concepts (such as palace,
skyscraper, park or museum) adapted from [14] and articles are
selected by matching their categories against this vocabulary. We structure our collection of landmarks at a city level. Potentially interesting cities are found by selecting georeferenced articles which are categorized under city, town, settlement,
municipality, commune or national capital in Wikipedia and
which have translations in at least 13 languages out of 18. This last ad hoc threshold seeks to capture the intuition that a city is important. The resulting list of cities contains 913 items. To find elements pertaining to a city, we select items found within 20 km radius from the city center and which are categorized under at least one of the 79 geographic concepts. Visitor attractions are unequally distributed, of course, across different cities (no more than 10 for over 600 cities and over 100 attractions for around 60 cities) since many small or medium cities have few associated landmarks. Cities with a large number of potential landmarks are generally large ones. There are 269 sites in Paris, 283 in San
Francisco and 143 in Melbourne. The total number of mined
landmarks is 25077, with a maximum value for London (1598). Tourist guides are often structured around top picks in an area, with top picks selected manually. Automating the mining of top picks from photo collections was attempted in [4] or [14]. Here, we adapt the popularity rank from [14] and rank landmarks using the product between the number of different photos tagged with a landmark name and the number of different users having uploaded photos for that site.
Table 1. Top visitor attractions in 3 cities, ranked by popularity in Flickr.
Bangkok Grand Palace, Wat Phra Kaew, Wat Pho, Wat Arun, Siam Paragon
Paris Louvre, Eiffel Tower, Arc de Triomphe, La Défense, Notre Dame de Paris
San Francisco
Golden Gate Bridge, Golden Gate Park, California Academy of Sciences, Conservatory of Flowers, Dolores Park
Landmark filtering is most interesting for cities with a large number of associated tourist attractions because filtering is of little help when the user needs to choose from a small number of attractions as it is the case for small cities. Also, in most cases, large cities are more visited than small cities and collaborative filtering is useful for a larger number of users. Consequently, we illustrate results for large cities although the method is generic. In table 1, we present a sample which shows that our popularity ranking generally succeeds in finding representative and diversified elements in each city. Unexpectedly, Notre Dame is ranked lower other Parisian attractions but this is explained by the fact that Wikipedia name of the cathedral is Notre Dame de Paris and many users tag its photos only with Notre Dame. Each entry in the final list of landmarks is characterized by a city name, a landmark name and GPS coordinates.
2.2
Flickr Dataset
For personalized tourist guiding, we mine photo annotations from Flickr. The authors of [4] crawled over 30 million geotagged images from Flickr. From this, we used one million image IDs1 to
1
We thank D. Crandall for giving access to his list of Flickr IDs.
find the top 3000 contributors and downloaded the textual metadata of their photos uploaded between January 1, 2006 and June 30, 2009. From this data, we retain only unique annotations (title+tags) since some users associate the same textual metadata to a large number of photos. We have problems both of polysemy and synonymy. Flickr users are free to annotate their photos in any language they want and landmark names appear under different forms. St. Patrick’s Cathedral is also called Cattedrale
San Patrizio (Italian) or Catedral de San Patricio (Spanish).
When building the list of landmarks, we extracted synonymous names in up to 18 languages (among the best represented in Wikipedia). Since place names can be ambiguous (St. Patrick’s
Cathedral is the name for a church in over a dozen of cities), it is
necessary to disambiguate polysemous terms. Disambiguation is performed by retaining images that are tagged either with (i) a landmark name and geotags within a radius of 5 km from the GPS coordinates of the landmark, or (ii) with a landmark name and the name of the enveloping city. The second condition is added because many times user tag their photos without geotagging them. Mining tourist preferences is possible only for users who traveled in different places and tagged their photos in a sufficiently detailed manner. From the initial list of users, we retained only those who tagged photos in at least 3 cities and used at least 10 landmarks names. After applying the conditions described above, out of 3000 users, there are 1742 selected. The average number of tagged landmarks is 39 and the maximum number is 721. The data preprocessing step is performed offline since we need to compare 6,616,892 photo annotations to 25077 landmarks. The entire process took nearly 48 hours on a single Intel 1.6Ghz processor.
3.
VISIT PERSONALIZATION
Our main purpose here is to show how collaborative filtering can be adapted for visit personalization in a simple and intuitive way. Consequently, we design our visit personalization technique to comply with these three conditions of generality: (1) cover a large number of tourist destinations - to serve users in as many locations as possible; (2) discover similar users from a large community - to cover a large spectrum of preferences; (3) scale - to be applicable to a very large number of users. Our method can currently serve recommendations for 913 cities and the user similarity matrix is computed for 1742. With parallelization, both the number of destinations and the size of the community can be increased while keeping the computation time manageable.
3.1
Extracting User Similarity
We leverage implicit preferences and combine this with discovered community information. Our method is inspired by memory-based models described in [6] and, since extraction is based on implicit user feedback, can be categorized as passive filtering. To find communities of users with similar preferences, we calculate user similarity among a large sample of Flickr users. We encode each user’s trip tagging record, available after the data preprocessing step, as a simple set ( ) where each tagged landmark (L) is included as an element of the set: = { } if N landmarks were visited. The similarity of two users (x and y) is obtained by comparing these tagging sets. There exist many set and vector similarity measures and we experimented with these two:
(1) (2)
In (1), the similarity between two trip records is expressed by the cardinality of the intersection between the two sets but does not account for the cardinality of either set. In such a setting, users who provide detailed records of their trips or who have visited a lot of tourist destinations are favored compared to others. However, the intersection can be a small fraction of the largest set and represent only a small part of that user’s preferences. To evaluate the eventual negative effect of the overrepresentation of large sets, we also compute the similarity matrix with Dice’s coefficient, presented in (2).
User similarity is computed for each pair of users in the sample. Though N is theoretically the number of landmarks in our list (25077), the actual average cardinality of the trip record ( ) is only 39. In practice, for a sample of n users, the matrix computation complexity is . This complexity can be further reduced to with and equal to the average number of users who have tagged at least a landmark in common with a target user. The average complexity of adding another user to the matrix is and the matrix can be easily extended to include more users. The computation time necessary for our current sample of 1742 users is 10 hours on a single Intel 1.6Ghz processor.
3.2
Exploiting User Similarity
Tourist preferences are personal but we are assuming that predicting interesting based on similar users’ experience of the same tourist destination would be beneficial. Our community driven visit personalization algorithm is presented here:
INPUT
x : target user
Destination : new tourist destination for x
: trip record for x
Matrix : user similarity matrix
k : maximum number of retained neighbors from the
similarity matrix
FlickrRanking: fixed list of proposed landmarks for Destination ranked by popularity (used in ties)
OUTPUT
ProposedLandmarks: personalized list of landmarks for Destination determined for x based on and Matrix
ALGORITHM
INITIALIZE hashCount FOR x
SELECT nearest neighbors of x from Matrix where
include Destination FOREACH y IN
FOREACH Landmark IN
hashCount (Landmark)++
FOREACH Landmark IN hashCount
tiebreak(Landmark) = rank of Landmark in FlickrRanking
ProposedLandmarks = SORT descending hashCount(Landmark) then by tiebreak (Landmark)
The proposed algorithm is a simple adaptation to visit personalization of the k-NN algorithm. To compute a personalized list of landmarks for a user x who wants to visit Destination, we select the up to k similar users from the similarity matrix who have already tagged photos with landmarks from Destination. Sometimes k cannot be reached because there are not enough users who already visited the Destination. The algorithm is most useful when the user has to choose a small number of landmarks to visit from a large offer, that is for large cities. From the top k
neighbors, we extract a list of visited Landmarks from Destination and extract the number of different users who visited each
Landmark as well as the rank of each Landmark in the generic
popularity ranking of Destination (tiebreak).
hashCount(Landmark) stands for the interestingness of Landmark
in the community of k similar users and is the primary value used for sorting the personalized list of landmarks. tiebreak expresses the generic Flickr-based popularity of a landmark and is used only when two landmarks have the same hashCount. The intuition behind our landmark ranking scheme is that a landmark is likely to be a good prediction if it was visited by a large number of people with similar tourist preferences. If this intuition is verified, the personalized ranking will outperform the generic
FlickrRanking.
4.
EVALUATION
Evaluating personalized guiding techniques with real users during real visits is not trivial since it supposes that a representative panel of users is available. Second, evaluating two (or more) guiding techniques without mutual influence is difficult when working with real users. Third, user behavior would be altered due to the fact that participants know that they are evaluating several tourist guiding methods. Instead, we propose to evaluate our technique in an automatic manner. A baseline (generic Flickr ranking) is created to simulate a classical tourist guide. Since personalization is particularly useful in large cities, which include a large number of visitor attractions, we use an evaluation pool of 30 such cities for evaluation purposes: Amsterdam, Athens,
Bangkok, Barcelona, Beijing, Berlin, Budapest, Chicago, Hong Kong, Istanbul, Jakarta, Jerusalem, Kuala Lumpur, Manila, Melbourne, Mexico City, Montreal, Moscow, Munich, Paris, Philadelphia, Prague, San Francisco, Seattle, Seoul, Shanghai, Sydney, Tokyo, Toronto and Vienna.
For each user, we look at the list of visited cities, holding out those in the evaluation pool one at the time and reordering similar users. Reranking similar users for each evaluated city is necessary because we simulate a situation when the evaluated city was not visited by the target user and it should not influence the preference model. Removing the evaluated city at a time also gives us a list of landmarks which were really visited there (say N). An ideal personalized recommender would propose, for each destination, exactly the landmarks the user has really visited. To assess the effectiveness of the personalized and the classical guiding approach, we intersect their top N picks and the N elements that were really visited. Contrarily to an evaluation in real settings, our approach is applicable to a large number of users, is non intrusive and is based on actual user visits.
Evaluation is carried on a sample of 1742 Flickr users who have tagged at least 10 landmarks in 3 cities. For other users, we encounter the cold start problem and cannot predict interesting landmarks because they do not input enough information in the system. Such users can be guided using a baseline system which proposes the same landmarks to everyone or, if they agree to provide their location, can use a location-based guide adaptation (see Section 5). In the following subsections, our visit personalization method is analyzed in detail and we discuss the influence of the following parameters: the size of the community retained for proposing landmarks; the user similarity measure (non-normalized vs. Dice’s coefficient); the size of the sample from which similar users are retrieved; the content of each user’s tagging record. Personalization results are most interesting to
evaluate at an individual level and consequently the main evaluation criterion is the proportion of users for which the personalized guiding is more effective than a classical tourist guide approach.
4.1
Baseline
A baseline which proposes top picks for a destination (much like classical tourist guides) is created from Flickr (see Subsection 2.1 for details). To ensure that our Flickr-based popularity ranking is competitive when compared to existing tourist guides, we compare it to TripAdvisor [19], a popular online tourism platform which proposes top picks for a destination based on users’ votes. Since landmarks names vary, a manual matching was needed in order to find Wikipedia landmarks in TripAdvisor. We used TripAdvisor to build top 10 attractions list for 10 cities: Bangkok,
Barcelona, Beijing, Istanbul, Melbourne, Paris, San Francisco, Sydney, Tokyo and Toronto. In table 2, we present top 5
TripAdvisor-based landmarks for the same cities as in table 1. Table 2. Top visitor attractions in 3 cities, ranked by
popularity in TripAdvisor.
Bangkok Grand Palace, Wat Phra Kaew, Wat Pho, Wat Arun, Wat Saket
Paris Palais Garnier, Musée d’Orsay, Tour Montparnasse, Louvre, Eiffel Tower
San Francisco
Alcatraz Island, Golden Gate Bridge, Exploratorium, USS Pampanito, Ferry Building We compare the top 10 picks for 10 cities as obtained with Flickr and TripAdvisor and the intersection of the lists contains 41 common elements. The minimum overlap is obtained for Sydney (2 landmarks) while the maximum overlap is obtained for
Bangkok and Beijing (6 landmarks). Ranking differences are
reflected by the results presented in table 1 (Flickr-based ranking) and table 2 (TripAdvisor-based ranking). For Bangkok, 4 out of 5 top picks are common to the two methods (Grand Palace, Wat
Phra Kaew, Wat Pho, Wat Arun). For Paris there are two
common landmarks (Louvre and Eiffel Tower). The popularity rankings difference is explained by the fact that TripAdvisor uses a voting system whereas our ranking is based on Flickr photos. Flickr-based top picks seem more intuitive than those obtained with TripAdvisor. For instance, Louvre and Eiffel Tower, two of the best known tourist attractions in Paris, are respectively ranked first and second with Flickr but only fourth and fifth with TripAdvisor. A quantitative analysis is necessary to confirm intuition and we performed it on our 1742 user sample. Flickr-based and TripAdvisor-Flickr-based top 10 picks were compared to the landmarks that were really visited. Comparison is performed for Flickr users using aggregated Flickr data and we use a leave-one-out procedure when counting hits for each user. The major difference between Flickr and TripAdvisor is constituted by the way preferences are recorded: photo annotations in the first case and votes on a scale from 1 to 5 in the second. Out of 1742 users, the Flickr-based ranking was better in 1020 cases, a tie was obtained in 584 cases, and 138 users are better served by the TripAdvisor-based ranking. Our baseline method finds 7935 landmarks whereas the TripAdvisor-based ranking finds only 5808 landmarks. We can conclude that the Flickr-based popularity ranking outperforms an existing online tourist guide and it can be used as a baseline system for assessing the performances of the visit personalization method.
4.2
Community Size and User Similarity
(a)
(b)
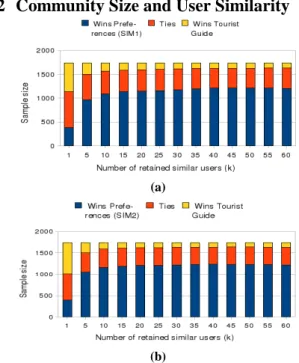
Figure 1. Distribution of the number of users for which the personalized guide is more efficient (blue) for which it is equivalent to a classical tourist guide (orange) and for which a tourist guide is more efficient (yellow), with different values of the community size (k) and for the two similarity measures. The size of the community of similar users (k) is an important parameter of our personalization method and we here examine our method’s effectiveness against proposing just the most popular sites for values of k from 1 to 60, using simple intersection in fig. 1(a) and Dice’s coefficient in 1(b) to get similar users. The variation of the personalization efficiency with the community size (k) follows the same pattern for and . A classical tourist guide approach is superior to personalized only when k = 1. For k = 5 to k = 60, personalization works better than a tourist guide in a majority of cases. The visit personalization method’s performances vary for values of k smaller or equal than 20 and are almost constant for higher values. It reaches its maximum performance when k = 50 for (1212 out of 1742 users served better by the personalized visit method) and when k = 40 for (1233 out of 1742 users served better by the personalized visit method). For the same values of k, tourist guides are more efficient than personalized guides in respectively 114, respectively 109 cases, out of 1742. These figures show that a classical tourist guide outperforms our approach only for 6.3% of the users, proving that a community driven preferences extraction is an effective personalization method. From figures 1(a) and 1(b), we deduce that, in order to obtain optimal personalization results, personalized guiding should rely on the tagging records of 30 to 50 similar users who already visited that destination. The efficiency of the personalization decreases slowly for sizes of the community larger than 50 and this tendency is explained by the fact that beyond this size, retained users start to be dissimilar and induce a smoothing effect on results.
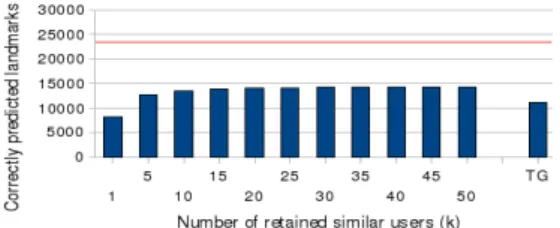
A POI oriented evaluation was also performed. We computed the total number of landmarks visits in the 30 large cities we tested (23850) and represent this maximum total by a red line. A classical tourist guide approach (TG in figure 2) predicts that
11187 landmarks out of 23850 will be visited. As for the personalized approach, the prediction accuracy varies from 8133 items when k = 1 to 14335 for k = 45. The number of correctly predicted landmarks is almost constant for values of k equal to or higher than 20. When compared to a classical tourist guide, the additional number of correctly predicted landmarks is 28.1% higher and this shows that personalization outperforms the baseline by a large margin, offering a wider and more correct set of choices to users.
Besides from user centered evaluation, we find it interesting to do a similar analysis for the number of correctly predicted landmarks and present results for different values of k, with using Dice’s coefficient as similarity measure, in figure 2.
Figure 2. Number of correctly predicted POIs for different values of k (with ) and for the classical tourist guide (TG).
The red line indicated the total number of visited POIs.
4.3
User Sample Size
Figure 3. Variation of the personalization performances when varying the pool of similar users.
The total number of users from which similar ones are retrieved is a second important parameter of our approach. It is possible to vary the user simple size ( ) by searching similar users among a fraction of the user sample. Here, we present results for between 400 and 1742, with a sampling rate of 100. The influence of the sample size is examined by using the Dice’s coefficient as user similarity measure and fixing k = 40. The results in figure 3 show when passing from a user sample size of 400 to one of 1742 users, the overall gain is of 11%. In order to emphasize the variation in this figure, we start the y-axes at 1000 rather than 0. For the minimum value of the user sample size, personalization is more effective than a classical tourist guide in 1119 cases out of 1742 whereas the entire sample is considered, personalization is more effective in 1233. The number of users which are better served by our approach increases for sample sizes up to 1300 and oscillates slightly for larger samples. The discovered influence of the user sample size on the visit personalization performances indicates that beyond a certain sample size, a larger user sample does not always translate into an improvement of results.
4.4
Tagging Record
The cardinality of the trip tagging record varies from one user to another. With Dice’s coefficient as user similarity measure and
k = 40, we examine the influence of the number of landmarks in
the trips record ( ) on the personalization performances. The user sample is split into five categories (users who tag 10 to 19 landmarks in their , users who tag 20 to 29, etc). We remind
the reader that personalization was computed only for users who tagged at least 10 landmarks from 3 different cities. The effectiveness of the personalization has an important variation for trip records that contain less than 40 landmarks and is nearly constant for more detailed trip records. For small trip records (less than 20 landmarks tagged) personalization if more efficient than a classical tourist guide for 59.6% of the users. For greater or equal to 20 and smaller than 30, 67.28% users benefit from personalization and the corresponding percentage goes up to 72.6% for the next sample of users. Personalization is beneficial to over 84% of the users who tagged their trips in a detailed manner (over 40 landmarks tagged). Interestingly, the percentage of users for which personalization is not effective does not vary a lot. Its values stay in the 4.6% - 7.1% interval. We feel that this last finding indicates that there are tourists for which personalization will not be efficient, regardless of the number of landmarks they tag. These users have a behavior that is close to the average behavior of the people visiting a city.
5.
RELATED WORK
Collaborative filtering [8] is a well-established method for distilling a community’s experience in order to recommend items in a personalized manner. Of particular interest here is memory based filtering [6] which exploits a user’s previous actions to find like-minded users and to make predictions based on their experiences. Although simple, such a model is well suited for describing visit records. Collaborative filtering can be active or passive. In the first approach, people are stimulated to vote in order to express their preferences and this generates problems such as volume of contributions and bias due to malicious users [13]. When enough data are available, passive filtering, which does not require explicit user contributions, is a very interesting alternative to active filtering. A major challenge here is the interpretation of implicit user feedback. Our approach to visit personalization is a version of passive filtering in which taking annotating tourist photos with POIs is considered as a proof of interest for the respective POI.
A consistent body of work [17], [14], [4], [11] shows that it is possible to extract valuable tourist information from photo collections. Rattenbury et al. [17] made an early attempt to discover both event and place names from Flickr geolocated textual metadata. From a large volume of volunteered geographic information, they used multiscale burst analysis to separate locations from others Flickr tags, reporting a precision of 85% (with 50% recall) using a completely automatic analysis with no linguistic filtering of the resulting data. In [14], methods for combining textual metadata from Wikipedia and Panoramio to extract place names, place coordinates, place types and popularity values were described. Crandall et al. [4] combine computer vision techniques and textual metadata analysis to extract place related information from 35 million images. For an introductory discussion of travel recommenders in the context of e-commerce, the reader can consult [18]. In the context of our current work, the most interesting type of recommender systems are content-based ones which ask users to elicit preferences in order to propose trips. The authors of [9] focus on mining similar traveling sequences from multiple users’ GPS logs while the authors of [12] retrieve maximum periodic patterns from spatio-temporal
metadata. Mobile tourist guides typically recommend nearby locations based on distance to the points of interest [2]. Surprisingly, although a large quantity of user contributed tourist information is available on the Web, it is underexploited for visit personalization. Related to our work here, Ji et al. [10] analyze blogs from a graph modeling perspective in order identify city mentions, to find representative views of landmarks in 20 cities and to propose personalized tourist suggestions. 4000 blogs and 380,000 associated pictures are analyzed. The authors define user correlation at several levels: city, scene and view and use it to recommend new locations. Their personalization model is community-driven but relies heavily on image analysis. In absence of photos on blogs, the technique returns results averaged on the entire community (a behavior that is similar to our baseline system). There are also papers which analyze tourist experience by means of user surveys or from a theoretical point of view. Cantoni et al. [3] analyze three online travel communities (Flickr, TravelBuddy, Travelistic) and conclude that the Flickr community is the most active, a characteristic that renders it appropriate for mining useful tourist information.
6.
CONCLUSION
The contributions of this paper include: application of collaborative filtering to a new domain (visit personalization) in a simple (yet efficient) and scalable way; elicitation of tourist preferences in a non intrusive manner by exploiting a user’s public tagging record; evaluation methods of tourist personalization techniques which rely on the actual experience of tourists. What one particular person wants to visit is determined by the popularity of landmarks but also by that person’s preferences. Classical tourist guides are usually organized around landmark popularity and fail to account for each visitor’s preferences. We have introduced techniques for personalizing visit guides based on one’s tagging record and on the discovery of users with similar preferences. We show that our approach outperforms classical tourist guides and analyze the introduced technique in detail, showing for instance that the personalization performances depend of the number of previously tagged landmarks. An important finding is that accurate and photo tagging is beneficial not only for other users but also for the target user, who receives personalized tourist suggestions. We plan to create more complete trip record models, including attention given to individual landmarks (time spent visiting [15], photos taken) and priority given to recent visits, and to use more complex methods for predicting interesting landmarks.
7.
ACKNOWLEDGEMENTS
This research is funded partly via the ANR Georama project (ANR-08-CORD-009).
8.
REFERENCES
[1] M. Ames, M. Naaman. Why we tag: motivations for annotation in mobile and online media. In Proc. of SIGCHI
2007 (San Jose, California, USA), p. 971 - 980.
[2] A. Beeharee et al. Exploiting real world knowledge in ubiquitous applications. Personal and Ubiquitous
Computing 11(6), 429-437.
[3] L. Cantoni, S. Tardini, A. Inversini, E. Marchiori. From Paradigmatic to Syntagmatic Communities: A Socio-Semiotic Approach to the Evolution Pattern of Online Travel
Communities. In Proc. of Information and Communication
Technologies in Tourism 2009.
[4] D. Crandall, L. Backstrom, D. Huttenlocher, J. Kleinberg. Mapping the World’s Photos. In Proc. of WWW 2009. [5] DBPedia – http:://dbpedia.org
[6] J. Delgado, N. Ishii. Memory-Based Weighted Majority Prediction. ACM SIGIR’99 Workshop on Recommender
Systems (Berkeley, CA, USA).
[7] F. Girardin, F. Dal Fiore, J. Blat, C. Ratti. Understanding of Tourist Dynamics from Explicitly Disclosed Location Information. In Proc. of the 4th International Symposium on
LBS and Telecartography (Hong-Kong, China, 2007).
[8] D. Goldberg , D. Nichols , B. M. Oki , D. Terry, Using collaborative filtering to weave an information tapestry, Communications of the ACM, v.35 n.12, p.61-70, Dec. 1992 [9] F. Gonotti, et al. Trajectory pattern mining. In Proc. of
SIGKDD 2007, pp. 330-339.
[10]R. Ji, X. Xie, H. Yao, W.Y. Ma. Mining City Landmarks by Graph Modeling. In Proc. of ACM Multimedia 2009. [11]L. Kennedy, M. Naaman. Generating diverse and
representative image search results for landmarks. In Proc. of
WWW 2008.
[12]N. Mamoulis et al. Mining, Indexing and Querying Historical Spatiotemporal Data. In Proc. of SIGKDD 2004, p. 236-245. [13]B. Mehta, T. Hofmann, W. Nejdl. Robust Collaborative
Filtering. Proc of ACM Recommender Systems 2007. [14]A. Popescu, G. Grefenstette, P.-A. Moëllic. Gazetiki:
automatic construction of a geographical gazetteer. In Proc. of JCDL 2008 (Pittsburgh, PA, June 2008).
[15]A. Popescu, G. Grefenstette, P.-A. Moëllic. Mining Tourist Information from User-Supplied Collections. In Proc. of
CIKM 2009 (Hong Kong, RPC, November 2009).
[16]T. Quack, B. Leibe, L. van Gool. World-Scale Mining of Objects and Events from Community Photo Collections, In Proc. of ACM CIVR 2008 (Niagara Falls, Canada). [17]T. Rattenbury, N. Good, M. Naaman. Towards Automatic
Extraction of Event and Place Semantics from Flickr Tags. In Proc. of SIGIR 2007.
[18]F. Ricci. Travel Recommender Systems. IEEE Intelligent
Systems, Nov. – Dec. 2002.