HAL Id: hal-03205053
https://hal.archives-ouvertes.fr/hal-03205053
Submitted on 24 Apr 2021
HAL is a multi-disciplinary open access
archive for the deposit and dissemination of
sci-entific research documents, whether they are
pub-lished or not. The documents may come from
teaching and research institutions in France or
abroad, or from public or private research centers.
L’archive ouverte pluridisciplinaire HAL, est
destinée au dépôt et à la diffusion de documents
scientifiques de niveau recherche, publiés ou non,
émanant des établissements d’enseignement et de
recherche français ou étrangers, des laboratoires
publics ou privés.
500 years of regional forest growth variability and links
to climatic extreme events in Europe
Flurin Babst, Marco Carrer, Benjamin Poulter, Carlo Urbinati, Burkhard
Neuwirth, David Frank
To cite this version:
Flurin Babst, Marco Carrer, Benjamin Poulter, Carlo Urbinati, Burkhard Neuwirth, et al.. 500 years
of regional forest growth variability and links to climatic extreme events in Europe. Environmental
Research Letters, IOP Publishing, 2012, 7 (4), pp.045705. �10.1088/1748-9326/7/4/045705�.
�hal-03205053�
LETTER • OPEN ACCESS
500 years of regional forest growth variability and
links to climatic extreme events in Europe
To cite this article: Flurin Babst et al 2012 Environ. Res. Lett. 7 045705
View the article online for updates and enhancements.
Related content
Diverse growth trends and climate responses across Eurasia’s boreal forest
Lena Hellmann, Leonid Agafonov, Fredrik Charpentier Ljungqvist et al.
-A long-term perspective on a modern drought in the American Southeast
N Pederson, A R Bell, T A Knight et al.
-Changing climate response in near-treeline bristlecone pine with elevation and aspect
Matthew W Salzer, Evan R Larson, Andrew G Bunn et al.
-Recent citations
Does individual-tree biomass growth increase continuously with tree size?
David I. Forrester
-Four-decadal series of dendrometric measurements reveals trends in Pinus sylvestris inter- and intra-annual growth response to climatic conditions
Rtilė et al
-Adaptive genetic variation to drought in a widely distributed conifer suggests a potential for increasing forest resilience in a drying climate
Claire Depardieu et al
-IOP PUBLISHING ENVIRONMENTALRESEARCHLETTERS
Environ. Res. Lett. 7 (2012) 045705 (11pp) doi:10.1088/1748-9326/7/4/045705
500 years of regional forest growth
variability and links to climatic extreme
events in Europe
Flurin Babst
1, Marco Carrer
2, Benjamin Poulter
3, Carlo Urbinati
4,
Burkhard Neuwirth
5and David Frank
1,61Swiss Federal Research Institute WSL, Z¨urcherstrasse 111, CH-8903 Birmensdorf, Switzerland 2Forest Ecology Research Unit, TeSAF Department, Univ. degli Studi di Padova, Agripolis, Legnaro
(PD), Italy
3Laboratoire des Sciences du Climat et de L’Environnement, Point courrier 129, F-91191
Gif-sur-Yvette, France
4Universita Politecnica delle Marche, Piazza Roma 22, I-60121 Ancona, Italy 5DeLaWi Tree-Ring Analyses, Preschlinallee 2, D-51570 Windeck, Germany
6Oeschger Center for Climate Change, Z¨ahringerstrasse 25, CH-3012 Bern, Switzerland
E-mail:flurin.babst@wsl.ch Received 31 July 2012
Accepted for publication 9 November 2012 Published 26 November 2012
Online atstacks.iop.org/ERL/7/045705
Abstract
Climatic extreme events strongly affect forest growth and thus significantly influence the inter-annual terrestrial carbon balance. As we are facing an increase in frequency and intensity of climate extremes, extensive empirical archives are required to assess continental scale impacts of temperature and precipitation anomalies. Here we divide a tree-ring network of approximately 1000 sites into fifteen groups of similar high-frequency growth variability to reconstruct regional positive and negative extreme events in different parts of Europe between 1500 and 2008. Synchronized growth maxima or minima within and among regions indicate eighteen years in the pre-instrumental period and two events in the 20th century (1948, 1976) with extensive radial growth fluctuations. Comparisons with instrumental data showed that the European tree-ring network mirrors the spatial extent of temperature and precipitation
extremes, but the interpretation of pre-instrumental events is challenged by lagged responses to off-growing season climate extremes. We were able to attribute growth minima in subsequent years to unfavourable August–October conditions and to mild climate during winter months associated with respiratory carbon losses. Our results emphasize the importance of carry-over effects and species-specific growth characteristics for forest
productivity. Furthermore, they promote the use of regional tree-ring chronologies in research related to climate variability and terrestrial carbon sink dynamics.
Keywords: network, productivity, high frequency, extreme event, reconstruction, tree-ring, lag effect, autocorrelation
S Online supplementary data available fromstacks.iop.org/ERL/7/045705/mmedia
Content from this work may be used under the terms of the Creative Commons Attribution-NonCommercial-ShareAlike 3.0 licence. Any further distribution of this work must maintain attribution to the author(s) and the title of the work, journal citation and DOI.
1. Introduction
Climate fluctuations operating across multiple spatiotemporal scales are key drivers of ecosystem functions and thus 1
are of crucial importance for quantifying terrestrial carbon cycle dynamics (Beer et al 2010). Over recent decades, unprecedented (Frank et al 2010) and steady (Foster and Rahmstorf2011) warming trends were observed worldwide, accompanied by severe climate extremes (Stefanon et al
2012). The warmer base climate has enhanced the occurrence probability and intensity of heat and drought events (Ballester et al 2010, Simolo et al 2011) with a five to tenfold increased likelihood of extreme temperatures in Europe anticipated by the mid 21st century (Barriopedro et al2011). However, projections of precipitation extremes are less certain (Orlowsky and Seneviratne2012) and trends in the occurrence of strong climate anomalies vary regionally and seasonally (Lupikasza et al 2011) complicating understanding of the consequences for terrestrial ecosystems and related services for human societies (Schr¨oter et al2005).
European forests normally act as a net carbon sink (Luyssaert et al 2010) with increased productivity reported over the past 50 years due primarily to warming and CO2 fertilization (Bellassen et al2011). However, extreme climate events like the 2003 summer drought may temporarily turn ecosystems into carbon sources (Ciais et al 2005) adding uncertainties to their fates particularly given the projected increases in extreme events. Furthermore, the susceptibility of forests to temperature and precipitation extremes varies regionally (Lindner et al 2010) and depends upon species-specific climate responses (Lebourgeois et al2010, Friedrichs et al2009, Babst et al2012). Lastly, carry-over effects from the previous growing season significantly influence growth performance (Fritts1976, Frank et al 2007a) and may thus mitigate or enhance impacts of seasonal climate extremes on forest productivity—an issue not considered in most ecophysiological investigations.
Extensive and precisely dated empirical datasets are required to quantify large-scale forest ecosystem performance before, during and after extreme climate events. Measure-ments of the annual radial growth increment (tree-rings) offer such possibilities by allowing forest growth to be related to climate variability at local (Panayotov et al2011), regional (Neuwirth et al 2007) and continental (Briffa et al 2002) scales. Furthermore, tree-ring chronologies can preserve growth variations over decades to millennia (B¨untgen et al
2011) and thus can record adequate numbers of extreme events, which are rare by definition (Battipaglia et al2010). Yet, effects from climate extremes occurring outside the main growing season, which may indirectly influence radial growth via nutrient storage (Kreuzwieser and Gessler2010), altered phenological phases or changes in growing season length (Moser et al 2010), are usually more difficult to detect in the respective annual ring. Such climatic events may be recorded as carry-over effects leading to a strong growth reaction in the following year (Fritts1976), however, the exact circumstances leading to lagged growth extremes have not yet been fully clarified on a large scale (Wettstein et al 2011). Improved understanding of both the immediate and lagged consequences of extreme events are crucial for interpreting growth anomalies during the pre-instrumental period as well as reducing uncertainties in ecosystem projections.
Here, we employ a continental scale tree-ring network (Babst et al 2012) to assess and reconstruct years with extremely high or low forest growth in different parts of Europe. We divide the network into sectors of similar annual variability and calculate mean tree-ring chronologies reflecting forest growth anomalies over the past five centuries. Furthermore, we compare extreme growth years at approximately 1000 sites to temperature and precipitation anomalies across Europe and test, if tree-ring networks reflect the spatial extent of climate extremes. Thereby we address extreme growth between 1500 and 2008 at sites predominantly sensitive to temperature, precipitation and mixed climatic influences. Additionally, we employ monthly temperature and precipitation data in extreme years to differentiate climate conditions leading to contemporaneous growth extremes from those conditions causing anomalous growth also or only in the subsequent year.
2. Materials and methods
2.1. Tree-ring and climate dataWe used a large tree-ring width (TRW) network of approximately 1000 sites (Babst et al 2012) of the most abundant species to assess annual forest growth variability across Europe. For the assessed time periods, all TRW chronologies had a minimum sample replication of five series and an expressed population signal (EPS) above 0.85 (Wigley et al 1984) making the network well replicated over the past five centuries. To isolate extreme growth years in tree-ring data, it is necessary to remove low-frequency signals, including the biological age trend (Fritts 1976) and long-term growth changes (Esper et al 2002). This was accomplished using a spline detrending with a 50% frequency cutoff response at 30 years which preserves inter-annual to decadal variability in the resulting standard chronologies.
For climatic analyses, we derived monthly temperature and precipitation data from a fine-spatial (1×1 km) resolution gridded climatology spanning the 1901–2006 period (see Babst et al2012 for a description). These instrumental data were detrended analogously to the tree-ring data to extract higher frequency variability.
2.2. Regional tree-ring width chronologies
We produced regionally representative tree-ring chronologies as the basis to assess and reconstruct growth extremes in different parts of Europe. Accordingly, we divided the European TRW network into fifteen groups of similar annual growth variability using a fuzzy clustering algorithm (Kaufman and Rousseeuw 1990), thereby disregarding any spatial information. The number of clusters was determined based upon sensitivity analyses of mean chronology inter-correlations (rbar) as well as cluster replication/spatial representation (appendix A). In contrast to a ‘hard’ k-means clustering which produces identical groups, the fuzzy approach additionally provides the degree of membership of a site to each of the fifteen clusters. Thus, when calculating representative mean curves, we were able to weight the
Environ. Res. Lett. 7 (2012) 045705 F Babst et al
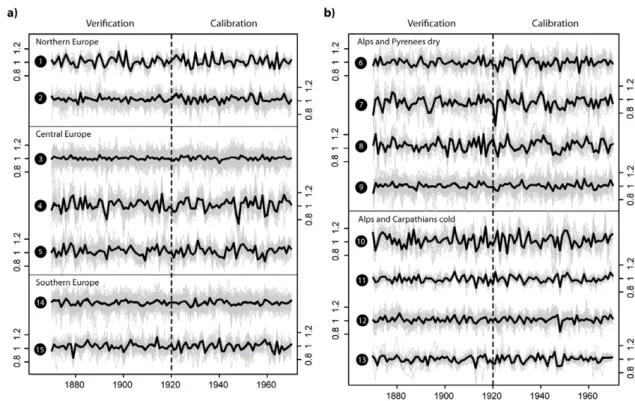
Figure 1. Calibration and verification period of fifteen high-frequency regional tree-ring chronologies (black mean curves) arranged according to sub-continental regions.
influence of each site on the resulting regional tree-ring chronologies (RTCs) by primary cluster membership to best represent the integrated forest area. Additionally, we accounted for changes in sample replication and rbar to minimize possible variance artefacts related to changes in the network composition (Frank et al2007b) and truncated RTCs where the replication dropped below five sites (figure 1). We assessed monthly climate sensitivities of each RTC between April of the year prior to ring formation and current September (appendix B). Furthermore, negative or positive growth extremes were defined when TRW was below the 5th or exceeded the 95th percentile over the cluster calibration (1920–70) and verification (1870–1919) periods (Stefanon et al2012).
2.3. Spatial climate anomalies and lagged growth extremes We compared growth extremes indicated by the tree-ring network to seasonal climate anomalies across Europe to assess common spatial patterns. This comparison was done at the site level since climate anomalies do not necessarily affect the entire areas represented by an RTC, which may therefore imprecisely reflect the spatial extent of e.g. heat waves. Each site of the tree-ring network was classified according to significant (p < 0.05) correlations with instrumental data as temperature (rtemp> 0.273, 232 sites), precipitation (rprecip> 0.273, 216 sites), or mixed (0.273 > rtemp, precip> −0.273, 544 sites) sensitive. The mixed category contains sites which are neither strongly temperature nor water limited during the April–July period which was identified as the primary season influencing forest growth integrated
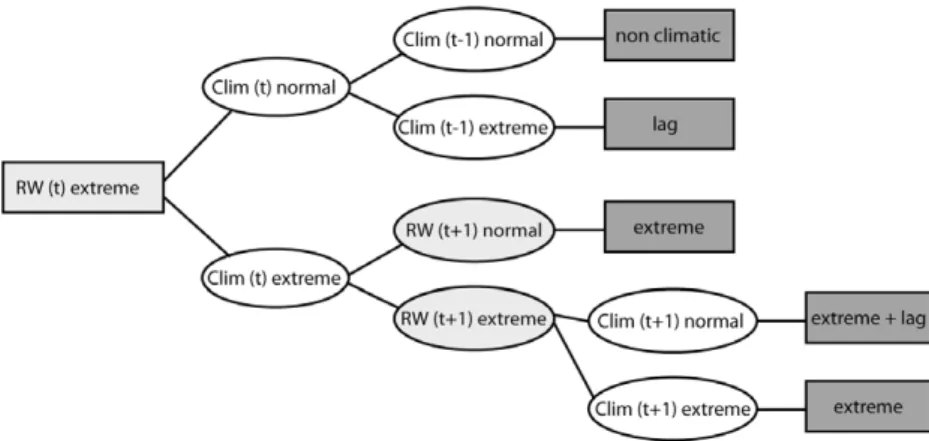
over Europe (appendix B). Lagged growth extremes in the following year, however, cannot be explained by April–July climate anomalies only. Thus, we employed monthly temperature and precipitation indices in conjunction with a simple decision tree model (figureC.1) to distinguish climate conditions leading to immediate growth extremes from those conditions causing lag effects. Subsequently we use the following abbreviations to distinguish different types of extreme responses: C-EX = growth extreme in the current year; CL-EX = growth extreme in the current and in the following year; L-EX = growth extreme in the following year.
3. Results
3.1. Regional forest growth variability
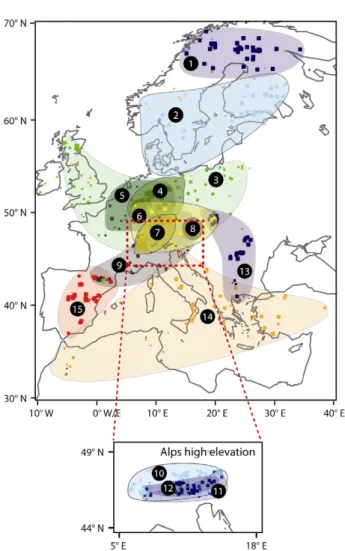
We produced fifteen RTCs representing high-frequency growth variability of forests across Europe over the past 200–800 years. These contain between 41 and 103 site chronologies with mean inter-site correlations usually above 0.3 (see tableD.1). Each RTC integrates a confined latitudinal, longitudinal and altitudinal space which emerged from a clustering solely based on annual radial growth variability (figure2). While the represented areas overlap considerably, the majority of RTCs are dominated by no more than two species (table 1). The separation of RTCs primarily emerges from differing growth patterns under normal climatic conditions. RTCs may, however, respond synchronously to climate extremes within and among regions indicating years with extensive productivity maxima or minima.
Table 1. Species composition (%) of the fifteen RTCs grouped by region (NE = northern Europe; CE = central Europe; AL = Alps low elevation; AH = Alps high elevation; SE = southern Europe). The eight most frequently represented tree species are shown individually while further species (mostly southern European pines) are summarized under the ‘other’ category.
RTC NE CE AL AH SE 1 2 3 4 5 6 7 8 9 10 11 12 13 14 15 Abies alba 0 0 1 0 0 95 7 2 15 0 0 0 0 16 4 Picea abies 0 10 15 7 0 1 29 6 13 0 20 93 98 20 4 Pinus sylvestris 100 76 25 5 0 1 37 6 17 0 2 1 0 8 42 Larix decidua 0 2 10 2 0 0 10 5 2 84 2 4 2 2 0 Pinus cembra 0 2 2 0 0 0 0 0 2 0 74 0 0 1 0 Fagus sylvatica 0 0 5 75 0 1 17 5 17 14 0 0 0 0 0 Quercus robur 0 4 31 2 64 0 0 5 13 2 0 2 0 10 0 Quercus petraea 0 0 7 9 36 0 0 6 4 0 0 0 0 3 0 Other 0 6 4 0 0 2 0 65 17 0 2 0 0 40 50
Figure 2. Geographic space represented by the fifteen regional tree-ring chronologies (RTCs). Rectangles indicate the location of individual sites and their size corresponds to membership strength. For better visibility, the high-elevation Alpine RTCs 10–12 are shown in a separate inset.
3.2. Extreme growth events between 1500 and 2008
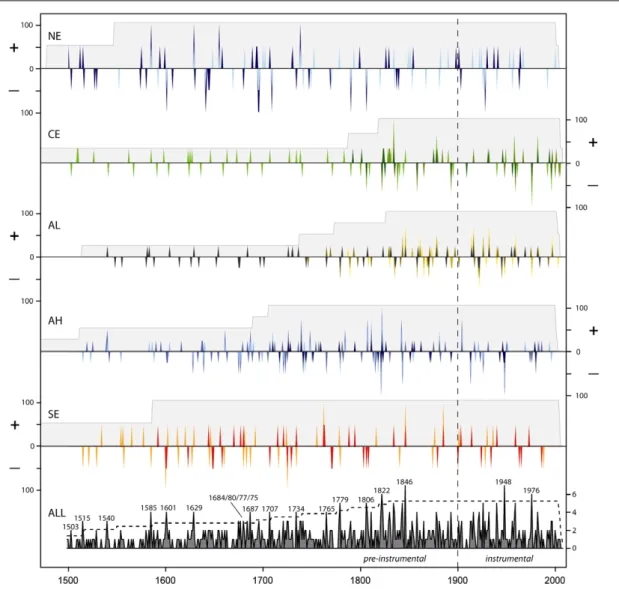
We reconstructed positive and negative growth extremes across Europe over the past 500 years based on RTCs (figure 3). In northern Europe, both RTCs show eleven common extreme events before 1901 and one event
during the early instrumental period. Sequential ex-treme years occurred on four occasions in northern (1641/42, 1644/45, 1693/94, 1695/96) and once (1695/96) in southern Scandinavia. In central Europe, conditions in 1834 and 1976 provoked a synchronous response of all RTCs. RTC 5 shows successive growth peaks in 1823/24. Within the Alpine region, RTCs are often synchronized. For the high-elevation Alpine groups, periods of frequent extreme years occurred in the 18th and 19th centuries while during the instrumental period, common growth peaks were less frequent (1913 and 1948). In southern Europe, RTCs show three positive (1762, 1846, 1885) and two negative (1600, 1725) common extreme years in the pre-instrumental period. RTC 15 indicates four occasions of subsequent growth extremes in 1600/01, 1648/49, 1762/63 and 1770/71. Combined RTCs highlight eighteen years during the pre-instrumental period and two years during the instrumental period (1948 and 1976) where forest growth was extremely high or low over large areas in Europe (figure3bottom).
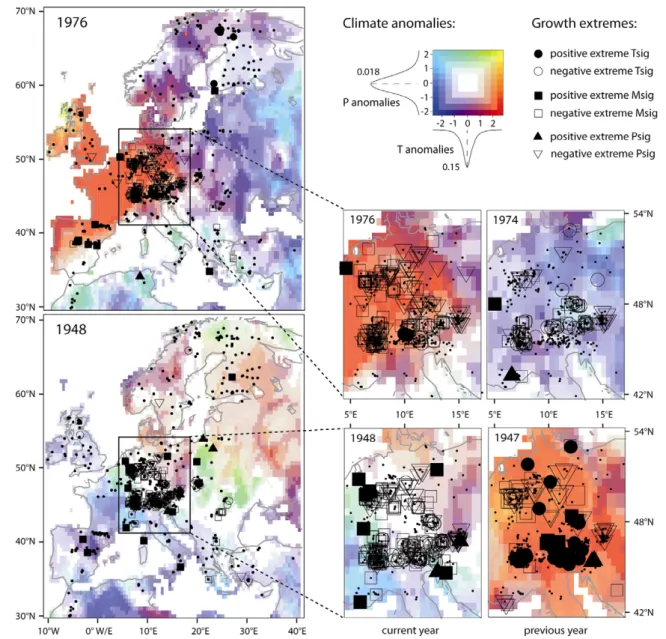
3.3. Climate and growth anomalies in space and time We assessed the spatial extent of forest growth extremes between 1500 and 2008 by mapping their annual occurrence and sign together with the expected climate sensitivity. Maps for each year during the full time period are provided in the supplementary material (available at stacks.iop.org/ERL/7/ 045705/mmedia). Direct comparisons with April–July climate anomalies were performed over the instrumental period (1901–2006) with a focus on 1976 and 1948 (figure4)—the most extreme years in the RTCs.
In 1976, exceptionally hot and dry conditions exceeding two standard deviations prevailed over central and western Europe. Furthermore, warm and wet conditions occurred on the Iberian peninsula whereas in Scandinavia and eastern Europe precipitation amounts were low. The growth impacts of this climate pattern largely agrees with the signals expected from the site specific climate responses. In central and eastern Europe, precipitation and mixed-sensitivity sites showed a negative growth extreme in response to intense drought, while mid-elevation mixed-sensitivity sites on the Iberian Peninsula benefited from warm and pluvial conditions. Most temperature sensitive sites in the Alps showed no strong
Environ. Res. Lett. 7 (2012) 045705 F Babst et al
Figure 3. Reconstruction of years with extremely high (+) or low (−) growth rates between 1500 and 2008 in different parts of Europe (NE = northern Europe; CE = central Europe; AL = Alps low elevation; AH = Alps high elevation; SE = southern Europe). Colours correspond to cluster areas presented in figure2. Peaks indicate the percentage of available RTCs (maximum indicated by grey shades) responding in each year. The bottom panel summarizes the number of RTCs with positive or negative extremes. A dashed line represents 33% of all available RTCs indicating years with extensive extreme events.
growth increase during the 1976 heat episode, likely due to legacies from low growth in 1974 (see small plot in figure4) and 1975 (see supplementary material, available atstacks.iop. org/ERL/7/045705/mmedia). In 1948, low growth occurred at many precipitation and mixed-sensitivity sites in central Europe and the low-elevation Alps, suggesting drought. This signal, however, appears to result from lagged effects driven by the previous summer drought. In 1947, low growth of forests in southern, southeastern and central Europe reflected the dry conditions whereas high-elevation sites in the Alps benefited from warm temperatures (see small plot in figure4
and supplementary material, available atstacks.iop.org/ERL/ 7/045705/mmedia). Positive growth was also observed in Great Britain due to enhanced moisture availability as well as in Scandinavia likely attributable to the expansive warmth in this year.
In the pre-instrumental period, spatial patterns of reconstructed growth extremes become less distinct with decreasing site replication back in time. Yet—while we refrain
from making direct comparisons with early instrumental data (e.g. B¨ohm et al 2010)—it is clear from our results that climatically driven and spatially pervasive extensive growth extremes occurred in Europe during the past centuries. 3.4. Contemporaneous and lagged growth extremes
We employed the European tree-ring network and monthly instrumental data in an attempt to distinguish between climate conditions leading to contemporaneous growth extremes (C-EX) and those causing lag effects (CL-EX, L-EX). A separate assessment at temperature, precipitation and mixed sensitive sites, however, did not produce robust results due to the rare occurrence of CL-EX situations during the instrumental period. Thus, we combined temperature and precipitation limited sites where we compiled monthly indices of the respective limiting climate factor in all extreme growth years. Thereby we distinguished between C-EX, CL-EX and L-EX events and calculated bootstrapped means (Boos2003) 5
Figure 4. European maps showing positive and negative growth extremes at temperature (Tsig), mixed (Msig) and precipitation (Psig) sensitive sites in 1976 and 1948. Small plots showing central Europe and the Alps at higher spatial resolution have been added for the current and previous years. Small symbols mark isolated growth extremes while large symbols indicate extreme growth also in the subsequent year. Dots point out available sites. April–July temperature and precipitation anomalies derived from CRU TS 3.0 global datasets (0.5 × 0.5◦
spatial resolution; Mitchell and Jones2005) are visualized using a bivariate colour scale (numbers indicate standard deviations). The probability density functions of T and P anomalies during the instrumental period (1901–2006) are displayed.
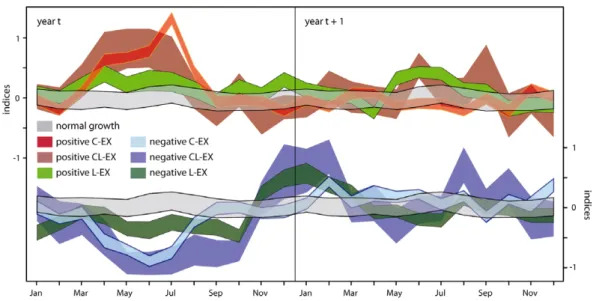
of the monthly climate indices leading to each of these three growth extreme types. Figure 5 shows the 95% confidence intervals of the means of monthly climate indices causing positive and negative growth extremes, as well as normal growth.
The robust patterns in the seasonal course of temperature and precipitation variations revealed significant differences in climate causing isolated and lagged growth extremes. C-EX growth responses (both positive and negative) are generally triggered by anomalous climate during the April–July season. In particular, ideal conditions in July lead to enhanced growth, while productivity drops depend upon a broader season. Negative CL-EX and L-EX events on the other hand are related to August–October climate. This relationship indicates, that unfavourable late summer to early
autumn conditions leads to lower forest productivity in the following year. Additionally, reduced growth limitations in winter (December–February) contribute to low growth in the subsequent summer if previous growing season climate was moderately (negative L-EX) or strongly (negative CL-EX) disadvantageous. Positive L-EX events are caused by two consecutive growing seasons with beneficial climate conditions while no clear pattern leading to positive CL-EX events was found.
4. Discussion
Understanding the impacts of climate extremes on European forests requires information on tree growth at large scales. The RTCs developed in this study integrate high-frequency
Environ. Res. Lett. 7 (2012) 045705 F Babst et al
Figure 5. Monthly climate indices at combined temperature and precipitation limited sites causing normal or extreme growth reactions. Replications are: 178 negative and 142 positive C-EX events; 19 negative and 18 positive CL-EX events; 65 negative and 123 positive L-EX events. The replication of randomly chosen normal growth events equals the mean occurrence of extremes = 90 events.
forest growth variability over extensive areas and cover longer time periods than many of the individual site chronologies. Thus, our data provide a suitable basis for the assessment of past extreme events and comparison with other data streams such as climate variability, productivity measurements from vegetation models (e.g. Kaplan et al2012), forest inventories (Corona and Marchetti 2007) or crop harvest data (Mozny et al 2012). Several RTCs—and reconstructed extreme years (see ‘all’ category in figure 3)—are dominated by individual tree species emphasizing species-specific growth characteristics under comparable climatic conditions. Thus, growth extremes of underrepresented tree species, and the extent to which mixed forests may be more resilient towards climatic extreme events, are not fully assessable using the current network. RTCs represent surprisingly confined areas, even though no spatial information was considered in the underlying grouping. Thus, forest productivity in the respective areas is expected to follow similar climatic drivers. Over long periods, however, the climate sensitivity of forests may shift due to low-frequency trends such as the 20th century warming (Lloyd and Bunn 2007, Andreu et al
2007) or changes in the atmospheric composition (Phillips et al2008). Even though the magnitude of such variations in external forcing likely varies on a continental scale, we observed synchronous growth extremes between 1500 and 2008 within and among regions. This suggests that annual growth changes during the calibration and verification periods of RTCs were reasonably consistent with inter-annual to multi-decadal growth variability over five centuries.
We identified extremely high and low growth across Europe between 1500 and 2008 (see supplementary material available at stacks.iop.org/ERL/7/045705/mmedia). Large-scale growth extremes are rare due to the offsetting responses of temperature, precipitation and mixed-sensitivity sites as well as the physical modes of the climate system with contrasting regimes during summer in southern versus
northern Europe (Trouet et al 2012, Casty et al 2007). Comparisons with climate anomalies during the 20th century suggest, that large tree-ring compilations mirror the spatial extent of temperature and precipitation extremes. A direct interpretation of pre-instrumental growth extremes is, however, complicated by seasonal variations in forests’ climate responses (Babst et al 2012) and carry-over effects from the previous year (this study, Frank et al 2007a). Many regional dendroclimatological studies found positive correlations between radial tree growth and previous summer to autumn climate (e.g. Carrer et al2010) and we observed a similar climate response of the fifteen RTCs (appendixB). It is important to note, however, that the species represented in our tree-ring network follow determinate growth mechanisms and therefore are significantly influenced by environmental conditions during bud formation (Borchert1991). Carry-over effects from the previous growing season are likely enhanced compared to species which exert indeterminate growth, but testing this hypothesis would require a vastly enlarged network. For the major European tree species, our results emphasize the importance of lagged growth extremes, as evidenced by the growth anomalies during the 1947/48 and 1976 heat and drought events in central Europe and the high-elevation Alps respectively. Importantly, we were able to reveal how characteristic patterns in temperature and precipitation anomalies over the course of more than 18 months cause immediate or lagged growth reactions.
In our continental scale tree-ring network, we at-tributed growth minima in the subsequent year to negative August–October extremes of limiting climate parameters at temperature and precipitation responsive sites. This result emphasizes the influence of autumn climate on forest growth—a factor which is expected to become even more important due to changes in ecosystem respiration caused by warming trends (Vesala et al2010). Furthermore, productivity in the subsequent year appears to be lower if growth 7
limitations are reduced during the cold season. This signal presumably derives from enhanced respiratory carbon losses at temperature limited sites caused by warm conditions outside the main growing season (Piao et al 2008). These findings contribute to the mechanistic understanding of ring formation and also are relevant for terrestrial carbon sink estimates based on dynamic global vegetation models which currently do not sufficiently consider carry-over effects in simulations of ecosystem productivity (Sitch et al2008).
5. Conclusions
High-frequency variability of European forest growth over the past 500 years is expressed by fifteen robust RTCs which are mainly separated by geographic position, climate response and species-specific growth characteristics. RTCs respond synchronously to extensive climate anomalies and indicate extreme years which are of particular interest for comparison with other data streams (e.g. crop yield). The spatial extent of strong climate anomalies is reflected by a continental scale tree-ring network, however, the direct attribution of past growth extremes to specific climatic conditions remains challenged by the intermittent occurrence of lagged responses to climate anomalies outside the current growing season. We could determine that negative lag effects are mainly caused by unfavourable August–October climatic conditions at temperature and precipitation limited sites. Our results demonstrate the merits of large empirical networks to assess the impacts of climate extremes on forest growth. In particular we provided the first continental-wide reconstruction of the timing and spatial manifestations of growth extremes during the past 500 years where the inter-annual terrestrial carbon balance was likely significantly affected. These are the first efforts to provide a long-term benchmark to place impacts of the recent extremes of 2003 in central Europe (Ciais et al
2005) and 2010 in western Russia (Stefanon et al2012) in a long-term context and may trigger further use of tree-rings
in studies related to carbon cycle dynamics and climate change.
Acknowledgments
This work was funded by the CARBO-Extreme project (FP7-ENV-2008-1-226701) and the Swiss National Science Foundation (NCCR Climate). We thank two anonymous reviewers for their helpful comments and suggestions. Furthermore, we thank Willy Tegel, Michael Grabner, Rob Wilson, Tom Levanic and Momchil Panayotov for their data contributions to the tree-ring network and Momchil Panayotov, Stefan Klesse, Jan Esper and Alicja Babst-Kostecka for fruitful comments to this study.
Appendix A. Number of regional tree-ring
chronologies
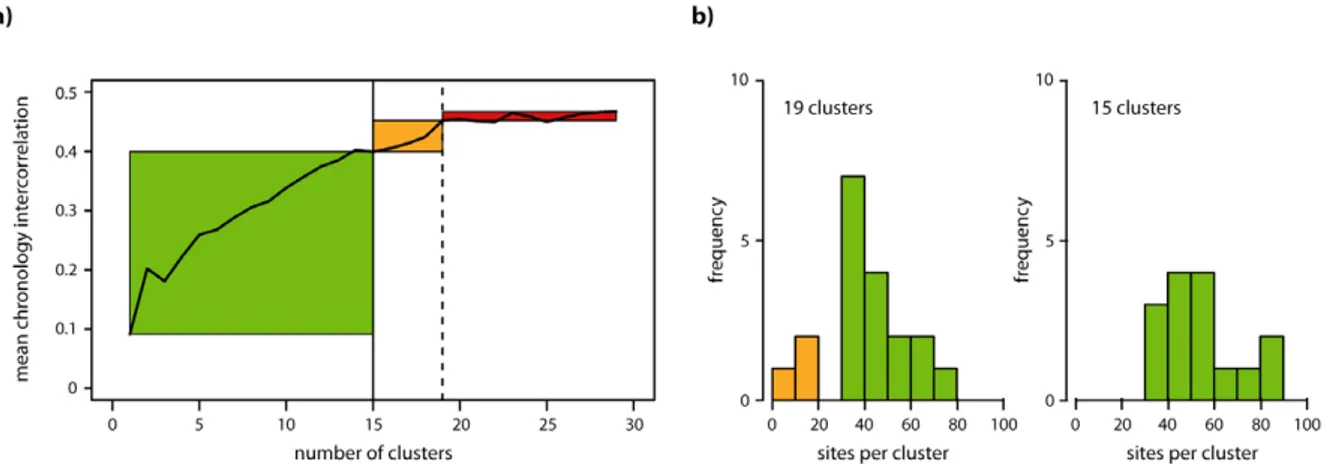
To define the optimal number of regional tree-ring chronolo-gies representing European tree growth, we performed a sensitivity analysis of changes in mean chronology inter-correlations (rbar) depending on the number of clusters chosen. Rbar increases until the tree-ring network is divided into 19 clusters, however beyond 16 clusters individual groups with very few sites and representing local conditions were obtained (figure A.1). Since our study requires robust regionally representative clusters we ended up dividing the tree-ring network into fifteen groups but tests showed that the overall results or conclusions are not sensitive to this choice. The cluster partitioning was determined over the 1920–70 period with maximum data availability and independently verified between 1870 and 1919.
Appendix B. Regional climate response
To assess the climate response of forests represented by RTCs, we generated cluster means from monthly temperature and
Figure A.1. (a) Sensitivity of mean chronology inter-correlations (rbar) to the number of clusters selected. (b) Distribution of the numbers of sites contained in 19 and 15 clusters respectively. Green areas mark a range of cluster numbers where the rbar is increasing while clusters are well replicated (>30 sites) and represent large areas. Orange areas indicate increasing rbars with simultaneously decreasing replication (>20 sites) and space represented. Red areas mark a range of cluster numbers with negligible increases in rbars.
Environ. Res. Lett. 7 (2012) 045705 F Babst et al
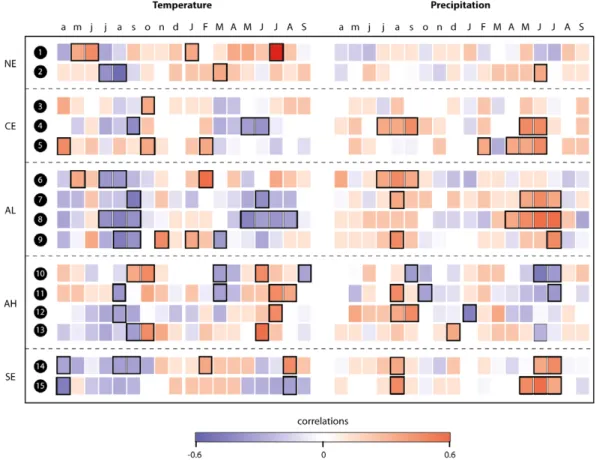
Figure B.1. Correlations between fifteen regional tree-ring chronologies (RTCs) and monthly temperature and precipitation data. Correlations are shown between April of the year prior to ring formation and current September. Black rectangles highlight significant months (r> 0.273, 95% confidence level). RTCs are grouped according to the geographic space covered (NE: northern Europe, CE: central Europe, AL: Alps low elevation<1300 m a.s.l., AH: Alps high elevation >1300 m a.s.l., SE: southern Europe).
Figure B.2. Sensitivity of average pApr-Sep climate response of RTCs to mean annual temperature (left panel) and to annual precipitation (right panel).
precipitation data analogue to the calculation of RTCs. From monthly climate responses of clusters, we identified seasons which strongly influence forest growth in different parts of Europe. Additionally, we performed a linear regression analysis between the average previous April to current September climate correlations and mean annual temperature and precipitation of each cluster to identify the strongest common drivers of forest growth across the continent.
Results show that climate during the April–July season commonly influences forest growth across Europe. On a
regional scale, however, the seasonality in the climate response varies strongly (figureB.1). July temperature is the strongest driver of forest productivity in northern Scandinavia (RTC 1) whereas in southern Scandinavia (RTC 2), spring to summer precipitation and spring temperature positively influence wood formation. Additionally, high temperatures during previous July–August hamper growth in this area. Forests in central Europe (RTCs 3–5) as well as at low to mid-elevation Alpine regions (RTCs 6–9) respond positively to April–July and in the case of RTCs 4 and 6 also to previous 9
Figure C.1. Concept to distinguish between isolated growth extremes, growth extremes with lag effects, purely lagged extremes and growth extremes which are not related to climate extremes. Climatic (white) and growth (light grey) conditions are indicated with ‘t’ representing the current growth year.
Table D.1. Properties of fifteen RTCs representing high-frequency European forest growth variability. The average elevation of RTCs are shown. Rbars represent the mean inter-chronology correlation between sites within clusters over the calibration and verification period.
Region RTC Countries Elevation (m a.s.l.) Nr. of cluster members Chronology
(repl. > 4) Rbarcalib.
Rbar verif. Northern Europe 1 FIN, SWE, NOR 301 53 1481–2006 0.66 0.63
2 FIN, SWE, NOR 373 66 1550–2003 0.23 0.17
Central Europe 3 POL, GER, GBR 619 99 1234–2008 0.09 0.07
4 GER 365 55 1819–2005 0.48 0.40
5 GER, FRA, NED 249 67 1788–2005 0.44 0.32
Alps and Pyrenees dry 6 CH, AUT, GER 958 73 1776–2004 0.43 0.38
7 CH, GER 933 41 1829–2005 0.46 0.40
8 AUT 470 46 1740–2007 0.49 0.50
9 ITA, CH, ESP 1312 103 1517–2007 0.21 0.16 Alps and Carpatians
cold
10 AUT, ITA, CH 1604 44 1382–2004 0.46 0.41 11 AUT, ITA, CH 1915 51 1515–2003 0.62 0.53 12 CH, AUT, ITA 1299 96 1693–2003 0.37 0.27 13 SVK, ROM, BUL 1480 46 1709–2004 0.51 0.38 Southern Europe 14 TUR, GRE, ITA 1103 98 1438–2004 0.11 0.10
15 ESP 1515 53 1587–2005 0.32 0.27
summer and early autumn precipitation. In addition, negative correlations with temperature during the same seasons are observed. High Alpine RTCs 10–13 generally react to more narrow time windows focusing on June–July of the current and August–October of the previous year. They benefit from warm current summer conditions while the response to previous autumn climate appears to be RTC and thus species specific. Southern European forests (RTCs 14–15) show a strong positive response to current May–June as well as to previous August precipitation. Considering the climate response of all RTCs, European forests mostly respond to the current June–August (temperature), April–July (precipitation), and the previous July–October (temperature and precipitation) seasons. Taking into account the average climate correlations over 18 months (pApr-Sep), we find that the temperature and precipitation responses of RTCs are highly sensitive to changes in mean annual temperatures and insensitive to changes in annual precipitation (figureB.2).
Appendix C. Decision tree model for lagged growth
extremes
See figureC.1.
Appendix D. Description of regional tree-ring
chronologies
See tableD.1.
References
Andreu L, Gutierrez E, Marcias M, Ribas M, Bosch O and Camarero J 2007 Climate increases regional tree-growth variability in Iberian pine forests Glob. Change Biol.
13 804–15
Babst F et al 2012 Site and species-specific responses of forest growth to climate across the European continent Glob. Ecol. Biogeogr.at press
Environ. Res. Lett. 7 (2012) 045705 F Babst et al
Ballester J, Rodo X and Giorgi F 2010 Future changes in Central Europe heat waves expected to mostly follow summer mean warming Clim. Dyn.35 1191–205
Barriopedro D, Fischer E, Luterbacher J, Trigo R and
Garcia-Herrera R 2011 The hot summer of 2010: redrawing the temperature record map of Europe Science332 220–4
Battipaglia G, Frank D, B¨untgen U, Dobrovolny P, Brazdil R, Pfister Ch and Esper J 2010 Five centuries of Central European temperature extremes reconstructed from tree-ring density and documentary evidence Global Planet. Change72 182–91
Beer Ch et al 2010 Terrestrial gross carbon dioxide uptake: global distribution and covariation with climate Science329 834–8
Bellassen V, Viovy N, Luyssaert S, Maire G, Schelhaas M and Ciais P 2011 Reconstruction and attribution of the carbon sink of European forests between 1950 and 2000 Global Change Biol.17 3274–92
B¨ohm R, Jones PD, Hiebl J, Frank D, Brunetti M and
Maugeri 2010 The early instrumental warm-bias: a solution for long Central European temperature series 1760–2007 Clim. Change101 41–67
Boos D 2003 Introduction to the bootstrap world Stat. Sci.
18 168–74
Borchert R 1991 Growth periodicity and dormancy Physiology of Treesed A Raghavendra (New York: Wiley) pp 221–45 Briffa K, Osborn T, Schweingruber F, Jones P, Shiyatov S and
Vaganov E 2002 Tree-ring width and density data around the Northern Hemisphere: part 1, local and regional climate signals Holocene12 737–57
B¨untgen U et al 2011 2500 years of European climate variability and human susceptibility Science331 578–82
Carrer M, Nola P, Motta R and Urbinati C 2010 Contrasting tree-ring growth to climate responses of Abies alba toward the southern limit of its distribution area Oikos119 1515–25
Casty C, Raible C, Stocker T, Wanner H and Luterbacher J 2007 A European pattern climatology 1766–2000 Clim. Dyn.
29 791–805
Ciais P et al 2005 Europe-wide reduction in primary productivity caused by the heat and drought in 2003 Nature437 529–33
Corona P and Marchetti M 2007 Outlining multi-purpose forest inventories to assess the ecosystem approach in forestry Plant Biosyst.141 243–51
Esper J, Cook E and Schweingruber F 2002 Low-frequency signals in long tree-ring chronologies for reconstructing past temperature variability Science295 2250–3
Foster G and Rahmstorf S 2011 Global temperature evolution 1979–2010 Environ. Res. Lett.6 044022
Frank D, B¨untgen U, B¨ohm R, Maugeri M and Esper J 2007a Warmer early instrumental measurements versus colder reconstructed temperatures: shooting a moving target Quart. Sci. Rev.26 3298–310
Frank D, Esper J and Cook E 2007b Adjustment for proxy number and coherence in large-scale temperature reconstruction Geophys. Res. Lett.34 L16709
Frank D, Esper J, Raible C, B¨untgen U, Trouet V, Stocker B and Joos F 2010 Ensemble reconstruction constraints on the global carbon cycle sensitivity to climate Nature463 527–30
Friedrichs D, Trouet V, B¨untgen U, Frank D, Esper J, Neuwirth B and L¨offler J 2009 Species-specific climate sensitivity of tree growth in Central-West Germany Trees—Struct. Funct.23 729–39
Fritts H 1976 Tree Rings and Climate Blackburn Press pp 1–567 Kaplan J, Krumhardt K and Zimmermann N 2012 The effect of land
use and climate change on the carbon cycle of Europe over the past 500 years Global Change Biol.18 902–14
Kaufman L and Rousseeuw P 1990 Finding Groups in Data: An Introduction to Cluster Analysis(New York: Wiley)
Kreuzwieser J and Gessler A 2010 Global climate change and tree nutrition: influence of water availability Tree Physiol.
30 1221–34
Lebourgeois F, Rathgeber C and Ulrich E 2010 Sensitivity of French temperate coniferous forests to climate variability and extreme events (Abies alba, Picea abies and Pinus sylvestris) J. Veg. Sci.21 364–76
Lindner M et al 2010 Climate change impacts, adaptive capacity, and vulnerability of European forest ecosystems For. Ecol. Manag.259 698–709
Lloyd A and Bunn A 2007 Responses of the circumpolar boreal forest to 20th century climate variability Environ. Res. Lett.
2 045013
Lupikasza E, H¨ansel S and Matschullat J 2011 Regional and seasonal variability of extreme precipitation trends in southern Poland and central-eastern Germany 1951–2006 Int. J. Climatol.31 2249–71
Luyssaert S, Ciais P and Piao S L 2010 The European carbon balance. Part 3: forests Glob. Change Biol.16 1429–50
Mitchell C and Jones P 2005 An improved method of constructing a database of monthly climate observations and associated high-resolution grids Int. J. Climatol.25 693–712
Moser L, Fonti P, B¨untgen U, Esper J, Luterbacher J, Franzen J and Frank D 2010 Timing and duration of European larch growing season along altitudinal gradients in the Swiss Alps Tree Physiol.30 225–33
Mozny M, Brazdil R, Dobrovolny P and Trnka M 2012 Cereal harvest dates in the Czech Republic between 1501 and 2008 as a proxy for March–June temperature reconstruction Clim. Change110 801–21
Neuwirth B, Schweingruber FH and Winiger M 2007 Spatial patterns of Central European pointer years from 1901 to 1971 Dendrochronologia24 79–89
Orlowsky B and Seneviratne S 2012 Global changes in extreme events: regional and seasonal dimension Clim. Change
110 669–96
Panayotov M, Kulakowski D, Laranjeiro L and Bebi P 2011 Wind disturbances shape old Norway spruce-dominated forest in Bulgaria For. Ecol. Manag.262 470–81
Phillips N, Buckley T and Tissue D 2008 Capacitly of old trees to respond to environmental change J. Integr. Plant Biol.
50 1355–64
Piao S et al 2008 Net carbon dioxide losses of northern ecosystems in response to autumn warming Nature451 49–51
Schr¨oter D et al 2005 Ecosystem service supply and vulnerability to global change in Europe Science310 1333–7
Simolo C, Brunetti M, Maugeri M and Nanni T 2011 Evolution of extreme temperatures in a warming climate Geophys. Res. Lett.
38 L16701
Sitch S et al 2008 Evaluation of the terrestrial carbon cycle, future plant geography and climate-carbon cycle feedbacks using five dynamic global vegetation models (DGVMs) Global Change Biol.14 2015–39
Stefanon M, D’Andrea F and Drobinski P 2012 Heatwave classification over Europe and the Mediterranean region Environ. Res. Lett.7 014023
Trouet V, Scource J and Raible C 2012 North Atlantic storminess and Atlantic Meridional Overturn Circulation during the last Millennium: reconciling contradictory proxy records of NAO variability Global Planet. Change84 48–55
Vesala T, Launiainen S and Kolari P et al 2010 Autumn temperature and carbon balance of a boreal Scots pine forest in southern Finland Biogeosciences7 163–76
Wettstein J, Littell J, Wallace J and Gedalof Z 2011 Coherent region-, species- and frequency-dependent local climate signals in northern hemisphere tree-ring widths J. Clim.24 5998–6012
Wigley T, Briffa K and Jones P 1984 On the average value of correlated time series, with applications in dendroclimatology and hydrometeorology J. Clim. Appl. Meteorol.23 201–13