WORKING
PAPERS
SES
N. 467
II.2016
FacultédesscienceséconomiquesetsocialesOn the Development of
Students’ Attitudes
towards Corruption and
Cheating in Russian
Universities
Elena Denisova-Schmidt,
Martin Huber and
1
On the Development of Students’ Attitudes
towards Corruption and Cheating in Russian Universities
Elena Denisova-Schmidt∗, Martin Huber∗∗, and Elvira Leontyeva∗∗∗ ∗ University of St. Gallen
∗∗ University of Fribourg ∗∗∗ Pacific National University
Abstract: Based on empirical data from selected public universities in Khabarovsk, Russia, this paper compares first and fifth year students regarding their attitudes towards corruption in general and university corruption in particular. Even after making both groups of students comparable with respect to a range of socio-economic characteristics by a matching approach, the results suggest that fifth year students are more open to a range of informal and corrupt practices than first years. Our analysis therefore points to the possibility that the Russian higher education system might ‘favor’ compliance with corruption and informal practices, with potentially detrimental consequences for the Russian society as a whole.
Keywords: Russia, University, Corruption, Ambivalence, Academic Dishonesty, Higher Education, Matching
JEL Classification: D73.
The preliminary results of this study were discussed at the ‘Universitet v prostranstve regiona’ conference organized by Leonid Blyakher at the Pacific National University in Khabarovsk (Russia) on 5-6 May 2014, as well as in the ‘Corruption in the Post-Soviet Educational Systems: Causes, Consequences and Control’ workshop organized by the Center for Governance and Culture in Europe, University of St.Gallen (GCE-HSG) (Switzerland), on 18 August 2014. We are grateful to Meri Avetisyan, Eduard Klein, Yaroslav Prytula, and Mikhail Sokolov for their feedback on the initial drafts of this paper.
Addresses for correspondence: Elena Denisova-Schmidt ([email protected]), University of St. Gallen (HSG), Gatterstr. 3, 9010 St. Gallen, Switzerland, Martin Huber ([email protected]), University of Fribourg, Bd. de Pérolles 90, 1700 Fribourg, Switzerland, Elvira Leontyeva ([email protected]), Pacific National University, ul. Tikhookeanskaya 136, 680035 in Khabarovsk, Russia.
∗Elena Denisova-Schmidt is also affiliated with the School of Slavonic and East European Studies of University College London (UCL-SSEES) and the Boston College Center for International Higher Education (CIHE).
2
1. Introduction
Corruption in higher education takes place in many countries (Sweeney, Despota, Lindner, 2013). While in some countries, corruption is a deviation from the norm, in others, it is essentially ‘part of the system’ (Schmidt and Huber, 2014, Schmidt and Kryzhko, 2015, Denisova-Schmidt, Huber and Prytula, 2016). Corruption might be monetary or non-monetary; the latter might be even more detrimental, because is more widespread and difficult to capture. Corruption in education, including higher education, appears particularly damaging, as it undermines public trust in one of the most important societal institutions.
In this paper, we aim at shedding light on the question of how university education might influence their students’ attitudes towards corruption. To do so, we compared first year students with students in their final year at Russian universities1 after making them comparable in a range of background characteristics (such as gender, subject, university, reasons for getting a diploma, and exposure to informal practices during secondary education) based on nearest neighbor matching, see for instance Rubin (1974). In addition to university studies, several other factors may be in play, such as a simple ageing effect (i.e. people changing their views with age), a generational effect (i.e. people born earlier having different attitudes because of different experiences during formative years), or an attitude change influenced by nearing entry into the labor market. Russia represents a very suitable case for this research question: the country has a long tradition of higher education, a high number of students – currently about 80% of the age cohort − with a minimum number of drop-outs. Moreover, the university system in Russia is very similar to the secondary school system. Students are organized in groups, have classes which they are formally required to attend and the exams to be taken in a particular semester are prescribed by the university administration.
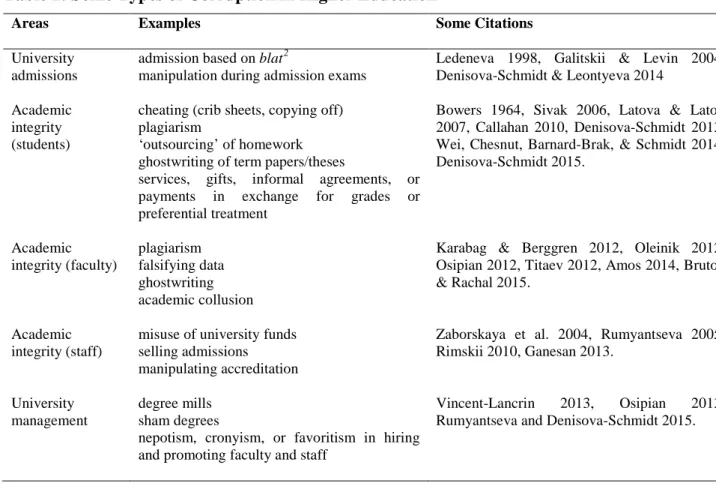
In spite of the existence of various innovative approaches to study educational corruption, many scholars work with Transparency International’s definition of corruption – ‘the abuse of entrusted power for private gain’ – and apply it to both public and private educational institutions (Chapman and Lindner 2014, Denisova-Schmidt 2015, 2016). In our paper, we use the definition provided by Transparency International as well, but expand it by examining the lack of academic integrity (Denisova-Schmidt, Huber and Prytula, 2016 and Denisova-Schmidt, Huber and Leontyeva, 2016). Violations of academic integrity might be considered in different settings: in the university admissions process, in the rules set for students, faculty and staff, in the governance of educational institutions (Heyneman 2004, 2013) (Table 1).Our results suggest that even after making first and fifth-year students comparable in a range of characteristics, fifth-year students are more open to several different types of informal and corrupt practices than first-years. Our analysis therefore points to the possibility that the Russian higher education system ‘favors’ corruption and informality.
Corruption in the educational sector is not a new phenomenon (Osipian 2007). It has been overlooked by researchers for many decades, however (Hallak and Poisson 2007, Heyneman 2013). When analyzing corruption in the educational sector today, scholars work with several definitions. Amundsen (2000) emphasizes the forms of corruption and focuses on embezzlement, bribery, fraud, extortion and favoritism. Tanaka (2001) highlights some areas of corrupt behavior: procurement,
1 In the 2012-13 academic year, there were 1,046 universities in Russia, including 609 state and 437 private schools. In
addition, there were more than 1,600 regional branches (Androushchak and Yudkevich 2012). About 40 universities have a special status; together, they enroll about 15% of all students in Russia. All of the universities receive priority financing from the state. In July 2013, 15 out of 40 universities were selected by the Ministry of Education and Science as prospective universities for entering world rankings: It was decided that least five Russian universities must enter top 100 in the world rankings and at least 15 should be in top 200 by 2020 – Project ‘5-100’ (see http://5top100.ru/ for more)(Denisova-Schmidt and Leontyeva, 2013). Moreover, since 2012, the Russian government has been regularly monitoring all institutions and differentiates between those that are effective and ineffective. The study was conducted at universities deemed effective, and not at any of the 40 schools with special status.
3
administration and classroom. Hallak and Poisson (2007) also work with areas of corrupt behavior, but provide a much broader definition. They indicate ‘finance’, ‘allocation of specific allowances’, ‘construction, maintenance and school repairs’, ‘distribution of equipment, furniture and materials’, ‘writing of textbooks’, ‘teacher appointment, management and training’, ‘teacher behavior’, ‘information systems’, ‘examinations and diplomas, access to universities’ and ‘institutional accreditation’ as areas of possible corrupt behavior. Chapman (2002) stresses several malpractices at different levels: ministries, regional/district and international agencies as well as in the classroom. Rumyantseva (2005) distinguishes between corruption with and corruption without
student involvement. Both forms of corruption influence the students’ culture and attitudes; the first
one does it directly, and the second indirectly. Osipian (2009) defines corruption in education as a
system of all informal relations aimed to regulate ‘unsanctioned access to material and nonmaterial
assets’. Our paper will offer a new perspective on the role of universities in this process: do they possibly influence students’ attitudes towards corruption? We keep in mind, however, that some other factors might influence this attitude, such as aging and labor experience. To the best of our knowledge, this is not a question that has been discussed previously. We acknowledge that our research design and (relatively small) sample can lead only to the formulation of a hypothesis for further research.
Table 1: Some Types of Corruption in Higher Education
Areas Examples Some Citations
University admissions
admission based on blat2
manipulation during admission exams
Ledeneva 1998, Galitskii & Levin 2004, Denisova-Schmidt & Leontyeva 2014
Academic integrity (students)
cheating (crib sheets, copying off) plagiarism
‘outsourcing’ of homework ghostwriting of term papers/theses
services, gifts, informal agreements, or payments in exchange for grades or preferential treatment
Bowers 1964, Sivak 2006, Latova & Latov 2007, Callahan 2010, Denisova-Schmidt 2013, Wei, Chesnut, Barnard-Brak, & Schmidt 2014, Denisova-Schmidt 2015. Academic integrity (faculty) plagiarism falsifying data ghostwriting academic collusion
Karabag & Berggren 2012, Oleinik 2012, Osipian 2012, Titaev 2012, Amos 2014, Bruton & Rachal 2015.
Academic integrity (staff)
misuse of university funds selling admissions
manipulating accreditation
Zaborskaya et al. 2004, Rumyantseva 2005, Rimskii 2010, Ganesan 2013.
University management
degree mills sham degrees
nepotism, cronyism, or favoritism in hiring and promoting faculty and staff
Vincent-Lancrin 2013, Osipian 2013, Rumyantseva and Denisova-Schmidt 2015.
The remainder of this paper is organized as follows. Section 2 introduces the data base and provides descriptive statistics. Section 3 discusses the empirical method. Section 4 presents the results. Section 5 concludes.
2 Blat in the USSR referred to the use of informal networks ‘to obtain goods and services in short supply and to find a
4
2. Data
Our data set comes from a survey based on questionnaires (n=463) that was conducted at selected universities in Khabarovsk − a major Russian city located in the Far East with a population of more than 600,000 − between 2012 and 2013. In the 2012-13 academic year, about 73,000 students were enrolled at universities in the Khabarovsk region (Obrazovanie v Rossiiskoi Federatsii 2014, 2015). More than 50% of them studied at the four universities3 covered by our study. These universities are among the better-than-average universities in Russia. The sample includes only subjects who were studying on site at state universities in three main subject areas: economics, the humanities and engineering, representing the majority of all students. The results of our pilot study showed that many students often condemn large-scale corruption involving high-profile politicians and businesspeople and overlook petty corruption – especially in cases with their personal involvement. Hence we decided to include two qualitative tools – expert interviews (n=23) and focus groups (n=7) − in order to understand the reasons for justifying corruption from the students’ point of view (Denisova-Schmidt, 2013).
We were given access to university administrative records and based on the latter, we were able to pick a random sample. This level of access is not typical in Russia, as it usually requires the approval of the rector, which is hardly possible to obtain for any studies covering corruption at universities: no one wants to air their own dirty laundry in public. The respondents were selected according to the multi-stage quota sampling. In the first stage, we defined the quota in accordance with the number of students enrolled at universities. In the second stage, we defined the quota in proportion to the number of departments. In the last stage, we invited every fifth student, alphabetically, from each group. If the student was absent, we invited the following student on the list.
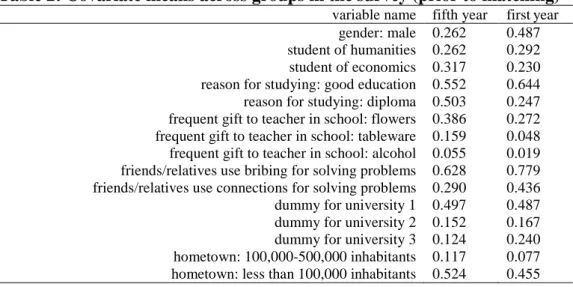
Of the 463 survey participants, 314 were first year students and 149 were in their fifth year. The first year students were typically 17 years of age, while the fifth year students were around 21. Table 2 presents the means of a range of characteristics (or covariates) for both groups of students. Previous research has pointed to other factors that might influence corrupt behavior, such as gender (women are usually less likely to be perceived as corrupt) (see, for example, Swamy, Knack, Lee, Azfar, 2001, Shaw, Katsaiti and Pecoraro, 2014 and Jetter and Walker, 2015) and experience with
corruption (people with previous personal experience with corruption and/or those who believe that
everyone around them is corrupt are more prone to corruption) (see, for example, John, Loewenstein, and Rick, 2014). Hence we included ‘gender’ as one of the variables, as well as several questions about the respondents’ previous experience with monetary and non-monetary corruption in everyday life (‘friends/relatives use bribery for solving problems’ and ‘friends/relatives use connections for solving problems’). Moreover, one of our questions pertained to ‘gifts during school time’. Gifts might be given without overt intentions as a part of the Russian academic culture (Denisova-Schmidt, 2015, 2016), but sometimes these gifts might carry certain expectations (i.e., a ‘forced’ gift that looks like a ‘free’ one) (Ledeneva, 2014). We did not distinguish this ambivalence in our study, however. We also asked our respondents about their reasons for pursuing a higher education, their living situation before university admission and their
3 In the 2012-13 academic year, about 73,000 students were enrolled at universities in the Khabarovsk region
(Obrazovanie v Rossiiskoi Federatsii 2014, 2015). More than 50% of them studied at the four universities covered by our study. We were given access to university administrative records and from those lists, we were able to pick a random sample. This level of access is not typical in Russia, as it usually requires the approval of the rector, which is hardly possible to obtain for any studies covering corruption at universities: no one wants to air their own dirty laundry in public. The respondents were selected according to the multi-stage quota sampling. In the first stage, we defined the quota in accordance with the number of students enrolled at universities. In the second stage, we defined the quota in proportion to the number of departments. In the last stage, we invited every fifth student, alphabetically, from each group. If the student was absent, we invited the following student on the list.
5
field of their studies. These characteristics might also help us to understand possible correlations with corrupt behavior (Leontyeva, 2010, Denisova-Schmidt and Leontyeva, 2015). While both genders were represented almost equally among the first year students, the majority of the final-year students were female. Important differences between sampled fifth and first year students also occur in the choice of the university and subject, the reason for obtaining a higher education, and previous exposure to informal practices and corruption during secondary schooling or through friends and relatives.
Table 2: Covariate means across groups in the survey (prior to matching)
variable name fifth year firstyear gender: male 0.262 0.487 student of humanities 0.262 0.292 student of economics 0.317 0.230 reason for studying: good education 0.552 0.644 reason for studying: diploma 0.503 0.247 frequent gift to teacher in school: flowers 0.386 0.272 frequent gift to teacher in school: tableware 0.159 0.048 frequent gift to teacher in school: alcohol 0.055 0.019 friends/relatives use bribing for solving problems 0.628 0.779 friends/relatives use connections for solving problems 0.290 0.436 dummy for university 1 0.497 0.487 dummy for university 2 0.152 0.167 dummy for university 3 0.124 0.240 hometown: 100,000-500,000 inhabitants 0.117 0.077 hometown: less than 100,000 inhabitants 0.524 0.455
It should be mentioned that it was challenging to conduct this particular survey. Some of the universities in the city are in the process of merging with other schools, while other universities were no longer in operation.4 Often, university administrations do not welcome any such empirical surveys, as they are afraid of ‘covert inspections’.5 Access to students was granted through a few professors who agreed to participate by allowing entire groups of their students to fill out questionnaires.
3. Empirical Method
In our analysis of the data, we apply a covariate matching technique – namely, nearest neighbor Mahalanobis distance matching as implemented in the ‘psmatch2’ package by Leuven and Sianesi (2003) for the statistical software ‘Stata’. This method allows us to compare first year and fifth year students in terms of corrupt behavior, while making the two groups comparable with regard to observed characteristics (or covariates) already presented in Table 2, such as their gender, hometown, subject, university, reasons for getting a diploma, frequency of presents given during secondary schooling and previous experience using connections and bribes to solve problems in
4 The Russian government plans to reduce the number of universities by 2020, eliminating up to 80% of regional
branches and up to 40% of universities (Trushin, 2015).
5 Mergers of universities also mean that some of the faculty will be dismissed and/or some of the programs will be
closed. How can Russian organizations issue lay-offs if the majority of the faculty has permanent positions and are well protected by the Russian Labor Law? How can Russian universities close any programs, if they are running successfully? One of the options is to look for formal mistakes made by the faculty and/or program administration in order to find an official reason for dismissing and/or closing. To find these mistakes ‘covert’ inspections are organized – a practice that can be traced back to Tsarist Russia. The Tsar let their officials visit Russian cities to see if the reality indeed compares to the written reports he/she received on a regularly basis. These inspections were either open or covert. The Russian-Ukrainian novelist Nikolai Gogol (1809-1852) described this practice in his book ‘The Government Inspector’ (1836).
6
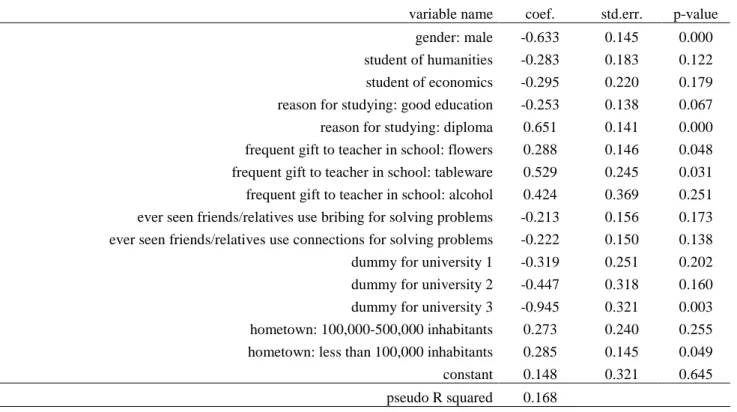
daily life. We believe that these characteristics might influence corrupt activities. Furthermore, the covariates are also statistically related to being a fifth vs. a first year student as shown in the probit regression results reported in Table A1 in the appendix, implying that both groups systematically differ in these characteristics. Therefore, the aforementioned covariates should be controlled for when investigating the differences in corrupt behavior that are merely related to being a first year or a fifth year student (net of the covariates).
More precisely, our nearest neighbor matching approach matches to each fifth year student the first year student that is most similar in terms of the covariates with replacement (implying that the same first year student can, in principle, be used as a comparison for several fifth year students whenever most similar). The idea is to generate a first year sample that is as comparable as possible to the fifth year students in these characteristics in order to investigate any remaining average differences in the corruption behavior of fifth and first year students. In the treatment of impact evaluation literature (see for instance Imbens, 2004), our estimated parameter corresponds to the ‘average treatment effect on the treated’. Note that ‘similarity in terms of the covariates’ is defined in terms
of the Mahalanobis distance.6 The standard errors of the estimated average differences are
computed based on the Abadie and Imbens (2006) variance estimator for matching.
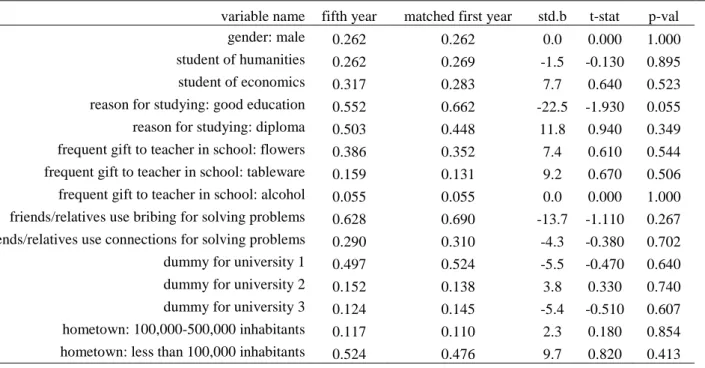
Matching is successful if it equilibrates (or balances) the covariate distributions across fifth and matched first year students, which may be investigated by so-called after-matching tests. To this end, Table 3 reports the covariate means across student groups, along with standardized biases (see Rosenbaum and Rubin, 2005) and two sample t-tests. We see that most covariates are well balanced across fifth and matched first year students, as their means are rather similar, the t-statistics on mean differences are not significant, and the standardized biases are not ‘too large’ (i.e., below an absolute value of 20; see Rosenbaum and Rubin, 2005). An exception is the dummy variable ‘reason for studying: to obtain a good education’, which has a standardized bias of -22.5 and a p-value just slightly above the 5% level of significance. All in all, matching nevertheless succeeded in making the covariate distributions between the two student groups similar.
Table 3: Covariate means across groups along with standardized biases and t-tests
variable name fifth year matched first year std.b t-stat p-val gender: male 0.262 0.262 0.0 0.000 1.000 student of humanities 0.262 0.269 -1.5 -0.130 0.895 student of economics 0.317 0.283 7.7 0.640 0.523 reason for studying: good education 0.552 0.662 -22.5 -1.930 0.055 reason for studying: diploma 0.503 0.448 11.8 0.940 0.349 frequent gift to teacher in school: flowers 0.386 0.352 7.4 0.610 0.544 frequent gift to teacher in school: tableware 0.159 0.131 9.2 0.670 0.506 frequent gift to teacher in school: alcohol 0.055 0.055 0.0 0.000 1.000 friends/relatives use bribing for solving problems 0.628 0.690 -13.7 -1.110 0.267 friends/relatives use connections for solving problems 0.290 0.310 -4.3 -0.380 0.702 dummy for university 1 0.497 0.524 -5.5 -0.470 0.640 dummy for university 2 0.152 0.138 3.8 0.330 0.740 dummy for university 3 0.124 0.145 -5.4 -0.510 0.607 hometown: 100,000-500,000 inhabitants 0.117 0.110 2.3 0.180 0.854 hometown: less than 100,000 inhabitants 0.524 0.476 9.7 0.820 0.413
6 The Mahalanobis distance is a weighted average of the discrepancies of each of the covariates between any fifth year
student and any potentially matched first year student, where the weight is proportional to the inverse of the covariance matrix of the covariates. This weighting approach at the same time normalizes the distances between covariates (giving less weight to distances with a high variance) and accounts for the covariance between distances (giving less weight to covariate distances that highly correlate with another distance). We refer to Zhao (2004) for a detailed discussion of distance metrics in matching estimators.
7
4. Results
The subsequent discussion and tables present the results of interest, namely the average differences in various measures of attitudes towards corrupt behavior across fifth year and matched first year students, along with standard errors (see ‘S.E.’) and t-statistics (see ‘T-stat’). Specifically, the tables report both the raw differences in the corruption measures before matching (see ‘Unmatched’) and after making first year students comparable to fifth year students in terms of the covariates by matching (see ‘Matched’).
Table 4: Lack of academic integrity
Areas Examples
Taking Exams copying off during exams or tests
using crib sheets and other unauthorized materials during exams Writing Papers downloading term papers (or other papers) from the internet
writing a paper by copying and pasting text from the internet
purchasing term papers (or other papers) from special agencies or from other students Communicating
with Professors
asking a professor for preferential treatment (easing requirements, exemption from an exam)
giving a professor fraudulent or misleading excuses for poor academic performance (absence from lectures, failure to meet deadlines for written papers, failure to appear for an exam)
Source: Denisova-Schmidt 2013, 2015, 2016.
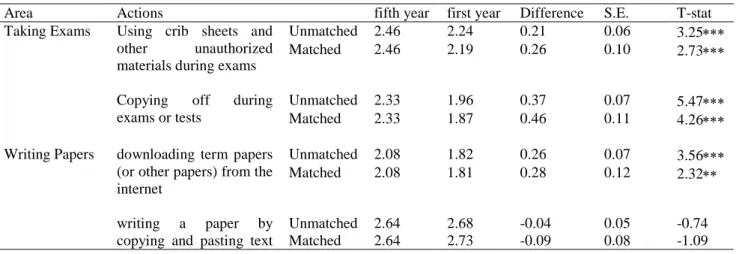
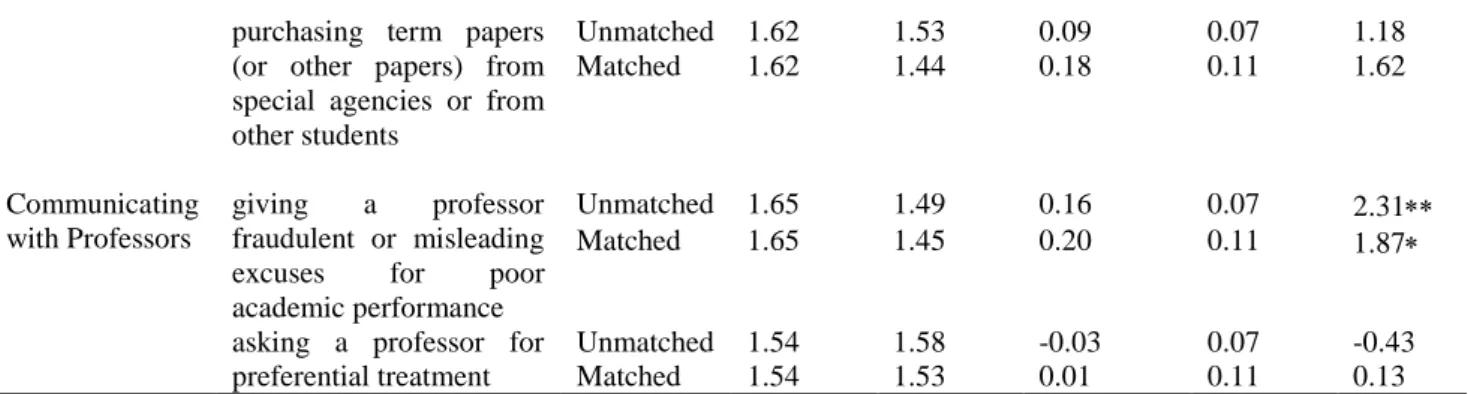
One of the questions in the survey was concerned with different cheating techniques of students when taking exams, writing papers and communicating with professors (see Table 4). Concisely, we asked students to which extent various informal practices that violate academic integrity are acceptable for them.7 The results presented in Table 5 suggest that the usage of several cheating techniques is significantly more common among fifth-year students than among first-years, even when accounting for differences in covariates: ‘using crib sheets and other unauthorized materials during exams’, ‘copying off during exams or tests’, ‘downloading term papers (or other papers) from the internet’ and ‘giving a professor fraudulent or misleading excuses for poor academic performance’ are all significant at the 10% level or even a lower level of significance.
Table 5: Students’ attitudes towards cheating techniques − Question: What practices are acceptable for you?
Area Actions fifth year first year Difference S.E. T-stat Taking Exams Using crib sheets and
other unauthorized materials during exams
Unmatched 2.46 2.24 0.21 0.06 3.25∗∗∗ Matched 2.46 2.19 0.26 0.10 2.73∗∗∗
Copying off during exams or tests
Unmatched 2.33 1.96 0.37 0.07 5.47∗∗∗ Matched 2.33 1.87 0.46 0.11 4.26∗∗∗ Writing Papers downloading term papers
(or other papers) from the internet
Unmatched 2.08 1.82 0.26 0.07 3.56∗∗∗ Matched 2.08 1.81 0.28 0.12 2.32∗∗
writing a paper by copying and pasting text
Unmatched 2.64 2.68 -0.04 0.05 -0.74 Matched 2.64 2.73 -0.09 0.08 -1.09
8 from the internet
purchasing term papers (or other papers) from special agencies or from other students Unmatched 1.62 1.53 0.09 0.07 1.18 Matched 1.62 1.44 0.18 0.11 1.62 Communicating with Professors giving a professor fraudulent or misleading excuses for poor academic performance
Unmatched 1.65 1.49 0.16 0.07 2.31∗∗ Matched 1.65 1.45 0.20 0.11 1.87∗
asking a professor for preferential treatment
Unmatched 1.54 1.58 -0.03 0.07 -0.43 Matched 1.54 1.53 0.01 0.11 0.13 Note: *, **, *** means that the mean differences between first and fifth year students are significant at the 10, 5 and 1 % level, respectively. ‘Unmatched’ refers to the raw differences prior to matching, ‘matched’ to the difference after matching on covariates. Scale of the outcome variables: 1=never, 2=rarely, 3=seldom, 4=often, 5=systematically.
Our results suggest that not only in statistical, but also in economic terms, the differences between fifth and first year students are important after making them comparable in the covariates: the means of ‘using crib sheets and other unauthorized materials during exams’ are 12% larger in the fifth than in the first year, while ‘copying off during exams or tests’ increases by 25%, ‘downloading term papers (or other papers) from the internet’ by 15%, ‘purchasing term papers (or other papers) from special agencies or from other students’ by 12.5% and ‘giving a professor fraudulent or misleading excuses for poor academic performance’ by 14%. In contrast, the differences in ‘asking a professor for preferential treatment’ and ‘writing a paper by copying and pasting text from the internet’ are both statistically and economically insignificant.
The qualitative results coming from the expert interviews and focus groups suggest that students develop ambivalent attitudes toward the lack of academic integrity. On the one hand, they condemn these practices; on the other hand, they can justify them. The reasons for legitimation are 1) time saving, 2) the lack of awareness; 3) protest; and 4) the student’s general attitude towards higher education. Students often deem different cheating techniques in academia to be time saving, especially with regard to ‘unnecessary’ classes and the need to have a job during their studies: ‘There are general subjects which are not related to the future activity of a particular specialist... To pass it, one can use a cheat sheet, in order to simply pass and forget it’. Students are often unaware that they are doing anything wrong, especially in their preparation of term papers and theses. ‘Copying and pasting’ from the internet seems to be a common method of academic writing. In some cases, students might have doubts about the content of their education in general, and about the didactical competencies of some of their professors in particular, with the result that the students do not want to spend their time and energy doing things that will not be required on the job market. Finally the tendency in Russian society to believe that only higher education can secure one’s professional future leads to the fact that many young people attending the university are not really prepared to study at such a high level. Moreover, some students tend to prepare crib sheets, but do not necessary use them or want to use them during exams; rather it is ‘a kind of preparation for an exam’. Some students download papers in order to have examples of academic writing and an impetus for their own ideas: ‘it is a good example from both the substantive and formal points of view’, that is, the students may look at the structure of such papers, the cited authors, as well as the rules of formatting (Denisova-Schmidt, 2013).
Table 6: Bribes at Universities - Question: Have you ever heard that they take bribes at the universities?
answer fifth year first year Difference S.E. T-stat
yes Unmatched 0.67 0.43 0.23 0.05 4.69*** Matched 0.67 0.44 0.23 0.07 3.10***
9
Note: *, **, *** means that the mean differences between first and fifth year students are significant at the 10, 5 and 1 % level, respectively. ‘Unmatched’ refers to the raw differences prior to matching, ‘matched’ to the difference after matching on covariates. Scale of the outcome variables: 1=yes, 0=no.
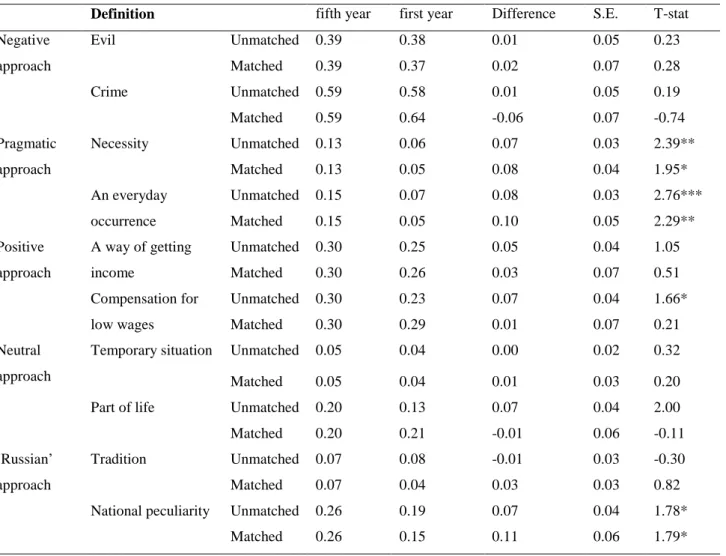
A further question concerns the awareness about monetary corruption in universities. As shown in Table 6, fifth year students more frequently state to have heard about bribes at universities than first year students (significant at the 1% level), even after making the student groups comparable in the covariates: the difference in awareness across group amounts to 52% (!). Moreover, fifth year students consider corruption more frequently as a ‘necessity’ (significant at the 10% level), a ‘national peculiarity’ (10% level) and ‘an everyday occurrence’ (5% level), see Table 7. They therefore appear to have a more pragmatic attitude towards this phenomenon than first year students. This pragmatic attitude might also be influenced by the ageing effect.
Table 7: Definition of corruption − Question: What is corruption to you?
Definition fifth year first year Difference S.E. T-stat Negative approach Evil Unmatched 0.39 0.38 0.01 0.05 0.23 Matched 0.39 0.37 0.02 0.07 0.28 Crime Unmatched 0.59 0.58 0.01 0.05 0.19 Matched 0.59 0.64 -0.06 0.07 -0.74 Pragmatic approach Necessity Unmatched 0.13 0.06 0.07 0.03 2.39** Matched 0.13 0.05 0.08 0.04 1.95* An everyday occurrence Unmatched 0.15 0.07 0.08 0.03 2.76*** Matched 0.15 0.05 0.10 0.05 2.29** Positive approach A way of getting income Unmatched 0.30 0.25 0.05 0.04 1.05 Matched 0.30 0.26 0.03 0.07 0.51 Compensation for low wages Unmatched 0.30 0.23 0.07 0.04 1.66* Matched 0.30 0.29 0.01 0.07 0.21 Neutral approach
Temporary situation Unmatched 0.05 0.04 0.00 0.02 0.32
Matched 0.05 0.04 0.01 0.03 0.20
Part of life Unmatched 0.20 0.13 0.07 0.04 2.00 Matched 0.20 0.21 -0.01 0.06 -0.11 ‘Russian’
approach
Tradition Unmatched 0.07 0.08 -0.01 0.03 -0.30
Matched 0.07 0.04 0.03 0.03 0.82
National peculiarity Unmatched 0.26 0.19 0.07 0.04 1.78* Matched 0.26 0.15 0.11 0.06 1.79* Note: *, **, *** means that the mean differences between first and fifth year students are significant at the 10, 5 and 1 % level, respectively. ‘Unmatched’ refers to the raw differences prior to matching, ‘matched’ to the difference after matching on covariates. Scale of the outcome variables: 1=never, 2=rarely, 3=seldom, 4=often, 5=systematically.
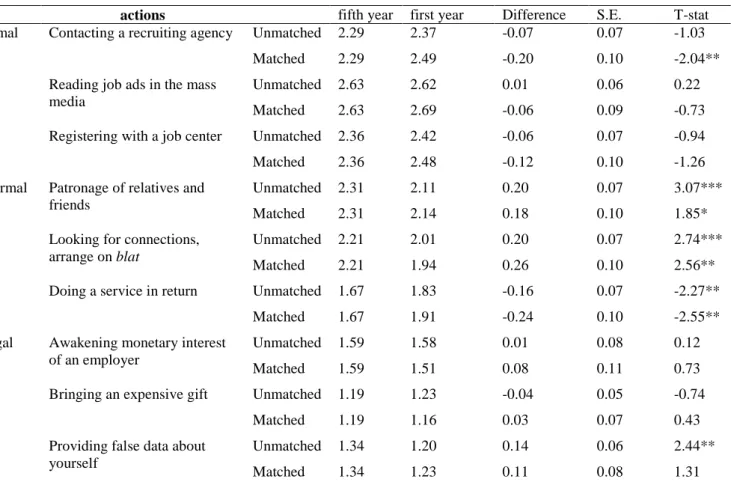
Table 8 reports differences in the subjective acceptability of formal, informal and illegal practices for job searches were codified. The results suggest that fifth year students to a significantly higher extent prefer to use informal tools such as protection from relatives and friends (significant at the 10% level) as well as blat (Ledeneva 1998) and connections (significant at the 5% level) in their job searches – practices that are considered corrupt by Transparency International, in the form of
10
nepotism and favoritism.8 In contrast, the willingness to do a service in return (another informal tool), but also to contact a recruiting agency is significantly lower (significant at the 5% level) than among (matched) first-years. No significant effects were found for the use of other formal instruments such as ‘reading job ads in the mass media’ and ‘registering with a job center’, nor for the use of such illegal job search techniques as ‘awakening the monetary interest of an employer’, ‘bringing an expensive gift’ or ‘providing false data about yourself’.
Table 8: The job search: acceptable and less acceptable tools − Question: What job search tools are acceptable according to your opinion?
actions fifth year first year Difference S.E. T-stat
Formal Contacting a recruiting agency Unmatched 2.29 2.37 -0.07 0.07 -1.03 Matched 2.29 2.49 -0.20 0.10 -2.04** Reading job ads in the mass
media
Unmatched 2.63 2.62 0.01 0.06 0.22 Matched 2.63 2.69 -0.06 0.09 -0.73 Registering with a job center Unmatched 2.36 2.42 -0.06 0.07 -0.94 Matched 2.36 2.48 -0.12 0.10 -1.26 Informal Patronage of relatives and
friends
Unmatched 2.31 2.11 0.20 0.07 3.07*** Matched 2.31 2.14 0.18 0.10 1.85* Looking for connections,
arrange on blat
Unmatched 2.21 2.01 0.20 0.07 2.74*** Matched 2.21 1.94 0.26 0.10 2.56** Doing a service in return Unmatched 1.67 1.83 -0.16 0.07 -2.27**
Matched 1.67 1.91 -0.24 0.10 -2.55** Illegal Awakening monetary interest
of an employer
Unmatched 1.59 1.58 0.01 0.08 0.12
Matched 1.59 1.51 0.08 0.11 0.73
Bringing an expensive gift Unmatched 1.19 1.23 -0.04 0.05 -0.74
Matched 1.19 1.16 0.03 0.07 0.43
Providing false data about yourself
Unmatched 1.34 1.20 0.14 0.06 2.44**
Matched 1.34 1.23 0.11 0.08 1.31
Note: *, **, *** means that the mean differences between first and fifth year students are significant at the 10, 5 and 1 % level, respectively. ‘Unmatched’ refers to the raw differences prior to matching, ‘matched’ to the difference after matching on covariates. Scale of the outcome variables: 1=never, 2=rarely, 3=seldom, 4=often, 5=systematically.
A final question concerns the students’ view on whether it is possible to overcome corruption in Russia, see Table 9. Interestingly, both first and fifth-year students are rather positive about that, as indicated by the low average score of roughly 1.3 in either group (note that 1=yes and 2=no). Mean differences are small and insignificant, both before and after matching.
Table 9: Overcome corruption in Russia − Question: Is it possible to overcome corruption in Russia?
fifth year first year Difference S.E. T-stat
Unmatched 1.28 1.25 0.02 0.04 0.55
Matched 1.28 1.25 0.03 0.06 0.44
8 This might also be explained thorough the fact that fifth-year students already have experience in searching for a job
11
Note: *, **, *** means that the mean differences between first and fifth year students are significant at the 10, 5 and 1 % level, respectively. ‘Unmatched’ refers to the raw differences prior to matching, ‘matched’ to the difference after matching on covariates. Scale of the outcome variables: 1=yes, 2=no.
Summing up, our results imply that advanced students are much more inclined to engage in informal practices and corrupt behavior than first year students. This suggests a process of learning about and/or adaptation to corrupt practices in the course of university education. Our analysis therefore points to the possibility that the Russian higher education system has, from a social perspective, an undesirable side effect on its graduates: It may make them more open to corruption or compliant with the corrupt structures in place, thus potentially hampering economic and social development in the country as a whole (see, for example, Heyneman, 2004).
However, it is important to bear the following limitations and caveats in mind when interpreting our results. First, there is the issue of potential dropout (or attrition) bias that might occur during university education and could jeopardize our matching-based comparison of fifth and first year students. It is worth noting that the dropout rate of students at Russian universities is relatively low. In a study conducted at one of the elite universities in Moscow in 2011, Gruzdev, Gorbunova and Frumin (2013) noted a dropout rate of 16% at the bachelor/specialty9 level (n=194). Even after dropping out, only 4% of the students actually left the higher education system: 40% of these dropouts continued their studies at the same university, 34% transferred to other universities, 12% planned to continue their studies and 10% had already graduated.10 A transfer from/to a different university could imply that the pool of students considered in our study changed to a small extent between the first and fifth year, but should arguably not be a major issue after matching on socio-economic characteristics. Second, our analysis does not disentangle changes in corrupt behavior which are due to university education from age effects that might occur even without higher education. While we cannot address this issue in our data (as we cannot make first and fifth-year students comparable in age for obvious reasons), our strong suspicion is that an important share of the differences is driven by the university system, given that the age difference between the groups is only a few years. At the very least, our analysis suggests that the higher education system does not prevent adolescents from becoming more inclined towards corruption over time.
Third, we asked about the personal perception and attitudes towards corruption and the lack of academic integrity, rather than about actual experiences students might have had during their university studies. We therefore followed Heyneman (2013) who advocates ‘ignoring’ the discussions about perception vs. actual evidence in analyzing corruption in the educational sector: ‘when an institution is perceived to be corrupt the damage is already done, regardless of whether guilt is manifest’. It therefore needs to be borne in mind that all our results are to be interpreted as perceived corruption rather than realized corruption. Finally, we did not question the professorate: what do they usually do if their students cheat? The latest research shows that the faculty usually does not notice and/or pretends not to notice these activities (Denisova-Schmidt and Leontyeva 2015, Rumyantseva and Denisova-Schmidt, 2015).
9
Specialty (specialitet) – the previous educational system, which culminated with a diploma.
10 This might be explained through some peculiarities of the Russian higher education system: If a student does not pass
an exam within a certain period of time (sessiia), he/she should be expelled. A student has the chance to repeat the exam, however, and if the second test is successful, his/her status as a student will be reinstated, usually in the same academic year. Moreover, students who have not completed their higher education have almost no chances on the job market and their professional future might be unclear. Young men often consider university studies in order to be exempted from military service. If they are expelled, they will be called up for their service immediately.
12
5. Conclusion
Using a student sample from selected public universities in Khabarovsk, Russia, we compared first and fifth-year students regarding their attitudes towards corruption in general and university corruption in particular. The results suggest that fifth-years are more open to a range of informal and corrupt practices than first-years even after making both groups comparable with respect to a range of socio-economic characteristics (such as gender, subject, hometown, motivation for going to university and previous experience of corruptive behavior) by matching (on the Mahalanobis distance). Our study therefore suggests that the students’ attitudes become more favorable towards corruption during their university studies, which points to the possibility that the Russian higher education system ‘favors’ compliance with corruption and informal practices. In addition to university studies, however, several other factors may be in play, such as an ageing effect (i.e. people changing with age), a generational effect (i.e. people born earlier having different attitudes because of different experience during formative years), or a nearing entry into the labor market. Nevertheless, adolescents that complete their socialization by learning various cheating techniques and by becoming more confident in corrupt practices may transfer this attitude to their professional lives, thus hampering economic and social development (s. discussions in Grimes, 2004). From a policy perspective, it therefore seems advisable to tackle university corruption as well as its ambivalence even more determinedly. More research is required in order to investigate which anti-corruption strategies are both effective and feasible. Moreover, further research needs to be conducted both to enable meaningful comparisons between first and fifth year students and to disentangle the influence of higher education from other influences. Ideally, one would set up an experiment with two groups of universities. In the first group, interventions would take place on a regular basis (i.e., corruption at these universities is explicitly prohibited), while the second group would be the “control group” that corresponds to the Russian average. When comparing the behavior of the students in one group with that of the other, one would thus be comparing students of the same age (i.e., first years in group 1 vs. first years in group 2, etc.). This would allow isolating the effect of the intervention from that of the students’ relative ages.
13
References
Abadie, A. and G. W. Imbens. 2006. “Large Sample Properties of Matching Estimators for Average Treatment Effects.” Econometrica, 74 (1): 235−267. DOI: 10.1111/j.1468-0262.2006.00655.x
Amos, K. 2014. “The Ethics of Scholarly Publishing: Exploring Differences in Plagiarism and Duplicate Publication across Nations.” Journal of the Medical Library Association, 102 (2): 87–92. doi: 10.3163/1536-5050.102.2.005
Amundsen, I. 2000. Corruption. Definition and Concepts. Bergen: Chr. Michelsen Institute. Androushchak, G. and M. Yudkevich. 2012. “Russian Higher Education: Salaries and Contracts”. In Paying the Professoriate. A Global Comparison of Compensation and Contracts, edited by P. Altbach, L. Reisberg, M. Yudkevich, G. Androushchak, and I. Pacheco, 265-278, New York: Routledge.
Bowers, W.J. 1964. Student Dishonesty and Its Control in College. New York: Columbia University.
Bruton, S. V. and J. R. Rachal. 2015. “Education Journal Editors’ Perspectives on
Self-Plagiarism”. Journal of Academic Ethics, 13 (1):13-25.
http://link.springer.com/article/10.1007%2Fs10805-014-9224-0
Callahan, D. 2010. Academic Dishonesty: Studies and Reports, 1915–2010. Resource
document. Cheating Culture.
http://www.cheatingculture.com/academic-dishonesty/2010/10/7/academic-dishonesty-studies-and-reports-1915-2010.html Accessed 17
August 2015.
Chapman, D. W. 2002. Corruption and the Educational Sector. Washington, DC:
Management Systems International. http://pdf.usaid.gov/pdf_docs/Pnact874.pdf Accessed 17
August 2015.
Chapman, D. W. And S. Lindner. 2016. ”Degrees of Integrity: the Threat of Corruption in Higher Education”, Studies in Higher Education, 41 (2): 247-268. doi: 10.1080/03075079.2014.927854
Denisova-Schmidt, E. 2013. Justification of Academic Corruption at Russian Universities: a Student Perspective. Edmond J. Safra Working Papers, No. 30. Cambridge, MA: Harvard University. http://dx.doi.org/10.2139/ssrn.2353513
Denisova-Schmidt, E. 2015. Academic Dishonesty or Corrupt Values: the Case of Russia. EU: ANTICORRP, 2015. http://anticorrp.eu/publications/academic-dishonesty-or-corrupt-values-the-case-of-russia/ Accessed 17 August 2015
Denisova-Schmidt, E. 2016. Academic Dishonesty or Corrupt Values: the Case of Russia, in: Torsello, D. ‘Corruption in Public Administration: an Ethnographic Approach’, 2016, Edgar Elgar, forthcoming.
Denisova-Schmidt, E. and M. Huber. 2014. ”Regional Differences in Perceived Corruption
among Ukrainian Firms”. Eurasian Geography and Economics, 55 (1): 10−36.
DOI:10.1080/15387216.2014.915757
Denisova-Schmidt, E., M. Huber and Y. Prytula, Y. 2016. An Experimental Evaluation of an Anti-Corruption Intervention among Ukrainian University Students. Eurasian Geography and
14
Denisova-Schmidt, E. and Leontyeva, E. (2013): Corruption in Higher Education and Research: Russia. Proceedings of Conference ‘Coping with New Legal Challenges in Education’. Kaunas, Lithuania, Vytautas Magnus University, pp. 55-62.
Denisova-Schmidt, E. and E. Leontyeva. 2014. “The Unified State Exam in Russia: Problems and Perspectives.” International Higher Education, 76: 22−23.
http://ejournals.bc.edu/ojs/index.php/ihe/article/view/5530
Denisova-Schmidt, E. and E. Leontyeva, E. 2015. Categoriia ‚neobuchaemykh‘ studentov kak
sozial’naia baza universiteta: primer dal’nevostochnykh vuzov (Engl.: ‘Un-Teachable’ Students as
the Social Basis of Universities: Examples from the Russian Far East), Sociologicheskie
Issledovaniia, 9, 90-97.
Denisova-Schmidt, E. and O. Kryzhko. 2015. „Managing Informal Business Practices in
Russia: the Experience of Foreign Companies”. Mir Rossii, 24 (4): 149-174.
https://www.hse.ru/en/mag/nohead/mirros/2015-24-4/159761463.html
Galitskii, E.B. and M.I. Levin. 2004. Korruptsiia v sisteme obrazovaniia. (Engl.: Corruption
in the Higher Education System). Moscow: GU-VSHE.
Ganesan, A. 2013. University funds Giving due diligence its due signifi cance. In G. Sweeney, K. Despota, & Lindner, S. (Eds.) Global Corruption Report: Education, Transparency International (pp. 137–141). Abingdon: Earthscan by Routledge.
Grimes, P. W. 2004. “Dishonesty in Academics and Business: A Cross-Cultural Evaluation of
Student Attitudes.” Journal of Business Ethics 49: 273–290.
http://link.springer.com/article/10.1023%2FB%3ABUSI.0000017969.29461.30
Gruzdev I.A., E.V. Gorbunova and I.D. Frumin. 2013. Studencheskii otsev v vuzach: k
postanovke problemy (Engl.: Student Dropout at Universities: Statement of the Problem). Voprosy obrazovaniia, 2, 67−81.
Hallak, J. and M. Poisson. 2007. Corrupt Schools, Corrupt Universities: What Can Be Done? Paris: International Institute for Educational Planning, UNESCO.
Heyneman, S. P. 2004. “Education and Corruption”. International Journal of Educational
Development, 24, 637-648.
Heyneman, S. P. 2013. Higher education institutions: why they matter and why corruption puts them at risk. In G. Sweeney, K. Despota, & Samira Lindner (Eds.) Global Corruption Report: Education, Transparency International (pp. 101–108). Abingdon: Earthscan by Routledge.
Imbens, G.W. 2004. “Nonparametric Estimation of Average Treatment Effects under Exogeneity: a Review”. The Review of Economics and Statistics, 86 (1), 4−29.
Jetter, M. and J. K. Walker, J. 2015. “Good Girl, Bad Boy: Corrupt Behavior in Professional Tennis.” IZA Discussion Paper No. 8824.
John, L. K., G. Loewenstein, and S. Rick. 2014. “Cheating More for Less: Upward Social Comparisons Motivate the Poorly Compensated to Cheat.” Organizational Behavior and Human
Decision Processes 123: 101–109.
Karabag, S. F., and C. Berggren. 2012. „Retraction, Dishonesty and Plagiarism: Analysis of a Crucial Issue for Academic Publishing, and the Inadequate Responses from Leading Journals in Economics and Management Disciplines.” Journal of Applied Economics and Business Research, 2(3), 172–183.
Latova, N.V. and J.V. Latov. 2007. Obman v uchebnom protzesse (Engl.: Cheating in the educational process). Obschestvennye nauki i sovremennost‘, 1, 31−46.
15
Ledeneva, A. 1998. Russia’s Economy of Favours. Blat, Networking and Informal Exchange. Cambridge: Cambridge University Press.
Ledeneva, A.V. 2014. Beyond Russia's Economy of Favours: The Role of Ambivalence. (Centre for European Politics, Security and Integration (CEPSI) Working Papers 4). Centre for European Politics, Security and Integration (CEPSI), SSEES, UCL: London, UK
Leuven, E., and B. Sianesi. 2003. PSMATCH2: Stata module to perform full mahalanobis and propensity score matching, common support graphing, and covariate imbalance testing, Software,
http://ideas.repec.org/c/boc/bocode/s432001.html Accessed 17 August 2015.
Leontyeva, E. O. 2010. Institualizatciia neformal'nykh praktik v sfere vysshego obrazovaniia, (Engl.: The institutionalization of informal practices in higher education). Doktorskaia dissertatsiia, Khabarovsk: Pacific National University.
Oleinik, A. 2012. “Institutional Transfers in the Russian System of Higher Education: a Case Study.” Journal of Economic Issues, 47 (4), 881−908. DOI: 10.2753/JEI0021-3624460403
Obrazovanie v Rossiiskoi Federatsii 2014. 2015. Statisticheckii sbornik. Moscow: GU-VSHE. Osipian, A. 2007. “Corruption in Higher Education: Conceptual Approaches and Measurement Techniques.” Research in Comparative and International Education, 4(2), 313−332.
Osipian, A. 2009. “Vouchers, Tests, Loans, Privatization: Will they Help Tackle Corruption in Russian Higher Education?” Prospects: Quarterly Review of Comparative Education, 39, 47–67. Osipian, A. 2012. “Education Corruption, Reform, and Growth: Case of Post-Soviet Russia.”
Journal of Eurasian Studies, 3(1), 20–29.
Osipian A. (2013). Recruitment and admissions Fostering transparency on the path to higher education. In G. Sweeney, K. Despota, & Lindner, S. (Eds.) Global Corruption Report: Education, Transparency International (pp. 148–154). Abingdon: Earthscan by Routledge.
Rimskii, V.L. 2010. “Sposobstvuet li sistema vysshego obrazovaniia rasprostraneniiu
korrupcii v Rossii?” (Engl.: Does the higher education system promote the spreading of corruption
in Russia?), Terra Economicus, 8(3), 91−102.
Rosenbaum, P.R. and D.B. Rubin. 1985. “Constructing a Control Group Using Multivariate Matched Sampling Methods that Incorporate the Propensity Score.” The American Statistician, 39 (1): 33−38.
Rubin, D. B. 1974. “Estimating causal effects of treatments in randomized and nonrandomized studies.” Journal of Educational Psychology, 66 (5): 688−701.
Rumyantseva, N. L. 2005. “Taxonomy of Corruption in Higher Education.” Peabody Journal
of Education, 80 (1): 81–92.
Rumyantseva, N. L. and Denisova-Schmidt, E. 2015. “Institutional Corruption in Russian
Universities”. International Higher Education, 82: 18−19.
http://ejournals.bc.edu/ojs/index.php/ihe/article/view/8871
Shaw, P., M-S. Katsaiti and B. Pecoraro 2015. On the Determinants of Educational Corruption: the Case of Ukraine. Contemporary Economic Policy, 33 (4): 698–713.
Sivak, E. V. 2006. Prestuplenie v auditorii. Determinanty nechestnogo povedeniia studentov
(plagiata i spisyvaniia). (Engl.: Crime in classes. Determinants of academic dishonesty (plagiarism
and copping). Moscow: GU-VSHE.
Swamy, A., S. Knack, Y. Lee, and O. Azfar. 2001. “Gender and corruption.” Journal of
16
Sweeney, G., K. Despota and S. Lindner (Eds.). 2013. Global Corruption Report: Education, Transparency International. Abingdon: Earthscan by Routledge.
Tanaka, S. 2001. “Corruption in Education Sector Development: a Suggestion for Anticipatory Strategy.” The International Journal of Educational Management, 15 (4): 158−166.
http://www.u4.no/recommended-reading/corruption-in-education-sector-development-a-suggestion-for-anticipatory-strategy/
Titaev, K. D. 2012. Akademicheskii sgovor. Otchego rossiiskie vuzy stanoviatsia
‚zaborostroitel’nymi institutami (Engl.: Academic collusion. Why Russian universities are
becoming ‘fence-building institutions’), Otechestvennye zapiski, 2,
http://www.strana-oz.ru/2012/2/akademicheskiy-sgovor Accessed 17 August 2015.
Trushin, A. 2015. Ostorozhno, vuzy sakruvaiutsia. Ogonek. 19.01.2015.
http://www.kommersant.ru/doc/2644693
Vincent-Lancrin, S. 2013. Cross-border higher education Addressing corruption, ensuring opportunity. In G. Sweeney, K. Despota, & Lindner, S. (Eds.) Global Corruption Report: Education, Transparency International (pp. 142–147). Abingdon: Earthscan by Routledge.
Wei, T., S. Chesnut, L. Barnard-Brak, and M. Schmidt. 2014. “University students’ perceptions of academic cheating: triangulating quantitative and qualitative findings”. Journal of
Academic Ethics, 12 (4): 287–298. DOI 10.1007/s10805-014-9219-x
Zaborovskaia, A.S., T.L. Kliatchko, I.B. Korolev, V.A. Chertets, A.E. Chirikova, L.S. Shilova and S.V. Shishkin. 2004. Vysshee obrazovanie v Rossii: pravila i real’nost‘. (Engl.: Higher education in Russia: Rules and realities). Moscow: Nesavisimyi institut sotsial’noi politiki.
Zhao, Z. 2004. “Using Matching to Estimate Treatment Effects: Data Requirements, Matching Metrics, and Monte Carlo Evidence”. The Review of Economics and Statistics, 86(1), 91−107.
17
Appendix
Table A1: Selection into being a fifth vs. a first year student based on probit regression
variable name coef. std.err. p-value gender: male -0.633 0.145 0.000 student of humanities -0.283 0.183 0.122 student of economics -0.295 0.220 0.179 reason for studying: good education -0.253 0.138 0.067 reason for studying: diploma 0.651 0.141 0.000 frequent gift to teacher in school: flowers 0.288 0.146 0.048 frequent gift to teacher in school: tableware 0.529 0.245 0.031 frequent gift to teacher in school: alcohol 0.424 0.369 0.251 ever seen friends/relatives use bribing for solving problems -0.213 0.156 0.173 ever seen friends/relatives use connections for solving problems -0.222 0.150 0.138 dummy for university 1 -0.319 0.251 0.202 dummy for university 2 -0.447 0.318 0.160 dummy for university 3 -0.945 0.321 0.003 hometown: 100,000-500,000 inhabitants 0.273 0.240 0.255 hometown: less than 100,000 inhabitants 0.285 0.145 0.049 constant 0.148 0.321 0.645 pseudo R squared 0.168
Authors
Elena DENISOVA-SCHMIDT
University of St. Gallen (HSG), Gatterstr. 3, 9010 St. Gallen, Switzerland.
Phone: +41 71 224 2581; Email: [email protected]; Website: elena-denisova-schmidt.de Martin HUBER
University of Fribourg, Faculty of Economics and Social Sciences, Chair of Applied Econometrics - Evaluation of Public Policies, Bd. de Pérolles 90, 1700 Fribourg, Switzerland. Phone: +41 26 300 8274; Email: [email protected];
Website: http://www.unifr.ch/appecon/en/team/martin-huber Elvira LEONTYEVA
Pacific National University, ul. Tikhookeanskaya 136, 680035 in Khabarovsk, Russia.
Phone: +7 924 105 57 05; Email: [email protected]; Website: http://khstu.academia.edu/ElviraLeontyeva
Bd de Pérolles 90, CH-1700 Fribourg Tél.: +41 (0) 26 300 82 00
Université de Fribourg, Suisse, Faculté des sciences économiques et sociales Universität Freiburg, Schweiz, Wirtschafts- und sozialwissenschaftliche Fakultät
Working Papers SES collection
Abstract
Based on empirical data from selected public universities in Khabarovsk, Russia, this paper compares first and fifth year students regarding their attitudes towards corruption in general and university corruption in particular. Even after making both groups of students comparable with respect to a range of socio-economic characteristics by a matching approach, the results suggest that fifth year students are more open to a range of informal and corrupt practices than first years. Our analysis therefore points to the possibility that the Russian higher education system might ‘favor’ compliance with corruption and informal practices, with potentially detrimental consequences for the Russian society as a whole.
Citation proposal
Denisova-Schmidt Elena, Huber Martin, Leontyeva Elvira. 2016. «On the Development of Students’ Attitudes towards Corruption and Cheating in Russian Universities». Working Papers SES 467, Faculty of Economics and Social Sciences, University of Fribourg (Switzerland)
Jel Classification
D73
Keywords
Russia, University, Corruption, Ambivalence, Academic Dishonesty, Higher Education, Matching
Last published
461 Bücker J.J.L.E., Furrer O., Lin Yanyan.: Measuring Cultural Intelligence: A New Test of the CQ Scale; 2015
462 Denisova-Schmidt E., Huber M., Prytula Y.: An Experimental Evaluation of an Anti-Corruption Intervention among Ukrainian University Students; 2015
463 Böhm S.: Regional Economic Integration and Factor Mobility in Unified Germany; 2015 464 Grossmann V., Strulik H.: Optimal Social Insurance and Health Inequality; 2015
465 Baguet M., Dumas C.: Birth weight and long-term outcomes in a developing country; 2015
466 Bodory H., Camponovo L., Huber M., Lechner M.: The finite sample performance of inference methods for propensity score matching and weighting estimators; 2016
Catalogue and download links
http://www.unifr.ch/ses/wp
http://doc.rero.ch/collection/WORKING_PAPERS_SES
Publisher