HAL Id: hal-01480761
https://hal.archives-ouvertes.fr/hal-01480761
Submitted on 3 Apr 2017
HAL is a multi-disciplinary open access
archive for the deposit and dissemination of
sci-entific research documents, whether they are
pub-lished or not. The documents may come from
teaching and research institutions in France or
abroad, or from public or private research centers.
L’archive ouverte pluridisciplinaire HAL, est
destinée au dépôt et à la diffusion de documents
scientifiques de niveau recherche, publiés ou non,
émanant des établissements d’enseignement et de
recherche français ou étrangers, des laboratoires
publics ou privés.
Scanning Electrochemical Microscopy of
Belousov–Zhabotinsky Reaction: How Confined
Oscillations Reveal Short Lived Radicals and
Auto-Catalytic Species
T. Jane Stockmann, Jean-Marc Noël, Sandra Ristori, Catherine Combellas,
Ali Abou-Hassan, Federico Rossi, Frédéric Kanoufi
To cite this version:
T. Jane Stockmann, Jean-Marc Noël, Sandra Ristori, Catherine Combellas, Ali Abou-Hassan, et al..
Scanning Electrochemical Microscopy of Belousov–Zhabotinsky Reaction: How Confined Oscillations
Reveal Short Lived Radicals and Auto-Catalytic Species. Analytical Chemistry, American Chemical
Society, 2015, 87 (19), pp.9621-9630. �10.1021/acs.analchem.5b01238�. �hal-01480761�
Scanning Electrochemical Microscopy of
Belousov-Zhabotinsky Reaction: How Confined Oscillations Reveal
Short Lived Radicals and Auto-Catalytic Species.
T. JaneStockmann,a Jean-Marc Noël,a Sandra Ristori,b Catherine Combellas,a Ali Abou-Hassan,c Federico Rossi,d and Frédéric Kanoufia,†
aSorbonne Paris Cité, Paris Diderot University, Interfaces, Traitements, Organisation et Dynamique des Systèmes,
CNRS-UMR 7086, 15 rue J.A. Baif, 75013 Paris, France.
b
Department of Earth Sciences & CSGI, Via della Lastruccia 3, 50019 Sesto Fiorentino, Firenze, Italy
c
Université Pierre et Marie Curie, Laboratoire Physico-chimie des Electrolytes et Nanosystèmes Interfaciaux, CNRS-UMR 8234, 4 place Jussieu, 75005 Paris, France.
d
Department of Chemistry and Biology, University of Salerno, Via Giovanni Paolo II, 132, 84084, Fisciano (SA), Italy
ABSTRACT: The effect of confinement on the Belousov-Zhabotinksy (BZ) oscillating reaction, (employing ferroin as a catalyst
and malonic acid as the organic substrate) has been investigated using scanning electrochemical microscopy (SECM) toward differ-ent insulating surfaces such as glass, silanized glass, or PTFE. An unexpected increase in the amplitude of the BZ reaction at a tip-substrate distance of ~12-15 µm was observed. By simulating different reaction mechanisms, from simple EC′ catalysis, to more sophisticated Oregonator or full scheme, it is shown that such behavior reveals the intervention of redox catalysis processes and particularly the short lived highly reactive radical intermediate BrO2
•
indirectly detected at the µM concentration. The re-inspection of the EC′ mechanism shows how the intervention of the homogeneous catalysis route is easily confirmed and kinetically character-ized from SECM towards an insulating substrate, with promising potentiality in many systems. More specifically to the complex chemical case of BZ reactions, the mechanism is understood from the envelope curves of the oscillations, which are assessed in the absence of the oscillation (absence of organic substrate).
1. – INTRODUCTION
The synergism of complex, out-of-equilibrium chemical re-actions responsible for homogeneous redox catalysis,1,2rely on a redox catalyst couple (Ox/Red)to act as an electron shuttle and transfer electrons to an electroactive species (A for exam-ple in (2) and B its reduced form):3,4
The success of such a EC’ catalytic reaction scheme comes from the feedback due to the regeneration of Ox and also because the electron shuttle drives the reduction of A at a potential more positive than its direct reduction. This mecha-nism has been popularized in many molecular and biomolecu-lar systems, from: organic electrochemistry5 or molecular electrocatalysis, where it is involved in proton coupled elec-tron transfer processes,6 important for molecular solutions to energy conversion; or in many homogenenous biomolecular processes;7 to electrochemically-driven cross-coupling reac-tions,8,9 in atom-transfer radical polymerization,10or in multi-reaction chemical processes as Electrochemiluminescent (ECL) 11-13 and oscillating reactions.
These are complex, coupled multi-reaction systems, operat-ing far from equilibrium, with positive and negative feedback loops that cause the reaction coordinate to transition between different concentration states.14,15 These reactions have been incorporated into ionic liquids,16,17 along with polymers and
gels,18-21 where they have generated unassisted or autonomous movement through swelling/deswelling events. The most famous example, the Belousov-Zhabotinsky (BZ) reaction, involves the oxidation of an organic substrate, typically malo-nic acid, by bromate in the presence of an excess of strong acid.14,15,22 The overall shift in concentration is monitored through a redox catalyst such as cerium IV,22,23 a variety of ruthenium complexes,21,24,25 ferroin,18,26,27 that are conveniently redox and/or photo-active. The BZ reaction has been widely studied in many experimental configurations22,28 including in confined environment by incorporating it inside synthetic vesicles for example. Interestingly, such system shows analo-gies to biological systems, particularly mimicking intercellular communication.26,29,30 Thus, evaluating the kinet-ics/thermodynamics of such reactions in a confined environ-ment is a unique challenge for microfluidics.14,26,31-34 Scanning electrochemical microscopy (SECM), with its recognized high mechanistic sensitivity, is proposed here as an interesting alternative.
SECM has been used extensively for interrogating the reac-tivity of chemical species in solution, at a substrate,3,4,35-43 as well as for characterizing short-lived radical species.
37,39-41,43
Therefore, from both geometric and mechanistic aspects, SECM is ideal to interrogate oscillating chemical reactions in confined conditions. SECM is also employed to differentiate between spatiotemporal effects and purely chemical ones, through quantification of the kinetics/dynamics of
confine-2
ment –i.e. between the tip and substrate. This also provides a convenient analog for the study of confinement vis-à-vis inside vesicles. An unexpected confinement effect was demonstrated and characterized using simulations of increasing complexity. Starting from the simplest EC′ mechanism reinspected here for simpler SECM configuration (negative feedback) than the generation-collection one,3,4 SECM is applied to comprehend complex catalytic systems, such as the BZ reaction. The de-tailed model of the BZ reaction reproduces the experimental observation, highlighting the intervention of short-lived radi-cal intermediates.
EXPERIMENTAL
All reagents were purchased commercially and used without purification (complete list provided in the Supporting Informa-tion, SI). Stock aqueous solutions of ferroin sulphate salt (Fe(phen)3SO4) were prepared by mixing 1,10-phenanthroline
(phen) and iron (II) sulfate in a molar ratio of 3:1. Aqueous solutions were prepared using Milli-Q ultrapure purified water (>18.2 MΩ∙cm).
Typical BZ reaction solutions are made from 2 mM ferroin, 1 M H2SO4, 120 mM malonic acid and 180 mM NaBrO3.
Microelectrodes were prepared in a procedure described elsewhere44 and detailed in the SI. Approach curves were measured by biasing the microelectrode on the ferriin to fer-roin reduction plateau (Fe(phen)3
3+
+ e− → Fe(phen)3 2+
) ET=0.1 V versus a Pt counter/quasi-reference as determined
through cyclic voltammetry (CV in Figure S5). Approach curves in the feedback mode were performed at a rate of 1 µm∙s−1 whereas in transient mode, the tip-substrate distance was changed periodically every 5µm while an average of ~10 oscillations was recorded for each distance.
A Drop Shape Analyzer (DSA30, Krüss GmbH, Villebon sur Yvette, France) was employed for water contact angle measurements of silanized Glass (preparation described in SI).
SIMULATIONS
Details of the finite element simulations by COMSOL are given in the SI. Briefly, different catalytic schemes, starting from the simple EC’ case, were considered in the SECM con-figuration with an insulating substrate (unless otherwise stated). It consists in solving the time-dependent diffusion equations for the different species involved with consideration of their net generation from chemical reactions in solution. Transformation of ferriin and ferroin at the microelectrode surface provides the tip current. Approach curves are simu-lated as steady-state or long-time (>100s) tip current values evaluated at different tip-substrate distances. The time evolu-tion of the tip current simulates oscillaevolu-tions.
2. RESULTS AND DISCUSSION
2.1 EC′ Mechanism by SECM Approach Curves
Simulation of the EC′ scheme in the SECM configuration with a conducting substrate can be found elsewhere,3,4 along with strategies to extract the kinetics of the catalytic reaction from feedback collection between the tip and a conducting substrate. Since insulating substrates are intrinsically easier to produce than perfectly conducting ones, a simpler strategy for kinetic analysis of EC′processes relies on the SECM probe approach curve towards an insulating substrate in the presence of the appropriate EC′ counterparts – namely Ox and A. The
tip, of radius a, is held at large tip-substrate distances (d > 10a), and biased at a potential negative enough to produce Red (eq. 1) under mass-transfer limit. The steady-state current (iinf) is limited by the diffusion of Ox/Red and
3,38
the catalytic regeneration of Ox by (2). The direct estimate of the catalytic reaction rate khomo of reaction (2) may then be obtained from
comparison of iinf in the absence and presence of A, as
illus-trated through a plot of iinf versus khomo in Figure S1.
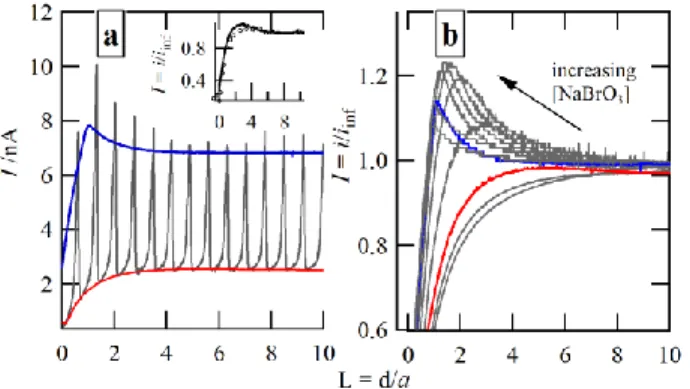
Figure 1: Simulated SECM approach curves using the EC′ mech-anism (eqs. 1 and 2) with khomo from 10−4 to 3000 M−1∙s−1[a] and
3000 to 107 M−1∙s−1[b]; 25 µm diameter tip with Rg=5.
The simulated approach curves for EC’ schemes are pro-vided in Figure 1 for different catalytic rates, khomo, under the
condition such that A is in excess. Normalization of the re-corded tip current, iT, by its value at large distance, iinf,
facili-tates comparison, even though it is recalled that iinf increases
with khomo.
Typically in the absence of A, or for low catalytic regenera-tion compared to Ox diffusion (khomo[A]a
2
/DOx/Red < 0.01), as
the tip approaches the insulating substrate, diffusion of Ox to the electrode surface is hindered, resulting in a negative feed-back response (black line in Figure 1a).When increasing the catalytic rate, khomo, the homogeneous catalytic reaction
gener-ates a concentration change at the tip as the catalyst consumes Red to regenerate Ox in a reaction layer that decreases as khomo
increases. This reaction layer may be smaller than the dimen-sions of the tip and its perturbation by the substrate (decrease of i/iinf) is observed for shorter tip-substrate separation
dis-tances – i.e. shorter values of L = d/a – than for the standard negative feedback regime. The increase of khomo then yields a
compaction of the approach curve towards the substrate (Fig-ure 1a). Upon further increase of khomo, the approach curve
then departs from the substrate and tends again towards the standard negative feedback curve (Figure 1b). In this regime of khomo values, the catalytic reaction is so fast that the process
is driven by the diffusion of A and no longer by Ox/Red, while the negative feedback refers to diffusion hindrance of A. This is further exemplified through a plot of Imin = imin/iinf versus
khomo, in Figure S1b, such that Imin taken at L=0 undergoes an
increase as khomo approaches 3000 M −1∙s−1
and subsequently decreases. Interestingly, from a mechanistic point of view, a precise kinetic analysis of khomo can be obtained by SECM
approach curves towards an insulating substrate.
The full illustration of such mechanistic approach is further demonstrated in the complex chemical situation encountered in BZ oscillating reactions.
3
2.2 Approach Curves in BZ Solution with Malonic Acid.
Figure 2: [a] Probe approach curve using a 25 µm diameter Pt disk tip (Rg = 5) towards a glass substrate with a BZ aqueous
solution composed of 180 mM NaBrO3, 120 mM malonic acid,
1 M H2SO4, and 2 mM ferroin. [b] Probe approach curves
ob-tained in transient mode from the maximum (○) and minimum (●) oscillation current. Insets correspond to ~10 oscillations recorded at the distance indicated.
The kinetics of the BZ reaction were examined experimen-tally using SECM probe approach curves as described in the experimental section and the SI. Briefly from a BZ solution containing Fe(phen)3
3+
, a SECM tip generating Fe(phen)3 2+
is approached to a glass substrate while the BZ reaction cycle catalytically regenerates Fe(phen)3
3+
.
At L > 10, iinf oscillates with time, undergoing a sharp
in-crease in amplitude that is followed by a rapid decay period, which subsequently repeats with a period of ~12-15 s, in ex-cellent agreement with our previous results26 and with other literature data14,18,23 for similar BZ systems. The tip was then approached slowly to a glass insulating substrate while re-cording the tip current, iT, reported as the red trace in Figure
2a. A highly reproducible increase in the amplitude of the oscillation was observed when the tip was 12-15 µm from the surface. More quantitative experiments were performed in the transient mode by periodically changing the tip-substrate distance and recording an average of ~10 oscillations.
This is exemplified using two transient curves (insets in Figure 2b) at tip-substrate distances of 90 and 5 µm for (i) and (ii), respectively. For each distance, the mean current oscilla-tion minimum and maximum tip current were calculated (Fig-ure 2b). It can be observed that while the tip-substrate distance does not significantly affect the oscillation frequency, it has a considerable effect on its amplitude. When the tip approaches the substrate, i) the amplitude increases by up to a factor of 2 before sharply decreasing by a factor of 20 when going into contact with the substrate (Figure 2a) and, ii) only the maxi-mum current value has increased in a partial positive feedback, whereas the baseline current is essentially decreasing in a behaviour analogous to the negative feedback.
To understand the origin of this unexpected partial positive feedback, one may recall that oscillations in such chemical systems are owing to what is generally held to be 2 or 3
proc-esses – >20 individual reactions28,45 – as recently reviewed.14,15 To eliminate the chemical nature of the substrate as a possible factor responsible for the partial positive feedback, similar transient analysis of the BZ oscillations was performed at different insulating substrates, including silanized glass – using (C12H25)Si(CH3)2Cl and (CH3CH2O)3Si((CH2)2C8F17) –
and PTFE (details in the SI). The same increase in the oscilla-tion amplitude was observed, as presented in Figure S2, for all these insulating substrates, with a maximum amplitude at ~12-15 µm tip-substrate distance, showing no significant effect of the substrate. Furthermore, nearly constant water contact an-gles were measured before and after each experiment at silan-ized glass (Table S1); therefore, it can be concluded that no appreciable chemical process occurred at the surface that may be responsible for the apparent partial positive feedback ob-served. It also indicates that the silanized layers have not been significantly etched by the strongly acidic and oxidative condi-tions provided by the BrO3
−
solution. If a complete under-standing of the distance-effect phenomenon is ruled by the chemistry of the system, it is quite unusual, since such a posi-tive feedback response has never been observed in chemical situations without involving interfacial charge transfer.
2.3 Oregonator-SECM Coupled Model
Figure 3. [a]Overlay of selected, simulated chronoamperograms at a SECM tip (a = 12.5 µm, Rg = 5); tip-substrate distances from 125 to 2 µm. The homogeneous phase incorporated a 6-reaction kinetic Oregonator model. [b] Plot of the normalized maximum () and minimum (○) current amplitudes of the simulated transi-ent curves in [a] versus negative feedback (─).
Classically, BZ reactions are kinetically described using the ‘Oregonator’, as developed by Field, Körös, and Noyes.45,46This model seeks to condense the large array of reactions into a system reliant on two dependent variables – if the concentrations are rigidly constrained – and 6 reactions which are described in the SI.The homogeneous redox cataly-sis reactions depicted earlier are introduced through (3).6,36
2 3
3 2 3 2
Fe(phen) + BrO + H Fe(phen) + HBrO (3)
Step (3) may be reversible, depending on the oxidizing strength of the BZ reaction catalyst. Typically, it is more re-versible and slower for Ce3+/4+ or Ru(bpy)3
2+/3+
systems than for a less oxidizing redox catalyst, such as ferroin, where this step is right-hand shifted and close to diffusion-limited with kf
= 109 M-1∙s-1 and kb = 33 M
-1
∙s-1
.46 Implementation of the Ore-gonator model was purely qualitative and no attempt has been made to quantitatively match the current amplitude or period with that observed experimentally. The intention was to
ob-4
serve the effect – if any – this model would project when coupled with SECM confinement.
Figure 3a illustrates several simulated chronoamperograms obtained from this simulation at different tip-substrate dis-tances for one oscillation. Multiple oscillations were simulated (not shown), and are in good agreement with the experimental observations (Figure 2), in that no change in the frequency is observed. As the tip-substrate distance decreases, the maxi-mum current decreases concomitantly, such that when a plot of the maximum () and minimum (○) current – normalized versus their requisite signal at 125 µm tip-distance – is over-laid against the pure negative feedback curve, they are slightly higher (Figure 3b),which describes diffusion hindrance by the tip-substrate geometry and confinement. The deviation from pure negative feedback is slightly larger for the maximum current than for the minimum one, in qualitative agreement with the experimental observations. The simulated approach curves are also shift towards the substrate, suggesting the intervention of homogeneous redox catalysis reactions (3). Despite similitudes, this model insufficiently explains the whole process occurring experimentally and particularly the amplitude increase when the BZ reaction is confined within 12-15 µm from a substrate. Albeit this is a simplified strategy not as sophisticated as reaction-convection-diffusion models presented recently,47 it seems however, emblematic of the qualitatively observed reaction. That is, the entire reaction solution changes colour periodically with no spiral wave for-mation. This means that the oscillation period is smaller than the characteristic diffusion time of water-soluble intermedi-ates, i.e. the confined system can be considered homogenous.
2.4 SECM Approach Curves in BZ Solution in the Absence of Malonic Acid.
If the nature of the substrate is negligible, the simulation of the system based on the Oregonator model is also unsatisfac-tory, thus revealing the intervention of transport (travelling waves) or chemical phenomena. This section investigates the chemical contribution to the observed phenomenon. To do so, the system was chemically simplified by studying it in the absence of malonic acid and, therefore, in the absence of oscil-lations. In this way, the blue trace plotted in Figure 4a, without current normalization, was recorded with all other BZ reagents maintained.
Figure 4.[a] SECM approach curves without current normaliza-tion at a glass substrate for a typical BZ solunormaliza-tion (─), along with the system without malonic acid, but with 180 (─) and 5 mM (─) of NaBrO3. Inset, comparison of the current normalized 10 mM
NaBrO3 SECM approach curves from [a] (─) and the normalized
average minimum oscillation current recorded in transient mode (○). [b] Overlay of probe approach curves in an aqueous solution containing 2 mM ferroin, 1 M H2SO4, and NaBrO3 varied
itera-tively from 1 to 504 mM.
2.4.1. Analysis by an Apparent EC′ Mechanism.
When compared to the case of Fe(phen)3 3+
alone (no bro-mate, no malonic acid), which is close to the red trace in Fig-ure 4a, a higher current is observed at infinite tip-substrate distance. This indicates the intervention of redox catalysis through reaction (3), suggesting that even in the absence of malonic acid, BrO3
–
is decomposed in solution into the differ-ent brominated oxidants and radicals involved in the BZ scheme. Then, a simplified approach consists of analyzing the electrochemical response in the absence of malonic acid by an apparent EC′ mechanism as presented in section 2.1 where equations (1) and (2) are used with Ox, Red, and A for respec-tively Fe(phen)3 3+ , Fe(phen)3 2+ and BrO3
-such that khomois the
apparent catalytic rate of the entire process.
Within Figure S3 (□) are graphed the values of the experi-mental tip current at infinite distance, iinf, while increasing the
amount of [NaBrO3] added to a Fe(phen)3 2+
solution. Bromate, along with its sister oxidative species in solution (Br2, HOBr,
and HBrO2), are known to directly oxidize ferroin to ferriin. 28
In this way, when the reaction mixture is prepared, all the ferroin is oxidized to ferriin; this was observed as an almost instantaneous change in colour of the solution, from red to blue, upon addition of NaBrO3 to the acidic ferroin solution.
Moreover, reducing Fe(phen)3 3+
at the tip initiates theEC′ scheme. Then an increase in iinf was observed with increased
[NaBrO3], in agreement with the intervention of the C′
com-ponent of an EC’ scheme. The catalytic effect plateaus, how-ever, at 180 mM (Figure S3), suggesting several inhibiting processes. Indeed, the amount of Br−, a known inhibitor of the BZ reaction,14 may limit further catalysis through a negative feedback mechanism similar to that present in an oscillating BZ solution with a full complement of reagents. Regardless however, these data provide evidence that the concentration gradient of bromate is playing a role.
From a mechanistic point of view, the evolution of iinf for
different khomo values was obtained within the simulation,
whilst varying [NaBrO3], and compared to the experimental
values. In Figure S3, two values of khomo have been
exempli-fied through the overlay of their plots, a and b, for an apparent catalytic rate khomo equal to 100 and 50 M
−1∙s−1
, respectively. Then, 50 M−1∙s−1 provides the value for the overall apparent homogeneous catalytic rate with closest fit to the experimental curve. This value agrees with that of the rate determining step reported by Field and Försterling46 of 42 M−1∙s−1.
As proposed in 2.1, the analysis of the SECM approach curve should also be insightful. To explore the influence and complexity of the brominated species catalytic role further, a series of SECM approach curves were performed towards the glass substrate, in the absence of malonic acid, whilst chang-ing [NaBrO3] (Figure 4b). For[NaBrO3] <5 mM), the approach
curves exhibit negative – or only a small trace of feedback. For ([NaBrO3]> 5 mM), a peak emerges (ipeak) that increases
with increasing concentration until [BrO3 −
] ≈ 100 mM. Com-mensurate with the peak emergence, a shifting in the whole feedback effect closer to the substrate position (low L values) with progressive increases in [NaBrO3] was also observed.
5
The latter observation is in qualitative agreement with the simulated approach curves presented in Figure 1 and would also reveal the intervention of EC′ reactions. However, this simplified EC′ model does not replicate the apparent positive feedback observed experimentally. The incorporation of a heterogeneous substrate reaction was also attempted (data not shown); however, since the optimized homogeneous reaction rate was high (based on iinf), any heterogeneous rate employed
either produced a negative or positive feedback response, in
good agreement with SECM theory for coupled
homo/heterogeneous reactions.35,36,38,42,48
2.4.2. Reactivity from the Envelope of the Oscil-lations.
Before scrutinizing deeper the origin of this intricate partial feedback, the approach curves performed in the 180 mM NaBrO3 solution in the absence and presence of malonic acid
were compared (Figure 4a).In both cases, the same apparent partial positive feedback is present at roughly the same tip-substrate distance. Moreover, the current profiles of these two curves are in good agreement in shape and absolute tip current values. The curve recorded in the absence of malonic acid corresponds to the upper envelope of the oscillating curve. Even though there are no oscillations detected at the micro-electrode in the absence of malonic acid, the electrochemical response recorded at the tip shows the complexity of the cata-lytic schemes at play between ferroin and bromate or its re-lated, brominated species.
Figure 4aalso provides a comparison of the approach curves for the 5 mM NaBrO3 case without malonic acid against the
conventional BZ solution, again without current normaliza-tion. This curve corresponds to the lower envelope of the oscillating curve. Similarly, in the inset of Figure 4a, the mean minimum oscillation current recorded at different tip-substrate distances in the transient mode (Figure 2b) can be superim-posed in good agreement with the approach curve recorded in the 10 mM NaBrO3 solution without malonic acid.
These observations suggest that under the oscillation re-gime, when the current is minimal, the local equivalent bro-mate concentration is between 5 and 10 mM whilst at its maximum oscillation current, it is likewise maximal ~180 mM. These experiments confirm the intuitive hypothesis that the oscillation of ferroin in the BZ system is mostly con-trolled through its catalytic oxidation by the intermediate brominated oxidants in a low and high concentration regime. It also shows that the peculiar apparent positive feedback effect can be understood in terms of the ferroin/bromate catalytic oxidation chemistry. This also rules out, at least in a first ap-proximation, the influence of spatiotemporal phenomena. The approach curves recorded in the absence of malonic acid (or the envelope of the current oscillation with the distance) can then identify these concentration regimes. In turn, these ap-proach curves allow an indirect estimate of the apparent local concentration of the reactive species generated during the BZ reaction in terms of the equivalent bromate concentration in solution.
Such a strategy is particularly helpful for indirectly assess-ing the amount of reactive species in BZ reactions at interfaces (near vessel walls or at soft interfaces: emulsion32,33,49 or vesi-cles31,34,50). To illustrate this potentiality further, SECM ap-proach curves were acquired with the BZ solution without
malonic acid at a liquid|liquid interface between water (w) and a pure 1,2-dichloroethane (DCE) phase. The w|DCE approach curve overlaps the pure negative feedback curve (Figure S4), suggesting that in the vicinity of the DCE interface, the bro-mate solution is devoid of reactive intermediates. A likely mechanism is that the hydrophobic and reactive species (e.g.BrO2
•
, Br2) partition and irreversibly react in the organic
phase, thus inhibiting their contribution to the catalytic reac-tions. Therefore, even if a soft interface would behave as an insulating interface in terms of ion and electron transfer, it is likely not inert chemically toward reactive neutral brominated intermediates of the BZ reaction. This should impact the ex-tent of transmission of the BZ reaction in biphasic systems.14,26,29
2.5 Towards a Full Mechanistic Description
The partial positive feedback in the SECM approach curve performed in a BZ solution has a redox catalytic chemical origin, even though it is not sufficient to fully explain it. A more detailed chemical model was constructed using the 11 reactions described by Field and Försterling;46,51 a complete list of the parameters as well as the reactions can be found in Tables S2 and S3 (SI), respectively. Even if the complete reaction scheme was modelled, it is shown that the major contributions to kinetic control is provided by reactions
4,5′,5′′ and 10from Field and Försterling,46concerning the consumption of the intermediate HBrO2 for generation of
BrO2 •
:
whose subsequent reactions are the fastest. It has been rec-ognized that – for the case of Fe(phen)3
2+
/Fe(phen)3 3+
– 5′ is rate determining46,51 and BrO2
•
is the key chemical species regulating the homogeneous catalytic oxidation of ferroin (3).
The latter reaction (3) shows the intervention of an autocata-lytic reaction as it regenerates HBrO2 that is involved in 5′ in
addition to the redox catalyst, ferriin. These 4 reactions are then anticipated to explain qualitatively the higher regenera-tion of ferriin and therefore the apparent positive feedback observed in the approach curves. Indeed based on (3), the catalytic regeneration of Fe(phen)3
3+ by brominated species is kf[Fe(phen)3 2+ ][BrO2 •
],which can be roughly approximated from steady-state assumption to k+5′
2
[BrO3
-]2/k+4. It was then
logical to focus only on reaction 5′ and maintain the rates of the other reactions as they have been described previously, thereby, greatly simplifying the simulations.
Similar to the one-step reaction mechanism, iinf was
re-corded for the complex simulation at varied concentrations of NaBrO3 and two curves, for k+,5′ equal to 100 and 50 M
−1
∙s−1, have been plotted in Figure S3 as curves c and d, respectively. These curves demonstrate a fair agreement with the experi-mental evolution. This indicates that – similar to the simplified one-step catalytic simulation – the 11-reaction, more complex system is governed by a reaction with a rate determining step, likely 5′, with a value of ~ 50-100 M−1∙s−1, in very good agreement with the value proposed by Field and Försterling.46
6
Figure 5: SECM probe approach curves using the 11homogene-ous reaction set [a] where the rate, k+, of 5′ was varied as
indicat-ed with 180 mM NaBrO3; overlaid (▬) is the experimental
ap-proach curve at 180 mM NaBrO3. [b] the same simulation as [a],
however, with [BrO3 −
] = 5 mM overlaid with its requisite experi-mental curve.
Figure 5a illustrates the probe approach curves obtained us-ing this simulation while varyus-ing the forward rate constant,
k+,5′. Simulated SECM approach curves were then generated
using this more complete system and are plotted in Figure 5a and b for a solution with 180 and 5 mM of NaBrO3,
respec-tively; experimental curves (─) have been overlaid for com-parison. The first remarkable result is that the complete mechanism reproduces the appearance of a peak in the ap-proach curve, both in shape and position, resulting from the enhancement of the catalytic route under given confinement. It confirms that this peak may not be due to spatiotemporal phe-nomena, but is ruled by chemical processes of characteristic length provided by the SECM confinement. Moreover, the faster the main reaction, k+,5′, the higher the catalytic
en-hancement and the higher the peak. In the case of Figure S3a, the approach curve when k+,5′ was set equal to 25 M
−1∙s−1
is in good agreement with the experimental trace in its normalized form, while larger k+,5′ values demonstrated poorer overlap
owing to generating a higher peak in the approach curve. Finally, the rate constant value obtained in this configuration (k+,5′ = 25 M
−1∙s−1
) is reasonable compared to the one obtained for a one-step homogeneous reaction (50 <k< 100 M−1∙s−1) considering the complexity of the system and the fact that only one reaction relative to the production of BrO2
•
is changed in the model. Finally, the peculiarity observed here is due to the detection by the SECM tip of the reaction of the BrO2
•
reactive species whose concentration, in the vicinity of the electrode surface positioned at 125 and 2 µm tip-substrate distances, was determined to be 9.1 and 3.6 µmol·L–1, respectively, whilst ~90 µmol·L–1 in the bulk.
3. CONCLUSIONS
A simple strategy for testing an EC′ mechanism using SECM approach curves versus an insulating substrate has been proposed and validated by employing the BZ reaction as a model system. An EC′ theoretical model, along with a more complex 11-reaction simulation have been used to explain an unexpected increase in the current amplitude of the BZ oscilla-tion at small tip-substrate distances (L ≈ 1) across various insulating substrates. The Oregonator model, traditionally used to describe the BZ system, was insufficient to simulate
quanti-tatively the amplitude and the period of the oscillation as well as the feedback observed experimentally. However, the EC′ and 11-reaction homogeneous redox catalysis schemes were able to describe the mechanism in terms of the local BrO3
–
concentration through comparison to experimental approach curves recorded in the absence of malonic acid. This suggests that the apparent partial positive feedback can be explained by a simple application of the catalytic reactions themselves without a need to consider more complex bifurcation models;
i.e. that it is owing to chemical wave propagation (direct
changes in the concentration gradient of key bromate species). These findings have implications towards inter-vesicular chemical coupling and indicate an optimal distance for vesicle spacing or size for enhanced reaction kinetics. Additionally, they suggest the potentiality of SECM to characterize homo-geneous redox catalysis reactions, and indirectly depict the stability of short-lived intermediate reactive species (herein the BrO2
•
radical is indirectly monitored). While the BZ reac-tion is exemplified here, this approach can easily be extended to other fields: e.g. ECL,11-13 cross-coupling reactions(as those involved in click-chemistry),8,9 organometallic redox proc-esses,10 and proton coupled electron transfer reactions in-volved in many energy-related fields.5,6,52,53
ASSOCIATED CONTENT
Supplementary Information: Experimental details; Figure
S1: Simulated values of I = imin/iinf (a) and iinf (b) versus k
homo-for EC’; Figure S2: Oscillation amplitude versus tip-substrate distance for different substrates; Oregonator Equations; Figure S3: Plots of iinf vs. [NaBrO3], experiments and simulation;
Figure S4: Approach curve towards a w|DCE interface; Figure S5: CV in a BZ solution; Table S1: Water contact angle meas-urements; Table S2: COMSOL parameters for the Field and Försterling model; Table S3: 11 reactions with associated rate constants and rate equations employed in the COMSOL model.
AUTHOR INFORMATION Corresponding Author
†
E-mail address: frederic.kanoufi@univ-paris-diderot.fr;
Notes
The authors declare no competing financial interest
ACKNOWLEDGEMENTS
The authors would like to acknowledge support from CNRS and Labex MICHEM.
RERFERENCES
(1) Andrieux, C.P.; Dumas-Bouchiat, J.M.; Saveant, J.M. J. Electroanal. Chem. Interfacial Electrochem.1978, 87, 39-53.
(2) Savéant, J.M. Chem. Rev.2008, 108, 2348-2378.
(3) Cannan, S.; Cervera, J.; Steliaros, R.J.; Bitziou, E.; Whitworth, A.L.; Unwin, P.R. Phys. Chem. Chem. Phys.2011, 13, 5403-5412.
(4) Calhoun, R.L.; Bard, A.J. J. Electrochem. Soc.2012, 159, F42-F47.
(5) Lin, Q.; Li, Q.; Batchelor-McAuley, C.; Compton, R.G. J. Phys. Chem. C2014, 119, 1489-1495.
(6) Costentin, C.; Drouet, S.; Robert, M.; Savéant, J.M. Science2012, 338, 90-94.
(7) Léger, C.; Bertrand, P. Chem. Rev.2008, 108, 2379-2438. (8) Liang, C.K.; Dubacheva, G.V.; Buffeteau, T.; Cavagnat, D.; Hapiot, P.; Fabre, B.; Tucker, J.H.R.; Bassani, D.M. Chem. Eur. J.2013, 19, 12748-12758.
7
(9) Zhao, L.; Zhao, F.; Zeng, B. Biosens. Bioelectron.2014, 62,19-24.
(10) Magenau, A.J.D.; Strandwitz, N.C.; Gennaro, A.;
Matyjaszewski, K. Science2011, 332, 81-84.
(11) Bard, A.J.; Ding, Z.; Myung, N. Struct. Bonding 2005, 118, 1-57.
(12) Dick, J. E.; Renault, C.; Kim, B.-K.; Bard, A.J. J. Am. Chem. Soc.2014, 136, 13546-13549.
(13) Swanick, K.N.; Hesari, M.; Workentin, M.S.; Ding, Z. J. Am. Chem. Soc.2012, 134, 15205-15208.
(14) Epstein, I.R. Chem. Commun.2014, 50, 10758-10767. (15) Corbel, J.M. L.; van Lingen, J.N. J.; Zevenbergen, J.F.; Gijzeman, O.L.J.; Meijerink, A. Angew. Chem. Int. Ed.2013, 52, 290-303.
(16) Ueki, T.; Yoshida, R. Phys. Chem. Chem. Phys.2014, 16, 10388-10397.
(17) Yuan, C.; Guo, J.; Tan, M.; Guo, M.; Qiu, L.; Yan, F. ACS Macro Letters2014, 3, 271-275.
(18) Arimura, T.; Mukai, M. Chem. Commun.2014, 50, 5861-5863. (19) Hara, Y.; Mayama, H.; Fujimoto, K. J. Phys. Chem. B2014, 118, 6931-6936.
(20) Lu, X.; Ren, L.; Gao, Q.; Zhao, Y.; Wang, S.; Yang, J.; Epstein, I. R. Chem. Commun.2013, 49, 7690-7692.
(21) Zhang, Y.; Zhou, N.; Akella, S.; Kuang, Y.; Kim, D.; Schwartz, A.; Bezpalko, M.; Foxman, B. M.; Fraden, S.; Epstein, I. R.; Xu, B. Angew. Chem. Int. Ed.2013, 52, 11494-11498.
(22) Field, R.J.; Koros, E.; Noyes, R.M. J. Am. Chem. Soc.1972, 94, 8649-8664.
(23) Bell, J.G.; Green, J.R.; Wang, J. J. Phys. Chem. A2014, 118, 9795-9800.
(24) Amemiya, T.; Nakaiwa, M.; Ohmori, T.; Yamaguchi, T. Phys. D1995, 84, 103-111.
(25) Zhang, Y.; Zhou, R.; Shi, J.; Zhou, N.; Epstein, I.R.; Xu, B. J. Phys. Chem. B2013, 117, 6566-6573.
(26) Tomasi, R.; Noel, J.-M.; Zenati, A.; Ristori, S.; Rossi, F.; Cabuil, V.; Kanoufi, F.; Abou-Hassan, A. Chem. Sci.2014, 5, 1854-1859.
(27) Rossi, F.; Budroni, M.A.; Marchettini, N.; Cutietta, L.; Rustici, M.; Liveri, M.L.T. Chem. Phys. Lett.2009, 480, 322-326.
(28) Keki, S.; Magyar, I.; Beck, M.T.; Gaspar, V. J. Phys. Chem.1992, 96, 1725-1729.
(29) Tompkins, N.; Li, N.; Girabawe, C.; Heymann, M.; Ermentrout, G.B.; Epstein, I.R.; Fraden, S. Proc. Natl. Acad. Sci. U. S. A.2014, 111, 4397-4402.
(30) Turing, A. M. Trans. Roy. Soc. 1952, B237, 37-72.
(31) Tan, Y.-C.; Hettiarachchi, K.; Siu, M.; Pan, Y.-R.; Lee, A.P. J. Am. Chem. Soc.2006, 128, 5656-5658.
(32) Delgado, J.; Li, N.; Leda, M.; Gonzalez-Ochoa, H.O.; Fraden, S.; Epstein, I.R. Soft Matter2011, 7, 3155-3167.
(33) Joensson, H.N.; Andersson Svahn, H. Angew. Chem. Int. Ed.2012, 51, 12176-12192.
(34) Seth, A.; Béalle, G.; Santanach-Carreras, E.; Abou-Hassan, A.; Ménager, C. Adv. Mater.2012, 24, 3544-3548.
(35) Demaille, C.; Unwin, P.R.; Bard, A.J. J. Phys. Chem.1996, 100, 14137-14143.
(36) Kanoufi, F.; Cannes, C.; Zu, Y.; Bard, A.J. J. Phys. Chem. B
2001, 105, 8951-8962.
(37) Bi, S.; Liu, B.; Fan, F.-R.F.; Bard, A.J. J. Am. Chem. Soc.2005, 127, 3690-3691.
(38) Amemiya, S.; Bard, A.J.; Fan, F.R.F.; Mirkin, M.V.; Unwin, P.R. Annu. Rev. Anal. Chem.2008, 1, 95-131.
(39) Ktari, N.; Combellas, C.; Kanoufi, F. J. Phys. Chem. C2011, 115, 17891-17897.
(40) Noël, J.-M.; Latus, A.; Lagrost, C.; Volanschi, E.; Hapiot, P. J. Am. Chem. Soc.2012, 134, 2835-2841.
(41) Zhang, M.M.N.; Long, Y.-T.; Ding, Z. J. Inorg. Biochem.2012, 108, 115-122.
(42) Ekanayake, C.B.; Wijesinghe, M.B.; Zoski, C.G. Anal. Chem.2013, 85, 4022-4029.
(43) Cao, F.; Kim, J.; Bard, A.J. J. Am. Chem. Soc.2014, 136, 18163-18169.
(44) Stockmann, T.J.; Zhang, J.; Montgomery, A.-M.; Ding, Z. Anal. Chim. Acta2014, 821, 41-47.
(45) Field, R.J.; Noyes, R.M. J. Chem. Phys.1974, 60, 1877-1884. (46) Field, R.J.; Försterling, H.D. J. Phys. Chem.1986, 90, 5400-5407.
(47) Rossi, F.; Budroni, M.A.; Marchettini, N.; Carballido-Landeira, J. Chaos2012, 22, 037109-037101-037109-037111.
(48) Nunige, S.; Cornut, R.; Hazimeh, H.; Hauquier, F.; Lefrou, C.; Combellas, C.; Kanoufi, F. Angew. Chem. Int. Ed.2012, 51, 5208-5212.
(49) Thutupalli, S.; Herminghaus, S.; Seemann, R. Soft Matter2011, 7, 1312-1320.
(50) Luo, T.; Srivastava, V.; Ren, Y.; Robinson, D.N. Appl. Phys. Lett.2014, 104, -.
(51) Yan, S. Naturwissenschaften, Philipps-Universität Marburg, 2001.
(52) Bian, X.; Scanlon, M. D.; Wang, S.; Liao, L.; Tang, Y.; Liu, B.; Girault, H.H. Chem. Sci.2013, 4, 3432-3441.
![Figure 1: Simulated SECM approach curves using the EC′ mech- mech-anism (eqs. 1 and 2) with k homo from 10 −4 to 3000 M −1 ∙s −1 [a] and 3000 to 10 7 M −1 ∙s −1 [b]; 25 µm diameter tip with Rg=5](https://thumb-eu.123doks.com/thumbv2/123doknet/15017251.681741/3.918.496.781.198.386/figure-simulated-secm-approach-curves-using-anism-diameter.webp)
![Figure 2: [a] Probe approach curve using a 25 µm diameter Pt disk tip (R g = 5) towards a glass substrate with a BZ aqueous solution composed of 180 mM NaBrO 3 , 120 mM malonic acid, 1 M H 2 SO 4 , and 2 mM ferroin](https://thumb-eu.123doks.com/thumbv2/123doknet/15017251.681741/4.918.162.358.100.352/figure-approach-diameter-towards-substrate-aqueous-solution-composed.webp)
![Figure 5: SECM probe approach curves using the 11 homogene- homogene-ous reaction set [a] where the rate, k + , of 5′ was varied as indicat-ed with 180 mM NaBrO 3 ; overlaid (▬) is the experimental ap-proach curve at 180 mM NaBrO 3](https://thumb-eu.123doks.com/thumbv2/123doknet/15017251.681741/7.918.97.386.60.267/figure-approach-homogene-homogene-reaction-indicat-overlaid-experimental.webp)
