HAL Id: hal-03139473
https://hal.archives-ouvertes.fr/hal-03139473
Submitted on 12 Feb 2021
HAL is a multi-disciplinary open access
archive for the deposit and dissemination of
sci-entific research documents, whether they are
pub-lished or not. The documents may come from
teaching and research institutions in France or
abroad, or from public or private research centers.
L’archive ouverte pluridisciplinaire HAL, est
destinée au dépôt et à la diffusion de documents
scientifiques de niveau recherche, publiés ou non,
émanant des établissements d’enseignement et de
recherche français ou étrangers, des laboratoires
publics ou privés.
in ALS Measured with fMRI Using an Inhibitory Task
Kelsey Witiuk, Juan Fernandez-Ruiz, Ryan Mckee, Nadia Alahyane, Brian
Coe, Michel Melanson, Douglas Munoz
To cite this version:
Kelsey Witiuk, Juan Fernandez-Ruiz, Ryan Mckee, Nadia Alahyane, Brian Coe, et al.. Cognitive
Dete-rioration and Functional Compensation in ALS Measured with fMRI Using an Inhibitory Task. Journal
of Neuroscience, Society for Neuroscience, 2014, 34 (43), pp.14260-14271.
�10.1523/JNEUROSCI.1111-14.2014�. �hal-03139473�
Neurobiology of Disease
Cognitive Deterioration and Functional Compensation in
ALS Measured with fMRI Using an Inhibitory Task
Kelsey Witiuk,
1*
X
Juan Fernandez-Ruiz,
2* Ryan McKee,
3Nadia Alahyane,
1Brian C. Coe,
1Michel Melanson,
3and Douglas P. Munoz
1,3,4,51Centre for Neuroscience Studies, Queen’s University, Kingston, Ontario K7L 3N6, Canada,2Departamento de Fisiología, Facultad de Medicina,
Universidad Nacional Auto´noma de Me´xico, Distrito Federal 04510, Me´xico,3Department of Medicine, Division of Neurology, Queen’s University,
Kingston, Ontario K7L 3N6, Canada,4Department of Biomedical and Molecular Sciences, Queen’s University, Kingston, Ontario K7L 3N6, Canada, and 5Department of Psychology, Queen’s University, Kingston, Ontario K7L 3N6, Canada
Amyotrophic lateral sclerosis (ALS) is characterized by degeneration of upper and lower motor neurons, resulting in progressive
weak-ness and muscle atrophy. Recent studies suggest that nondemented ALS patients can show selective cognitive impairments,
predomi-nantly executive dysfunction, but little is known about the neural basis of these impairments. Oculomotor studies in ALS have described
deficits in antisaccade execution, which requires the implementation of a task set that includes inhibition of automatic responses
followed by generation of a voluntary action. It has been suggested that the dorsolateral prefrontal cortex (DLPFC) contributes in this
process. Thus, we investigated whether deterioration of executive functions in ALS patients, such as the ability to implement flexible
behavior during the antisaccade task, is related to DLPFC dysfunction. While undergoing an fMRI scan, 12 ALS patients and 12
age-matched controls performed an antisaccade task with concurrent eye tracking. We hypothesized that DLPFC deficits would appear during
the antisaccade preparation stage, when the task set is being established. ALS patients made more antisaccade direction errors and
showed significant reductions in DLPFC activation. In contrast, regions, such as supplementary eye fields and frontal eye fields, showed
increased activation that was anticorrelated with the number of errors. The ALS group also showed reduced saccadic latencies that
correlated with increased activation across the oculomotor saccade system. These findings suggest that ALS results in deficits in the
inhibition of automatic responses that are related to impaired DLPFC activation. However, they also suggest that ALS patients undergo
functional changes that partially compensate the neurological impairment.
Key words: amyotrophic lateral sclerosis; antisaccade; cognitive control; fMRI; prefrontal cortex; task set
Introduction
Amyotrophic lateral sclerosis (ALS) is a neurodegenerative
dis-ease affecting motor neurons in the cerebral cortex, brainstem,
and spinal cord. The neuropathology of ALS is marked primarily
by degeneration of upper motor neurons in the brainstem and
motor cortex, and of lower motor neurons in the brainstem and
spinal cord. The resulting muscle denervation leads to physical
symptoms of muscle weakness, atrophy, and tone reduction, which
progresses to the loss of voluntary movement (
Kiernan et al., 2011
).
Beyond motor impairments, patients with ALS often display
behavioral and cognitive deficits, including dysfunctions within
the executive system (
Gallassi et al., 1985
;
Strong et al., 1996
;
Abrahams et al., 2000
;
Phukan et al., 2007
;
Raaphorst et al., 2012
).
These deficits are commonly associated with pathologies in
pre-frontal circuits and can also be seen in patients with
frontotem-poral dementia (
Abrahams et al., 1996
;
Murphy et al., 2007
).
Most brain imaging activation studies that investigated the neural
basis of cognitive deficits in ALS have used tests that depend on
verbal, written, or hand movement responses, which can be
con-founded by the ALS motor impairment. Nevertheless, these
stud-ies have found a general correlation between performance on
different neuropsychological tests and reduced frontal lobe
activ-ity, including the dorsolateral prefrontal cortex (DLPFC) (
Tser-mentseli et al., 2012
).
However, it is unknown how reduction in activity within a
specific area would result in a specific executive dysfunction in
ALS. A task that has been valuable to probe the processes involved
in executive dysfunctions is the antisaccade task, which relies on
the implementation of flexible behaviors (
Hallett, 1978
;
Hallett
and Adams, 1980
). This flexibility has been attributed to
varia-tions in readiness to make a response or in the intention to
per-form a particular task and has been referred to as “preparatory
set” (
Everling and Munoz, 2000
). Correct antisaccade execution
requires a preparatory set that includes inhibition of automatic
Received March 10, 2014; revised Aug. 27, 2014; accepted Sept. 5, 2014.Author contributions: R.M., B.C.C., N.A., M.M., and D.P.M. designed research; K.W., J.F.-R., R.M., B.C.C., and M.M. performed research; K.W. and J.F.-R. analyzed data; K.W., J.F.-R., and D.P.M. wrote the paper.
This work was supported by ALS Society of Canada Bernice Ramsay Discovery Grant to D.P.M. and M.M. and Canadian Institutes of Health Research Operating Grant MOP-97741 to D.P.M. who was also supported by the Canada Research Chair Program. We thank members of the D.P.M. laboratory for comments on an earlier version of the manuscript.
The authors declare no competing financial interests. *K.W. and J.F.-R. contributed equally to this work.
Correspondence should be addressed to Dr. Douglas P. Munoz, Centre for Neuroscience Studies, Queen’s Univer-sity, Kingston, Ontario K7L 3N6, Canada. E-mail: [email protected].
DOI:10.1523/JNEUROSCI.1111-14.2014
responses followed by the generation of a voluntary action
to-ward the opposite site of the target (
Guitton et al., 1985
;
Shaunak
et al., 1995
;
Luna et al., 1998
;
Evdokimidis et al., 2002
;
Munoz and
Everling, 2004
). Functional imaging has helped identify the
ocu-lomotor network involved in the preparation and execution of
antisaccades, including frontal cortex areas, such as the frontal
eye fields (FEFs) and supplementary eye fields (SEFs), and the
DLPFC (
Luna et al., 1998
;
Munoz and Everling, 2004
;
Anderson
et al., 2012
;
Jamadar et al., 2013
).
The aim of this study was to test the hypothesis that deficits in
the control of flexible behavior in ALS are related to deficient
DLPFC activation, specifically during the antisaccade
prepara-tion stage. This hypothesis is supported by previous findings
sug-gesting that the frontal lobe participates in the inhibition of
unwanted automatic saccades (
Guitton et al., 1985
;
Pierrot-Deseilligny et al., 2003
). To examine this hypothesis, we
mea-sured the implementation of flexible behaviors using the
antisaccade task in a group of ALS patients and age-matched
controls during a rapid event-related fMRI acquisition.
Materials and Methods
All experiments were approved by the Research and Ethics Board of Queen’s University and adhered to the principles of the Canadian Tri-Council Policy Statement on Ethical Conduct for Research Involving Humans, in accordance with the principles of the Declaration of Helsinki (World Medical Association, 2013). ALS patients and age-matched con-trol subjects participated in a rapid event-related fMRI design with pro-saccade and antipro-saccade trials interleaved with preparatory protrials and antitrials that did not include saccade executions (“catch” trials) (Fig. 1). This design allowed us to separately examine activation related to the preparation stage for an antisaccade, referred to as the task set, from activation related to executing the antisaccade response.
Participants. Twenty-one patients with definite ALS diagnoses and
with no other neurological problem, including the presence of vascular lesions, agreed to participate in this study and were compensated for their time. They were recruited from the neuromuscular clinics at Saint Mary’s of the Lake and Kingston General Hospitals by M.M. and were required to participate in two sessions held within 10 d apart. Nine of these pa-tients were unable to complete the MRI studies primarily because of breathing difficulties while lying supine in the scanner. Twelve ALS pa-tients (ages 44 –76 years, 2 females, mean⫾ SD age 61.6 ⫾ 9.6 years) completed all experimental procedures and were included in the final analysis (Table 1). It should be noted that one patient had an especially
long disease duration (Patient 5 inTable 1). However, an extensive clinical analysis did not reveal any other neurological condition that could explain his symptoms. His initial presen-tation was an upper motor neuron type involv-ing lower limbs. A control group of 12 healthy volunteers (ages 41–76 years, 3 females, mean⫾ SD age 61.6 ⫾ 10.7 years) were age-and gender-matched to the ALS patients age-and were included in the final analysis. Controls did not possess any neurological/psychiatric disorders as assessed by the experimenter and by scores on the Mini-Mental Status Examina-tion (Folstein et al., 1983) or the Montreal Cog-nitive Assessment (MoCA) (Nasreddine et al., 2005).
Clinical evaluation of ALS patients was per-formed during the first session. This evaluation was modeled after a rapid screening battery used in ALS patients to measure physical func-tion and frontal lobe impairments ( Flaherty-Craig et al., 2006). The measures of physical function included pulmonary function tests of forced vital capacity, the self-administered ALS Functional Rating Scale Revised version ( Ce-darbaum et al., 1999), manual strength tests of maximum voluntary isometric contraction of the dominant hand, and a patient history, in-cluding age and symptoms at disease onset, disease duration, and current medications being taken by the patient. Neuropsychological testing in-cluded the MoCA, the Frontal Behavioral Inventory (Kertesz et al., 1997), the Centre for Neurologic Study Lability Scale (Moore et al., 1997), a modification of the Hospital Anxiety and Depression Scale (Bjelland et al., 2002) to exclude one question which falsely exaggerated the measure of depression due to the physical disabilities experienced by ALS patients (Abrahams et al., 2000), the Neurobehavioral Cognitive Status Examina-tion (Mueller et al., 2001) to assess verbal reasoning and judgment, and the Controlled Oral Word Association test (Benton, 1969) to assess ver-bal fluency, where the letters C, A, and S were used to avoid repetition from verbal fluency tasks in the MoCA. Verbal fluency represents the average time taken to think of each word (Abrahams et al., 2000) and is designed to control for individual variations in motor speed. Previously described normative data were used as a benchmark for age-matched control performance (Tombaugh et al., 1999).
fMRI experimental design. Brain imaging was acquired during the
sec-ond session. A randomly interleaved, rapid event-related design was used (Cameron et al., 2012;Hakvoort Schwerdtfeger et al., 2012;Alahyane et al., 2014), allowing the presentation of different trial types within a rea-sonable time period. Included in the design were full prosaccade and antisaccade trials aimed at examining both the preparatory and execu-tion components of saccades (Fig. 1, top 2 rows), preparatory-only trials (i.e., catch trials) that exclusively measured preparatory activation (Fig. 1, bottom 2 rows), and fixation-only trials (data not shown). Participants were asked to fixate on a neutral fixation stimulus (a “gold coin”) that appeared for 1000 ms at the center of the screen to start each trial. The neutral fixation stimulus would change to an instructional cue indicating to the participant that a prosaccade or an antisaccade was required. The symbols used for the instructional cue were colored diagram images: a green turtle indicated that a prosaccade was required, and a red crab indicated that an antisaccade was required. Colored diagram symbols were chosen because the rapid event-related experiment was designed for use across various patient groups that included child-aged participants, and this made the task easier for children to learn.
After the 1300 ms presentation of the instructional cue, a 200 ms gap period occurred during which the participant was presented with a black screen. The gap period was introduced to enable participants to generate more “automatic” saccades and has been associated with shorter saccadic reaction times (SRTs), more antisaccade direction errors, and more ex-press prosaccades (Munoz and Corneil, 1995;Fischer and Weber, 1997;
Munoz et al., 1998). On saccade trials, a peripheral target (gold coin) was
Figure 1. Behavioral paradigm. Representation of stimuli and timing of events for the four trial types. Trials were pseudo-randomly presented and intermixed with periods of fixation on the neutral fixation stimulus that lasted 1.5, 3, and 4.5 s. Arrows indicate the correct saccade directions for the saccade trials and were not actually displayed. Fixation-only trials are not shown in this figure.
flashed for 100 ms to the left or right of the neutral fixation, at eccentric-ities of either 6° or 7° in separate trials, to signal a saccade. Participants had 1400 ms to execute the appropriate prosaccade (look toward the target location) or antisaccade (look away from the target in the opposite direction) based on the instructional cue presented in that trial. The neutral fixation stimulus (gold coin) then reappeared at the center of the screen for 500 ms, and participants were required to reestablish central fixation to initiate the next trial. Before commencing the task, partici-pants were instructed to make a correction saccade if they generated direction errors. On catch trials, the instructional cue was presented and disappeared to initiate the gap period, but the peripheral target did not appear to signal a saccade; subjects were instead required to maintain central fixation for the remainder of the trial (1700 ms) without gener-ating a saccade. Participants did not know whether or not the peripheral target would appear on any given trial; thus, the instruction cue would always elicit preparation for a prosaccade or antisaccade. Full saccade, catch, and fixation only trials were 4500 ms in duration. The duration of the intertrial interval was jittered, using fixation periods that spanned 1 repetition time (TR) (1.5 s; 8 times), 2 TR (3.0 s; 4 times), and 3 TR (4.5 s; 4 times) to increase the statistical efficiency and power in the rapid event-related design (Dale, 1999).
Runs consisted of 64 trials that included 8 procatch trials, 8 anticatch trials, 16 prosaccade trials, 16 antisaccade trials, and 16 fixation trials (Fig. 1; fixation trials not shown). Trial types were pseudo-randomly interleaved, and right and left prosaccade and antisaccade trials were presented in equal quantities within each run. Each participant per-formed 5–9 runs (depending on eye tracking success), with each run lasting 277.5 s. Each run started with an additional fixation period of 3 s, whereas fMR images were acquired, to allow the MR signal to reach a steady state. Each run ended with a 16.5 s fixation period to allow the hemodynamic response to return to baseline before commencing the next run. Each subject was given a practice run before entering the magnet.
Visual display and eye tracking. Visual stimuli were generated and
con-trolled using E-PRIME software (Psychology Software Tools) on a per-sonal computer. Images were back-projected onto a high-contrast rear projection screen (DA-LITE), positioned at the head end of the magnet bore, using a NEC LT265 DLP video projector with a refresh rate of 60 Hz and a resolution of 1024⫻ 768. Participants viewed the screen via a mirror attached to the head coil (described below). Eye position data were recorded using an ISCAN ETL-400 camera that sampled the eye position at a frequency of 120 Hz. To ensure synchronization, the MRI sequences directly triggered the E-PRIME software using a trigger signal from the scanner. An infrared fiber-optic illuminator, which was fixed to
the head coil, was used to illuminate the right eye for tracking. After the anatomical MRI scan was acquired, the eye tracker was calibrated using a nine-point array that covered most of the visual field. Analysis of the eye movement data was performed off-line using custom-made MATLAB programs (MathWorks).
Imaging protocol. All imaging data were acquired at the Queen’s
Uni-versity MRI Facility using a Siemens 3 Tesla Magnetom Trio system fitted with a 12-channel receive-only head coil. High-resolution T1-weighted whole-brain structural scans were performed on each participant using an MPRAGE sequence (TR⫽ 1760 ms, TE ⫽ 2.2 ms, flip angle ⫽ 9°, 256⫻ 256 mm field of view, and 256 ⫻ 256 matrix size providing 1 mm isotropic voxels, 176 slices). Functional data were collected using a T2*-weighted EPI acquisition (TR⫽ 1500 ms, TE ⫽ 30 ms, flip angle ⫽ 72°, 211⫻ 211 mm field-of-view, 64 ⫻ 64 matrix size, 3.3 mm isotropic voxel resolution, 185 volumes) for BOLD-based imaging (Ogawa et al., 1990). Twenty-four slices were acquired and positioned to include all regions of interest extending from the top of the brain to the ventral striatum (STR).
MRI preprocessing. All functional imaging runs were preprocessed
us-ing Brain Voyager 1.9. The first two volumes of each functional run were discarded before any preprocessing, to allow for steady-state magnetiza-tion. To correct for between-scan movements, all volumes within a run were realigned to the first volume of that functional run. Slice scan time correction was conducted to adjust for time differences due to multislice imaging acquisition using a cubic spline interpolation, which was based on the TR duration and order of slice scanning (ascending interleaved). 3D spatial smoothing was then performed using a 4 mm full-width at half-maximum Gaussian filter on all volumes, and each run was filtered to remove linear drift using a high-pass filter with the upper cutoff fre-quency corresponding to 3 cycles over the length of the run. Finally, all functional data were superimposed onto 3D anatomical images, resa-mpled into 3 mm cubic voxels, aligned to the anterior commissure– posterior commissure axis, and transformed into Talairach space (Talairach and Tournoux, 1988).
Behavioral analyses. Behavioral data were analyzed using
custom-written scripts in MATLAB 7.4 (MathWorks). SRT was defined as the time to make the first saccade away from fixation after peripheral stim-ulus onset. Saccades with a SRT⬍90 ms were considered anticipatory (Munoz et al., 1998) and thus were excluded from analysis. This value was selected because it was the point at which errors in prosaccade trials were no longer executed at chance (1:1 ratio correct: incorrect). There-fore, 90 ms was decided as the earliest time at which detection of the visual target could influence behavior. Express saccades, which are the shortest visually triggered saccades, have typically been calculated as sac-cades with SRTs between 90 and 135 ms (Fischer et al., 1993;Munoz et
Table 1. Clinical and neuropsychological information for ALS patients included in the imaging studya
Patient no.
Months since diagnosis
Clinical evaluation Neuropsychological evaluation El Escorial criteria Onset FVC % pred ALS FRS-R MVIC (kg) ULT (/70) LLT (/70) Hand MoCA (/30) Cognistat COWA (VF) FBI CNS-LS HADS R J D A 1 60 def UL 78 38 5.5 50 58 R 25 7 6 3.37 42 10 0 5 2 20 def LL 90 41 45 70 42 L 25 8 6 4.70 2 7 1 0 3 84 def LL 92 29 38 70 L 24 4 5 7.00 24 11 9 9 4 12 def UL 101 41 31 64 62 L 21 4 4 12.10 12 11 3 2 5 168 def LL 63 42 18 67 64 R 30 8 5 2.96 2 19 2 5 6 13 def UL 100 31 6 56 63 R 23 4 5 14.80 11 7 1 5 7 13 def UL 62 28 3 50 60 R 29 8 6 2.93 10 15 5 5 8 22 def LL 78 36 18 70 43 R 25 8 6 4.14 13 11 3 2 9 18 def LL 88 42 30 69 60 R 18 7 5 3.50 5 9 3 9 10 16 def UL 74 43 3 53 68 L 29 7 6 4.88 3 7 1 1 11 10 def LL 77 31 50 64 26 R 23 8 5 9.11 4 9 3 7 12 11 def Bulbar 94 33 3.3 56 65 R 26 8 5 3.83 4 13 4 1 Mean (n⫽ 12) 37.3 83.1 36.3 19.3 58.9 56.8 24.8 6.8 5.3 6.1 11.0 10.8 2.9 4.3 SEM 47.1 13.1 5.6 17.4 10.1 13.0 3.5 1.7 0.7 3.9 11.7 3.6 2.4 3.1
aALSFRS-R, ALS Functional Rating Scale Revised version; CNS-LS, Centre for Neurologic Studies Lability Scale; Cognistat R/J, Verbal Reasoning and Judgment questions from Neurobehavioral Cognitive Status Examination; COWA, Controlled
Oral Word Association test; def, definite diagnosis; FBI, Frontal Behavioral Inventory; FVC % pred, forced vital capacity percent predicted when sitting; HADS D/A, Depression and Anxiety measures of Hospital Anxiety and Depression Scale; Hand, dominant hand as identified by Modified Edinburgh Handedness Inventory; LLT, lower limb total of Manual Muscle test; MoCA, Montreal Cognitive Assessment; MVIC, maximum voluntary isometric contraction; ULT, upper limb total of Manual Muscle test.
al., 1998); however, the boundaries of this epoch change according to the participant age and stimulus conditions (Bell et al., 2006;Peltsch et al., 2011;Marino et al., 2012). In the current study, the express saccade epoch was measured between 90 and 160 ms, where 160 ms was the latency at which both groups made more correct responses than errors during antisaccade trials (data not shown). Prosaccade direction errors were defined as saccades executed away from the target during prosaccade trials; antisaccade direction errors were defined as saccades executed toward the target during antisaccade trials. Direction error rate was cal-culated by dividing the total number of errors by the total number of valid trials. Intrasubject variability for SRT was calculated using the co-efficient of variation for correct trials (SD/mean⫻ 100).
Valid trials consisted of all trials except for those that included the following: (1) failure to fixate during fixation trials; (2) failure to fixate during the instruction period of a full prosaccade or antisaccade trial; (3) failure to execute a saccade during the response period; (4) execution of multiple saccades during the response period; (5) saccades executed dur-ing catch trials; (6) antisaccades executed durdur-ing prosaccade trials; (7) failure to correct an antisaccade direction error; and (8) trials in which eye-tracking was unsuccessful. These aforementioned excluded trials were modeled separately as “invalid trials” in the fMRI analysis described below.
Mixed-design ANOVAs were conducted to examine differences in be-havior between the control and ALS groups in terms of SRT, CVSRT, percentage of express saccades, and percentage of direction errors dur-ing antsaccade- and prosaccade trials. Nonparametric two-sample Kolmogorov–Smirnov tests were conducted to compare the SRT cu-mulative distributions between the two groups. Group differences on saccade measures were not observed between leftward versus rightward saccades or between 6° versus 7° eccentricities ( p⬎ 0.05); therefore, these responses were pooled. Furthermore, 2⫻ 2 repeated-measures ANOVAs were used to measure between-group differences of saccade metrics, in-cluding prosaccade and antisaccade duration, amplitude, and velocity. The variables were group with two levels (ALS, controls) and task with two levels (pro, anti).
fMRI main contrast analyses. The BOLD time series for each voxel was
deconvolved with the canonical hemodynamic response function to es-timate the underlying time course of neural activity. The hemodynamic response function was modeled as a 13-point time series with a temporal resolution of 1.54 s. Events were modeled separately in the design matrix according to trial type, including the following: (1) anticatch trials, (2) procatch trials, (3) correct antisaccade trials, (4) correct prosaccade tri-als, (5) corrected antisaccade direction errors, and (6) invalid trials. Fix-ation trials were used as an implicit baseline.
Several statistical parametric maps were computed for each group, reflecting the statistical significance of the response consistency for each voxel within each trial type, as defined above. To identify the saccade-related neural network, we looked at correct full antisaccade trials and full prosaccade trials over BOLD time points 5–7 (7.7, 9.3, and 10.8 s from trial onset), which corresponded to the time intervals of the peak of the BOLD responses from the instructional cue presentation to the exe-cution of the saccade. These analyses resulted in group-level statistical maps that were generated at a false discovery rate corrected threshold of
p⬍ 0.01 (T value ⫽ 5.0). To identify the most reliable responses, using
the cluster threshold estimator plugin for BrainVoyager QX, we also calculated the minimum cluster size necessary to achieve a false activa-tion probability␣ ⫽ 0.05 (Forman et al., 1995). This procedure excluded clusters⬍49 contiguous voxels. These statistical maps constitute the main contrast, and were used for subsequent ROI second-level analyses pertaining to task set establishment and response execution.
fMRI ROI analyses. ROIs were chosen based on previous functional
imaging studies that showed consistent activation in these areas during prosaccade and antisaccade execution and preparation (Luna et al., 1998;
DeSouza et al., 2003;Connolly et al., 2005;Ford et al., 2005;Brown et al., 2006,2007;Raemaekers et al., 2007;Cameron et al., 2012;Hakvoort Schwerdtfeger et al., 2012;Jamadar et al., 2013). The following ROIs were selected from the main contrast to perform second level analyses and are known to participate in the saccade network: the frontal pole (FP), DLPFC, the insula, the anterior cingulate cortex (ACC), the STR, the
SEFs, the FEF, the precuneus (PCu), and the parietal eye fields (PEFs). ROI analyses were conducted using random-effects Gaussian linear models to extract-weight parameter estimates of BOLD signal change during saccades from each ROI. ROIs were identified using anatomical landmarks and known locations in Talairach space. Each ROI was de-fined as the 125 contiguous voxels (5⫻ 5 ⫻ 5) within a cubic cluster centered on the point of peak activation within the selected region. Peak preparatory activation was measured as the mean-weight values from the fifth and sixth time points following catch trial onset. For analysis of the saccade execution processes, the time points were shifted by 1.5 s to include the sixth and seventh time points following saccade trial onset, as the presentation of the peripheral target occurs 1.5 s (one time point) after the appearance of the instruction (Brown et al., 2007;Alahyane et al., 2014). Mixed-design Split-Plot ANOVAs with one within-subjects factor (with two levels: pro and anti) and one between-subjects factor (with two levels: control group and ALS group) were then conducted to examine differences in mean-weight values for all ROIs. Paired Stu-dent’s t tests were conducted to analyze the preparatory differences be-tween correct and error trials within the ALS group using the-weight averages of the fifth and sixth time points. Finally, to evaluate the rela-tionship between BOLD signal change and task performance, Pearson’s correlations were performed between-weight values and behavioral measurements, including SRT, CV, and proportion of direction errors.
Results
Clinical and neuropsychological evaluation
Scores from the clinical and neuropsychological evaluations of
ALS patients are summarized in
Table 1
. All patients included in
the study met the El Escorial criteria for “definite” ALS diagnosis.
Five patients had upper limb onset, six had lower limb onset, and
only one had bulbar onset. The mean disease duration for all
patients at the time of the clinical evaluation was 37.3 months
(range, 10 –168 months), and the mean vital capacity was 83.1%
predicted (forced vital capacity range, 62–101). The mean
⫾ SD
ALS Functional Rating Scale Revised version evaluation of
phys-ical disability was 36.3
⫾ 5.6.
The neuropsychological tests revealed considerable deficits in
the ALS patients. The mean MoCA score was 24.8
⫾ 3.5 of 30
points, which is above the average mild cognitive impairment
average of 22 points (
Nasreddine et al., 2005
). The ALS patients
performance on each MoCA domain was as follows: visuospatial/
executive 4.33
⫾ 0.77 (of 5), naming 2.91 ⫾ 0.28 (of 3), attention
(sum) 5.16
⫾ 1 (of 6), language (sum) 2.41 ⫾ 0.9 (of 3),
abstrac-tion 1.75
⫾ 0.45 (of 2), delayed recall 3 ⫾ 1.47 (of 5), and
orien-tation 5.91
⫾ 0.28 (of 6).The Neurobehavioral Cognitive Status
Examination reasoning and judgment scores (6.8
⫾ 1.7 and 5.3 ⫾
0.7, respectively) fell within the average ranges reported for
healthy adults (
Kiernan et al., 2011
). The mean verbal fluency
score was 6.1
⫾ 3.9 (range 2.9–14.8), which is within the lower
range of previous reports (
Massman et al., 1996
;
Abrahams et al.,
2000
;
Ahn et al., 2011
).
The ALS patients Frontal Behavioral Inventory score ranged
from 2 to 42, with an average of 11.0
⫾ 11.7. One patient had a
score of
ⱖ27, which is required for a diagnosis of frontal lobe
dementia (
Kertesz et al., 1997
). Mean Centre for Neurologic
Study Lability Scale emotional lability score was 10.8
⫾ 3.6. A
score of
ⱖ13 suggests emotional lability (
Moore et al., 1997
). ALS
participants did not display signs of depression or anxiety in the
Hospital Anxiety and Depression Scale test. All but one patient
fell within the normal range for anxiety. The average depression
score of 2.9
⫾ 2.4 and anxiety score of 4.3 ⫾ 3.1 fell within the
normal range of 0 –7 points (
Zigmond and Snaith, 1983
).
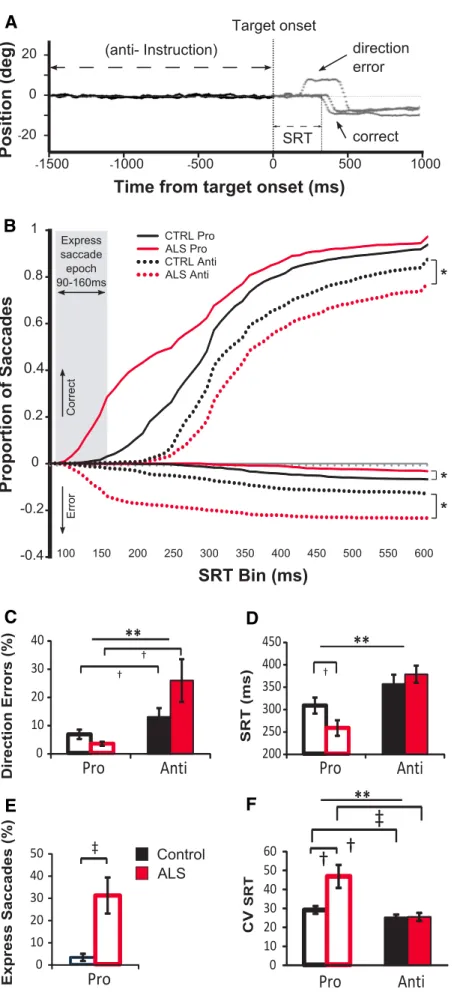
Eye movement behaviors
Eye movement behavioral data are shown
in
Figure 2
. Sample control eye traces
de-picting correct antisaccade trials and an
erroneous antisaccade trial (direction
er-ror) followed by a correction are shown in
Figure 2
A.
SRT cumulative distribution
The cumulative distribution of SRTs for
the prosaccade and antisaccade tasks are
displayed as a proportion of the total
number of trials, where the latencies of
correct and incorrect saccades were
cate-gorized into SRT bins of 10 ms increments
(
Fig. 2
B). In the prosaccade task, ALS
sub-jects were much faster than controls and
many responses fell within the express
saccade epoch (
Fig. 2
B, gray bar). In
con-trast, on the antisaccade task, control
sub-jects were faster at responding than ALS
patients. Cumulative SRT distributions
using the nonparametric two-sample
Kolmogorov–Smirnov test were
signifi-cantly different across ALS and control
groups for correct antisaccades (K
⫽
1.435, p
⬍ 0.033), incorrect antisaccade
trials (K
⫽ 4.489, p ⬍ 0.001), and
incor-rect prosaccade trials (K
⫽ 2.490, p ⬍
0.001). Distributions of correct
prosac-cade SRTs between ALS and controls were
not significantly different when all SRT
bins were included (K
⫽ 1.272, p ⬍
0.079); however, SRT distributions in the
express saccade epoch only (90 –160 ms)
were significantly different between groups
(K
⫽ 1.500, p ⬍ 0.022) (
Fig. 2
B).
Saccade direction errors
The ALS group made significantly more
direction errors on the antisaccade task
than in the prosaccade task (t
(11)⫽ ⫺2.61,
p
⫽ 0.02) (
Fig. 2
C), whereas the control
group direction errors on the antisaccade
task showed a large trend toward
signifi-cance (t
(11)⫽ ⫺2.12, p ⫽ 0.057)
com-pared with the prosaccade task. The
analysis of group by condition interaction
A
B
C
D
E
F
Figure 2. Eye movement behavioral data. A, Sample eye traces depicting correct antisaccade trials and an erroneous antisac-cade trial (direction error) followed by a correction. B, Cumulative probabilities of sacantisac-cade distributions for the two groups (pooled SRT across subjects). Positive Y values indicate correct saccades, whereas negative Y values indicate direction errors; dashed lines
4
indicate antitrials; solid lines indicate protrials; black lines in-dicate control; red lines inin-dicate ALS patients. Gray shaded region represents the region categorized as “express saccades” (90ⱕ SRT ⱕ 160 ms). Asterisks indicate significant shifts in error rates between the control group and the ALS group. C, Mean percentage direction errors (initial saccade away from target on prosaccade trial, toward target on antisaccade trial).
D, Mean SRTs on correct trials. E, Mean percentage of express
saccades (90 –160 ms). F, Mean intrasubject CVSRT. Error bars indicate SEM. †p⬍ 0.05, significance for group ⫻ task inter-actions only. ‡p⬍ 0.01, significance for group ⫻ task inter-actions only. *p⬍ 0.05. **p ⬍ 0.01, significance for main effects of task.
also resulted in a trend between group and task (F
(1,22)⫽ 3.21,
p
⫽ 0.08,
p2⫽ 0.127). Analysis of the direction errors revealed no
main effect of group (F
(1,22)⫽ 0.842, p ⫽ 0.37,
p2⫽ 0.037).
However, there was a significant main effect of task (F
(1,22)⫽
10.01, p
⬍ 0.01,
p2⫽ 0.313).
Saccadic reaction times
Analysis of SRTs (
Fig. 2
D) showed a significant main effect of task
(F
(1,22)⫽ 27.76, p ⬍ 0.01,
p2⫽ 0.558), with significantly
pro-longed antisaccade latencies as previously reported (
Shaunak et
al., 1995
;
Donaghy et al., 2010
). However, there was no main
effect of group (F
(1,22)⫽ 0.617, p ⫽ 0.44,
p2⫽ 0.027), or group ⫻
task interactions (F
(1,22)⫽ 3.94, p ⫽ 0.06,
p2⫽ 0.152).
Express saccades
The express saccade epoch was defined within the 90 –160 ms
interval. The ALS group made a significantly greater proportion
of express saccades on prosaccade trials
compared with controls (t
(22)⫽ ⫺2.37,
p
⫽ 0.027, d ⫽ ⫺1.3) (
Fig. 2
E).
SRT variability
SRT intrasubject variability was expressed
as a CV (
Fig. 2
F ). A main effect of task was
found for CVSRT (F
(1,22)⫽ 17.57, p ⬍
0.01,
p2⫽ 0.444) such that prosaccade
SRTs were significantly more variable
within subjects than antisaccades. A
sig-nificant group effect was also observed
(F
(1,22)⫽ 6.85, p ⫽ 0.016,
p2⫽ 0.237),
where ALS patients had more variability
for CVSRT than controls. The interaction
between group and task also reached
sig-nificance (F
(1,22)⫽ 9.7, p ⬍ 0.01,
p2⫽
0.306), likely as a result of the increased
prosaccade variability in the ALS group.
Saccade metrics
An ANOVA revealed no significant main
effect of group on saccade amplitude (F
(1,22)⫽ 0.66, p ⫽ 0.42,
p2⫽ 0.029) or saccade velocity (F
(1,22)⫽ 1.24, p ⫽ 0.27,
p2⫽
0.053), suggesting that ALS patients did not have significantly
altered saccade metrics. A main effect of task was observed for
saccade amplitude (F
(1,22)⫽ 7.96, p ⫽ 0.01,
p2⫽ 0.266), where
antisaccades had significantly greater amplitudes than
prosac-cades. A significant interaction effect between group and task on
saccade amplitude (F
(1,22)⫽ 9.37, p ⬍ 0.01,
p2⫽ 0.299) was
followed by pairwise comparisons, which revealed that
antisac-cades had significantly greater amplitudes than prosacantisac-cades only
within the ALS group ( p
⫽ 0.003). Saccade velocity showed no
main effect of task (F
(1,22)⫽ 1.3, p ⫽ 0.265,
p2⫽ 0.056) but
displayed a significant interaction between group and task (F
(1,22)⫽ 7.92, p ⫽ 0.01,
p2⫽ 0.265).
Behavioral correlations
Prosaccade and antisaccade SRTs and direction errors were
cor-related with neuropsychological test scores from
Table 1
. All
cor-relations of antisaccade SRTs were found to be not significant ( p
values
⬎0.11). All correlations of antisaccade direction errors
were also found to be not significant ( p values
⬎0.062), with the
exception of the MoCA score where a two-tailed Pearson’s
cor-relation revealed a significant negative corcor-relation between the
ALS group’s performance on the MoCA and the percentage of
antisaccade errors made (r
(12)⫽ ⫺0.686, p ⬍ 0.01), where
anti-saccade error rates increased as MoCA scores worsened.
fMRI results
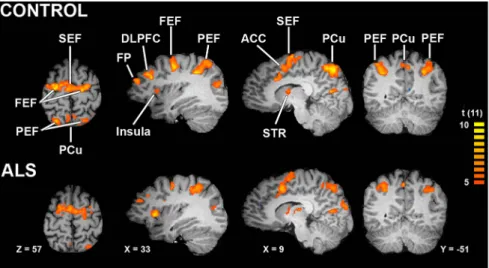
The saccade network
An initial analysis was performed to identify regions involved in
the preparation and execution of prosaccade and antisaccades.
This global analysis identified an oculomotor network that is
consistent with previous reports using fMRI to delineate
saccade-related areas (
Luna et al., 1998
;
Connolly et al., 2002
;
Ford et al.,
2005
;
Brown et al., 2006
,
2007
;
Anderson et al., 2012
;
Jamadar et
al., 2013
). Our results included FP, DLPFC, insula, SEF, FEF,
STR, PCu, and PEF.
Figure 3
depicts the most relevant slices for
this network for the control and ALS groups, and
Table 2
lists the
Talairach locations of peak activation for all key ROIs. Both
groups recruited all predefined ROIs, suggesting that the
ob-served behavioral deficits in the ALS group likely were attributed
Figure 3. Saccade network. Contrast map of combined correct prosaccade trials and antisaccade trials corrected using falsediscovery rate at p⬍0.01(tvalue⫽5.0,df⫽11).TheidentifiedROIswerecluster-correctedacrossthepopulationofvoxelswith
p⬍0.05(49contiguousvoxels,asestimatedbyBrainVoyager’sCluster-levelStatisticalThresholdEstimatorwith1000iterations).
Table 2. Regions of interesta
Control ALS
ROI CH X Y Z T value X Y Z T value FP L ⫺35 43 19 4.18 ⫺35 41 19 5.55 R 28 44 22 7.93 35 41 26 7.78 DLPFC L ⫺40 26 32 4.14 ⫺39 31 33 5.99 R 36 27 31 9.54 36 31 33 7.28 Insula L ⫺29 26 7 8.76 ⫺28 20 6 10 R 30 21 9 9.56 31 18 7 10.11 ACC L — — — — — — — — R 8 3 45 7.59 9 8 44 9.61 STR L ⫺21 ⫺3 7 8.44 ⫺27 ⫺1 8 9.48 R 21 ⫺7 10 9.47 24 1 7 7.5 SEF L ⫺6 ⫺11 56 8.28 ⫺6 ⫺3 54 9.65 R 3 ⫺11 57 10.03 3 ⫺1 57 8.82 FEF L ⫺20 ⫺13 57 10.79 ⫺19 ⫺7 62 12.81 R 23 ⫺5 54 16.18 24 ⫺6 52 8.56 PCu L ⫺24 ⫺66 48 10.59 ⫺26 ⫺57 46 6.81 R 27 ⫺62 42 17.03 27 ⫺58 45 6.78 PEF L ⫺24 ⫺66 48 13.42 ⫺26 ⫺57 46 6.81 R 27 ⫺62 42 15.78 27 ⫺58 45 7.28
aTalairach coordinates (X,Y,Z) of cubic clusters containing the 125 most significant voxels centered around peak
activation in GLM contrast maps for antisaccade⫹ prosaccade contrast (Fig. 3). All ROIs were 125 voxels taken at
to critical differences in subprocesses of prosaccade and
antisac-cade control (i.e., sacantisac-cade preparation or execution). The ROIs
obtained from this analysis were then selected for second-level
analyses to dissect the differential contribution of the preparatory
and execution processes.
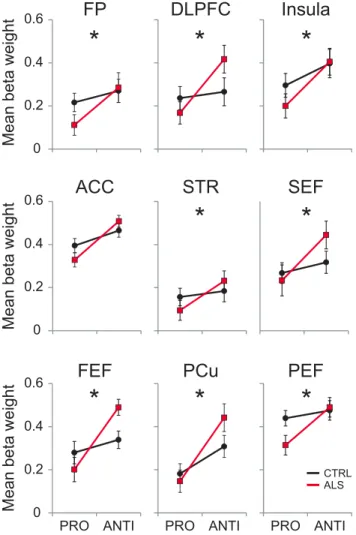
The preparatory network
Once the saccade network ROIs were defined, the BOLD signal
time courses corresponding to the catch trials were obtained (
Fig.
4
). To dissect the effect of ALS pathology on the processes
specif-ically involved in the preparation of the oculomotor network to
an impending prosaccade or antisaccade, we analyzed the fifth
and sixth time points (7.7 and 9.3 s from trial onset) of the
pro-catch and antipro-catch trials (
Fig. 5
). Group comparisons of the
average of these time points obtained from the local maxima

weight values at all ROIs are shown in
Figure 5
. We were
espe-cially interested in analyzing whether ALS patients responded
differently from controls when they had to inhibit the automatic
response in contrast to simply produce the automatic response
(i.e., we were interested in the interaction between these two
conditions). Prosaccade and antisaccade catch trials were
evalu-ated to determine which oculomotor regions were recruited by
the ALS group compared with controls when preparing a saccade
response to the prosaccade or antisaccade visual cue. The group
(control and ALS) by condition (prosaccade and antisaccade)
interaction was significant for all ROIs with the exception of the
ACC (
Fig. 5
). A significantly greater preparatory response was
evoked on antisaccade catch trials by the ALS group in the
fol-lowing regions: FP (F
(1,46)⫽ 4.27, p ⫽ 0.04,
p2⫽ 0.089), DLPFC
(F
(1,46)⫽ 16.14, p ⬍ 0.01,
p2⫽ 0.241), insula (F
(1,46)⫽ 11.10, p ⬍
0.01,
p2⫽ 0.202), ACC (F
(1,23)⫽ 16.14, p ⬍ 0.01,
p2⫽ 0.241),
STR (F
(1,46)⫽ 5.22, p ⫽ 0.02,
p2⫽ 0.106), SEF (F
(1,46)⫽ 8.00, p ⬍
0.01,
p2⫽ 0.154, FEF (F
(1,46)⫽ 13.96, p ⬍ 0.01,
p2⫽ 0.241), PCu
(F
(1,46)⫽ 11.67, p ⬍ 0.01,
p2⫽ 0.210), and PEF (F
(1,46)⫽ 4.94,
p
⫽ 0.03,
p2⫽ 0.101). The analysis of the condition (prosaccade
vs antisaccade) yielded significant differences in all areas: FP
(F
(1,44)⫽ 15.41, p ⬍ 0.01,
p2⫽ 0.25), DLPFC (F
(1,44)⫽ 25.94, p ⬍
0.01,
p2⫽ 0.37), insula (F
(1,44)⫽ 8.32, p ⬍ 0.01,
p2⫽ 0.15), ACC
(F
(1,44)⫽ 16.06, p ⬍ 0.01,
p2⫽ 0.42), STR (F
(1,44)⫽ 11.84, p ⬍
0.01,
p2⫽ 0.21), SEF (F
(1,44)⫽ 20.9, p ⬍ 0.01,
p2⫽ 0.32), PCu
(F
(1,44)⫽ 6.37, p ⫽ 0.01,
p2⫽ 0.12), PEF (F
(1,44)⫽ 11.34, p ⬍
0.01,
p2⫽ 0.20.
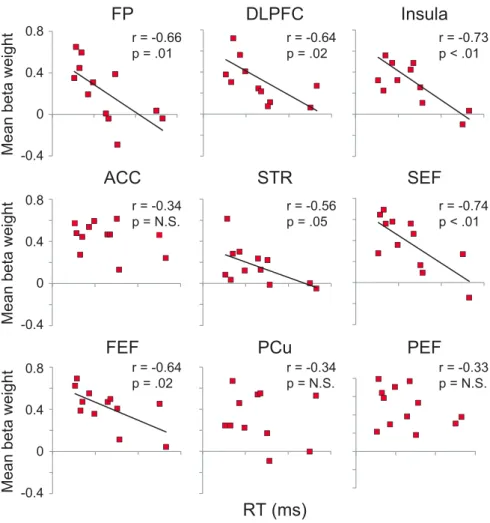
To analyze the effect of the heightened antisaccade
prepara-tory activation in the ALS group on saccade behavior, we
corre-lated the mean
 weights from anticatch trials to the antisaccade
reaction times for each ALS patient (
Fig. 6
). Significant negative
correlations were found between antisaccade reaction times and
mean
 weights in all preparatory oculomotor ROIs, with the
exception of the ACC, PCu, and PEF, suggesting that subjects
-0.2 0 0.2 0.4 0.6 -0.4 -0.2 0 0.2 0.4 0.6 -0.4 -0.2 0 0.2 0.4 0.6 -0.4 1.5 4.6 7.7 10.813.816.9 20 1.5 4.6 7.7 10.813.816.9 20Seconds
Mean beta weight
Mean beta weight
Mean beta weight
FP
DLPFC
ACC
STR
1.5 4.6 7.7 10.813.816.9 20FEF
Insula
SEF
PEF
PCu
CTRL Pro ALS Pro CTRL Anti ALS AntiFigure 4. ROI activation time course. Average activity time courses in the preparatory network ROIs during pro (solid lines) and anti (dashed lines) for control (black) and ALS patients (red). Gray bar represents the time points used for subsequent analysis.
who showed heightened activation when preparing to make an
antisaccade were able to execute faster antisaccade reaction times
(
Fig. 6
).
The saccade execution network
To isolate ROI activation involved in the execution of a
prosac-cade or antisacprosac-cade, we analyzed the mean peak
 weights of each
region using the sixth and seventh time points (9.3 and 10.8 s
from trial onset) of prosaccade and antisaccade trials minus the
preparatory activation from catch trials reported above. The
group
⫻ condition interaction analysis was significant in the
in-sula (F
(1,44)⫽ 4.84, p ⫽ 0.03,
p2⫽ 0.09), and showed a trend in
PEF (F
(1,44)⫽ 3.09, p ⫽ 0.08,
p2⫽ 0.06). The analysis of the
condition (prosaccade vs antisaccade) yielded significant
differ-ences in the ACC (F
(1,44)⫽ 5.65, p ⫽ 0.027,
p2⫽ 0.20), STR
(F
(1,44)⫽ 10.15, p ⬍ 0.01,
p2⫽ 0.18), SEF (F
(1,44)⫽ 10.92, p ⬍
0.01,
p2⫽ 0.19), PCu (F
(1,44)⫽ 21.58, p ⬍ 0.01,
p2⫽ 0.32), PEF
(F
(1,44)⫽ 20.39, p ⬍ 0.01,
p2⫽ 0.31), but not in FP, DLPFC,
insula, or FEF. Finally, the analysis of the group effect resulted in
a significant decrease only in PEF (F
(1,44)⫽ 5.09, p ⫽ 0.02,
p2⫽
0.10). These results show little disruption to the saccade
execu-tion network, suggesting that the main detrimental ALS effect is
associated with saccade preparation.
Direction errors
To analyze the underlying deficits in saccade preparation that
correlated with antisaccade errors in the ALS group, we analyzed
the fifth and sixth time points of the antisaccade error trials and
compared them with their respective time points obtained from
correct antisaccade trials for each ROI. ALS patients showed a
significant decrease in DLPFC activation (t
(23)⫽ 2.45, p ⫽ 0.02),
an increase in insula activation (t
(23)⫽ ⫺2.16, p ⫽ 0.041), and an
increase trend in SEF (t
(23)⫽ ⫺1.92, p ⫽ 0.06) (
Fig. 7
, left
col-umn) on antisaccade error trials compared with correct trials.
There were no significant differences between correct and error
antisaccade trials in the other areas: FP (t
(23)⫽ 1.53, p ⫽ not
significant), ACC (t
(23)⫽ ⫺.03, p ⫽ not significant), STR (t
(23)⫽
1.73, p
⫽ not significant), FEF (t
(23)⫽ ⫺1.45, p ⫽ not
signifi-cant), PCu (t
(23)⫽.09, p ⫽ not significant), and PEF (t
(23)⫽
⫺1.24, p ⫽ not significant). A similar analysis in the control
subjects showed significant decreases in activation on error
trials only in FEF (t
(23)⫽ 2.3, p ⫽ 0.03), and PEF (t
(23)⫽ 2.8,
p
⫽ 0.01).
To investigate the effect of antisaccade preparation on saccade
behavior, we correlated the preparatory BOLD signal of each
subject with the individual direction error performance during
the antisaccade task in all ROIs of the saccade network. The
anal-yses resulted in two significant negative correlations: one in SEF
(r
⫽ ⫺0.66, p ⫽ 0.03) and the other in FEF (r ⫽ ⫺0.77, p ⬍ 0.01)
(r
⫽ ⫺0.66, p ⫽ not significant) (
Fig. 7
, right column). The
correlation analyses in all the other regions were not significant:
FP (r
⫽ 0.28, p ⫽ not significant), DLPFC (r ⫽ ⫺0.13, p ⫽ not
significant), insula (r
⫽ ⫺0.56, p ⫽ not significant), ACC (r ⫽
⫺0.48, p ⫽ not significant), STR (r ⫽ 0.48, p ⫽ not significant),
PCu (r
⫽ ⫺0.35, p ⫽ not significant), and PEF (r ⫽ ⫺0.40, p ⫽
not significant).
Discussion
We tested whether deterioration in the implementation of
flexi-ble behaviors in ALS is directly associated with DLPFC
dysfunc-tion. To this end, we used a prosaccade and antisaccade task
coupled with fMRI and eye tracking. We found that ALS patients
were significantly impaired when implementing flexible
behav-ior, as demonstrated by a greater proportion of antisaccade
di-rection errors (
Fig. 2
B, C). This error-related impairment was
accompanied by a significant reduction in DLPFC activity (
Fig.
7
). A bias toward automatic responses in ALS was also
demon-strated by a greater proportion of express saccades and more
variable prosaccade SRTs (
Fig. 2
E, F ). The results also showed
functional changes that included significant increased activation
in critical areas of the antisaccade network, such as FEF, SEF, and
DLPFC, during saccade preparation. ALS patients showing these
heightened responses during this task set establishment period
also showed better performance during the antisaccade task
(
Fig. 6
).
Behavioral deficits in ALS
Our results confirmed that ALS patients had antisaccade
impair-ments (
Shaunak et al., 1995
;
Evdokimidis et al., 2002
;
Donaghy et
al., 2010
) joining a body of research that has confirmed that ALS
patients show oculomotor deficits in addition to the evident
mo-tor deterioration related to the momo-tor neuron degeneration (
Ja-cobs et al., 1981
;
Leveille et al., 1982
;
Ohki et al., 1994
;
Shaunak et
al., 1995
;
Donaghy et al., 2010
;
Sharma et al., 2011
;
Burrell et al.,
2013
). The oculomotor deficits documented in ALS include
oph-thalmoplegia (
Harvey et al., 1979
), defective pursuit (
Jacobs et al.,
00.2 0.4 0.6
Mean beta weight
0 0.2 0.4 0.6
Mean beta weight
ACC
FEF
FP
0 0.2 0.4 0.6Mean beta weight
DLPFC
STR
PCu
Insula
SEF
PEF
PRO ANTI PRO ANTI PRO ANTI
CTRL ALS
*
*
*
*
*
*
*
*
Figure 5. ROI procatch and anticatch trials analysis. Group⫻ condition interaction analysis using the mean weight peak activity during procatch and anticatch trials for control and ALS groups. Note the heightened activity increase in the anticatch condition in all areas in the ALS group. ACC also showed a significant activity increase in the anticatch condition; however, the group⫻ condition interaction did not reach significant levels. Error bars indicate SE. *p ⬍ 0.05.
1981
), saccadic impairments (
Shaunak et
al., 1995
;
Donaghy et al., 2010
),
nystag-mus (
Kushner et al., 1984
), and abnormal
Bell phenomenon (
Esteban et al., 1978
).
Defects in pursuit have been attributed to
nonnuclear involvement of
extrapyrami-dal or corticobulbar components of the
oculomotor system. Saccadic
impair-ments reported include slowing of vertical
saccades, increased incidence of errors,
and increased latency on the antisaccade
task. Surprisingly, reflexive saccades
ap-pear to remain relatively intact, with
bulbar onset demonstrating somewhat
slower reflexive saccades than limb onset
patients (
Donaghy et al., 2010
).
The significant increase of express
sac-cades in ALS patients is a novel finding.
Express saccades are elicited when high
levels of pretarget activity combine with
visual responses in saccade-related
neu-rons of the superior colliculus (
Dorris et
al., 1997
;
Dorris and Munoz, 1998
;
Ever-ling et al., 1998
,
1999
). During the gap
pe-riod, pretarget preparatory activity is
elevated and conditions are optimal for
express saccade generation, making
sup-pression of an unwanted saccade on an
antisaccade trial very difficult, unless
suf-ficient inhibition from the frontal lobes is
exerted on saccade neurons in superior
colliculus (
Everling et al., 1998
,
1999
;
Mu-noz and Everling, 2004
). ALS patients
show defective intracortical inhibition,
leading to deficits in inhibitory
interneu-ronal circuits that result in hyperexcitable
cortical neurons (
Ziemann et al., 1997
).
Therefore, the ALS patients’ bias toward
automatic express saccades could be the result of high levels of
motor preparation activity because of defective intracortical
inhibi-tion, combined with poor executive control resulting from DLPFC
impairment.
We also investigated whether there was any correlation
be-tween the eye movement behaviors and the neuropsychological
tests. The only significant finding was that the ALS antisaccade
error rate was inversely correlated with the MoCA score, which
places more emphasis on frontal executive and attentional
pro-cess than the more traditional Mini-Mental Status Examination
(
Smith et al., 2007
). However, we did not find correlations with
other general measurements of frontal lobe function, such as
Frontal Behavioral Inventory or Controlled Oral Word
Associa-tion. Previous findings show a large variation in this regard. Some
studies have reported a lack of correlations between clinical data
and oculomotor measurements (
Shaunak et al., 1995
), whereas
others have shown significant correlations with frontal lobe
de-pendent tasks, such as the Wisconsin Card Sorting Test (
Evdo-kimidis et al., 2002
) or the Stroop task (
Donaghy et al., 2010
).
However, in the last study, the correlations with the Stroop
mea-sures were only found in bulbar onset patients. It also should be
noted that ALS patients’ cognitive performance varied
consider-ably (
Table 1
), suggesting a continuum of impairments in this
group of patients.
Saccade network activity
To perform a successful antisaccade, several cortical and
subcor-tical brain regions must be recruited, including DLPFC (
Guitton
et al., 1985
;
Pierrot-Deseilligny et al., 2003
), FEF, PEF, and SEF
(
Connolly et al., 2002
;
Curtis and D’Esposito, 2003
;
DeSouza et
al., 2003
;
Ford et al., 2005
;
Brown et al., 2007
), and basal ganglia
(
Cameron et al., 2009
;
Ford and Everling, 2009
;
Watanabe and
Munoz, 2010
,
2011
,
2013
). It is well documented that
prepara-tory neural activity established before the appearance of the
peripheral target presets the motor system to execute the
appro-priate action (
Everling and Munoz, 2000
;
Curtis and D’Esposito,
2003
;
DeSouza et al., 2003
). Here we showed that ALS patients
recruited a similar neural network during both the preparatory
and the execution stages of prosaccades and antisaccades.
How-ever, the results from our study revealed critical differences in
activation not only between ALS and control group, but also
within correct and incorrect antisaccade trials of ALS patients,
which can help explain the observed oculomotor deficits in this
group of ALS patients.
The analysis of the preparatory activity during prosaccades
and antisaccades yielded significant between-group differences
for the entire preparatory saccade network. These differences
were driven by a significant increase of preparatory activity in
response to the antisaccade cue compared with the prosaccade
cue in the ALS group. Previous ALS imaging studies using block
0-0.4 0.4 0.8
Mean beta weight
0 -0.4 0.4 0.8
Mean beta weight
0 -0.4 0.4 0.8
Mean beta weight
FP
ACC
FEF
r = -0.66 p = .01 r = -0.34 p = N.S. r = -0.64 p = .02RT (ms)
DLPFC
STR
PCu
r = -0.64 p = .02 r = -0.56 p = .05 r = -0.34 p = N.S.Insula
SEF
PEF
r = -0.73 p < .01 r = -0.74 p < .01 r = -0.33 p = N.S.Figure 6. Correlations of activation in selected ROIs of the saccade network with SRT. Pearson’s correlations between mean weight peak activity during anticatch trials and SRT during antisaccades in all ALS patients. Note how individuals with a larger average activity during the preparatory phase in many areas, including DLPFC, show faster reaction times when executing correct antisaccades.
designs have found significant increases of activity during various
tasks in patients (
Mohammadi et al., 2011
;
Cosottini et al., 2012
;
Poujois et al., 2013
), suggesting a possible compensatory
mecha-nism (
Konrad et al., 2002
,
2006
;
Schoenfeld et al., 2005
;
Han and
Ma, 2006
;
Lule´ et al., 2007
;
Douaud et al., 2011
). The correlation
analysis between antisaccade preparatory activation and
antisac-cade reaction time showed significant negative correlations in the
FP, DLPFC, insula, STR, SEF, and FEF, suggesting that greater
preparatory activity in these ROIs corresponded to faster reaction
times (
Braun et al., 1992
;
Everling and Munoz, 2000
;
Connolly et
al., 2005
;
Hakvoort Schwerdtfeger et al., 2012
). Interestingly,
al-though the insula has not traditionally been related to the saccade
network, brain imaging studies have shown that it is constantly
active during antisaccade tasks (
Brown et al., 2006
;
Raemaekers et
al., 2007
), possibly because of its involvement with saliency
pro-cessing (
Menon and Uddin, 2010
). In relation to the heightened
activity, our results in various ROIs of the saccade network
con-trast with previous studies in other patient populations, such as
Parkinson’s disease and attention deficit hyperactivity disorder,
which showed reduced preparatory activity in critical areas of the
network, including SEF, FEF, PEF, STR, and DLPFC (
Rieger et
al., 2008
;
Cameron et al., 2012
;
Hakvoort Schwerdtfeger et al.,
2012
). This strongly suggests that ALS pathology has a main effect
on antisaccades at the preparatory stage. Regarding the execution
activity, the interaction analysis results showed that the core of
the antisaccade network was similar for both groups. This is
in-teresting because previous functional imaging reports have
sug-gested changes in cortical activation boundaries (
Kew et al.,
1993
). Although our experiment did not directly address this
issue, the activity changes that we found point to a compensatory
activation instead. However, it remains to be determined whether
this activation increase is a byproduct of a decrease in
interneu-ron inhibitory activity (
Turner and Kiernan, 2012
).
Direction error activity
In contrast to a block design, event-related studies allow for
BOLD response analyses on a trial-by-trial basis. Exploiting this,
we analyzed the BOLD signal from antisaccade trials where ALS
patients made directional errors. We found a significant
reduc-tion in DLPFC preparatory activity during erroneous
antisac-cades, in contrast to higher than normal activity levels during
correct antisaccades (discussed above), which supports our
hy-pothesis that faulty antisaccade implementation in ALS is related
to DLPFC dysfunction. Frontal lobe functional changes have
been reported mainly on tasks related to language (
Abrahams et
al., 1996
,
2004
) and hand movement tasks (
Kew et al., 1993
;
Konrad et al., 2002
;
Schoenfeld et al., 2005
;
Stanton et al., 2007
;
Mohammadi et al., 2011
). The majority of those studies tested
simple motor tasks; however, in one study ALS patients were
instructed to make joystick movements in freely selected random
sequences that are self-initiated responses that require some
planning (
Stanton et al., 2007
). Although ALS patients showed
increased activity centered in the primary sensorimotor cortex,
they also showed reduced DLPFC activity (
Stanton et al., 2007
).
These findings are similar to our results in that we found
in-creased activity in a number of areas of the saccade network but
reduced activity in the DLPFC when a subject made antisaccade
errors. However, our experimental design allowed us to clearly
distinguish the processes that were associated with these changes.
Our analyses of the areas that showed activity increases during
erroneous antisaccade trials showed that this heightened activity
correlated with a smaller number of errors, reaching statistical
significance in SEF and FEF. In contrast, the reduced DLPFC
activation was specifically related to a faulty implementation of
the task set.
In conclusion, our findings show that, in ALS patients, an
abnormal DLPFC activation specifically during the
establish-ment of the task set, is related to a deficit in the inhibition of
automatic responses, a crucial process within the executive
sys-tem. These results provide a direct link between a particular
im-pairment of cognitive process and a functional deficit in the
prefrontal cortex in ALS. Our results also show that ALS patients’
heightened functional activity found in specific areas of the
sac-3
2
1
0
-1
r = -0.13
p = N.S.
0
0.4
0.8
Mean beta weight
*
DLPFC
3
2
1
0
-1
r = -0.56
p = 0.06
0.2
0.6
1
Mean beta weight
*
Insula
Mean beta weight
0.4
0.8
1.2
3
2
1
0
4
r = -0.66
p < 0.03
SEF
r = -0.77
p < 0.01
0.2
0.6
1
Mean beta weight
3
2
1
0
4
FEF
Anti
Correct
Error
Anti
Error percent
0
20
40
Figure 7. Direction errors analysis. Left, Mean weight peak activity during correct and error trials in the antisaccade task for the ALS group. Note the significant reduced activity in DLPFC during error trials. Right, Correlations between mean weight peak activities during antisaccade error trials with the percentage of errors. Note how the increased activity in the insula, SEF, and FEF correlated with fewer errors. Error bars indicate SE. *p⬍ 0.05.