Publisher’s version / Version de l'éditeur:
Journal of Agricultural and Food Chemistry, 2015-12-03
READ THESE TERMS AND CONDITIONS CAREFULLY BEFORE USING THIS WEBSITE.
https://nrc-publications.canada.ca/eng/copyright
Vous avez des questions? Nous pouvons vous aider. Pour communiquer directement avec un auteur, consultez la
première page de la revue dans laquelle son article a été publié afin de trouver ses coordonnées. Si vous n’arrivez pas à les repérer, communiquez avec nous à PublicationsArchive-ArchivesPublications@nrc-cnrc.gc.ca.
Questions? Contact the NRC Publications Archive team at
PublicationsArchive-ArchivesPublications@nrc-cnrc.gc.ca. If you wish to email the authors directly, please see the first page of the publication for their contact information.
Archives des publications du CNRC
This publication could be one of several versions: author’s original, accepted manuscript or the publisher’s version. / La version de cette publication peut être l’une des suivantes : la version prépublication de l’auteur, la version acceptée du manuscrit ou la version de l’éditeur.
For the publisher’s version, please access the DOI link below./ Pour consulter la version de l’éditeur, utilisez le lien DOI ci-dessous.
https://doi.org/10.1021/acs.jafc.5b04609
Access and use of this website and the material on it are subject to the Terms and Conditions set forth at
Effects of heating on proportions of azaspiracids 1−10 in mussels (Mytilus edulis) and identification of carboxylated precursors for azaspiracid-5, -10, -13 and -15
Kilcoyne, Jane; McCarron, Pearse; Hess, Philipp; Miles, Christopher O.
https://publications-cnrc.canada.ca/fra/droits
L’accès à ce site Web et l’utilisation de son contenu sont assujettis aux conditions présentées dans le site LISEZ CES CONDITIONS ATTENTIVEMENT AVANT D’UTILISER CE SITE WEB.
NRC Publications Record / Notice d'Archives des publications de CNRC:
https://nrc-publications.canada.ca/eng/view/object/?id=d40801f0-78b2-4468-93b8-ab5b656efe75 https://publications-cnrc.canada.ca/fra/voir/objet/?id=d40801f0-78b2-4468-93b8-ab5b656efe75
1
Effects of Heating on Azaspiracids in Mussels
Effects of Heating on Proportions of Azaspiracids 1−10 in Mussels (Mytilus
edulis) and Identification of Carboxylated Precursors for Azaspiracid5,
-10, -13 and -15
Jane Kilcoyne,†,* Pearse McCarron, ‡ Philipp Hess, ┴ and Christopher O. Miles∇
†Marine Institute, Rinville, Oranmore, Co. Galway, Ireland
‡ Measurement Science and Standards, National Research Council Canada, Halifax, NS, B3H
3Z1, Canada
┴Ifremer, Laboratoire Phycotoxines, Rue de l'Ile d'Yeu, 44311 Nantes, France
∇Norwegian Veterinary Institute, P.O. Box 750 Sentrum, 0106 Oslo, Norway
2
ABSTRACT 1
Azaspiracids (AZAs) are marine biotoxins that induce human illness following the consumption of
2
contaminated shellfish. EU regulation stipulates that only raw shellfish are tested, yet shellfish are
3
often cooked prior to consumption. Analysis of raw and heat-treated mussels (Mytilus edulis)
4
naturally contaminated with AZAs revealed significant differences (up to 4.6-fold) in AZA 1−3, 1−3,
5
and -6, 6, values due to heat induced chemical conversions. Consistent with previous studies high
6
levels of 3 and 6 were detected in some samples that were otherwise below the limit of quantitation
7
before heating. Relative to 1, in heat treated mussels the average (n=40) levels of 3 (range 11−502%)
8
and 6 (range 3−170%) were 62% and 31% respectively. AZA4, 4, (range <1–27%), AZA5, 5 (range
9
1–21%) and AZA8, 8 (range 1–27%) were each ~ 5%, while AZA7, 7, AZA9, 9 and AZA10, 10
10
(range <1–8%) were each under 1.5%. Levels of 5 and 10 (and AZA13, 13 and AZA15, 15)
11
increased after heating leading to the identification of novel carboxylated AZA precursors in raw
12
shellfish extracts which were shown by deuterium labeling to be precursors for 5, 10, 13 and 15.
13
14
KEYWORDS: Azaspiracid, decarboxylation, hydroxylation, chemical conversion, heating, mass
15
spectrometry, metabolism.
16
3
INTRODUCTION 18
AZAs were first identified following a poisoning incident in which several people became ill in the
19
Netherlands after consuming mussels (Mytilus edulis) harvested off the West coast of Ireland.1,2,3
20
Since that time more than 30 analogues have been observed in shellfish,4,5,6 phytoplankton,7,8,9
21
crabs10 and a marine sponge.11 AZA1–10, 1–10,2,3,12−14 and 37-epi-115 have been isolated from
22
shellfish and their structures elucidated through a combination of NMR spectroscopy, LC-MS and
23
chemical reactions. Further analogues AZA33 and -34 were isolated from bulk cultures of A.
24
spinosum.9 Only 1, 2 and 3 are currently regulated in raw shellfish.16 Compounds 1 and 2 are
25
produced by the dinoflagellate Azadinium spinosum.17 Many of the other analogues have been shown
26
to be shellfish metabolites18−21 and a metabolic pathway for some of the AZAs described has been
27
proposed.18,21
28 29
Oral administration of AZAs induces chronic effects in mice22 and damage to internal organs.23 In
30
vitro AZAs are cytotoxic to mammalian cell lines24 and teratogenic to fish embryos.25 To date, the
31
mode of action has not been identified. AZAs have been shown to be K+ channel blockers,26
32
however, the concentrations required are two-fold those for cytotoxicity. The current regulatory limit
33
is in part based on intraperitoneal mouse studies performed following the initial isolation of 1–3.2,3
34
These studies indicated that 2 and 3 were more toxic than 1 and toxic equivalent factors are applied
35
to results to reflect the difference in toxicity.27 However, recent oral and intraperitoneal mouse
36
studies have contradicted these results showing that 1 is more toxic than 2 and 3.28 Furthermore, an
37
oral mouse study on 6 was performed for the first time showing that it is slightly less toxic than 1.28
38
In vitro, the order of potency was 2 > 6 > 8 3 > 1 > 4 5 using the Jurkat T lymphocyte cell
39
assay.14
40 41
Studies, comparing the analysis of raw and cooked mussels, have shown significant differences in
42
concentrations. Levels of AZAs were found to increase 2-fold in tissues that were cooked due to loss
4
of water from the matrix.29 A similar study also reported the same effect for the OA group toxins,30
44
while additional work on the OA group toxins reported significant increases (up to 150 %) which
45
could not be accounted for due to a concentration effect alone but was additionally due to increased
46
extraction of toxins following heat treatment.31 Further studies on AZAs revealed that levels of 3, 4,
47
6 and 9 increased when samples were heat treated due to decarboxylation of AZA17, 21, 19 and -48
23 respectively,18 however the scale of these increases was not fully evaluated. Levels of the
37-49
epimers of AZAs were also found to increase after application of heat, with levels increasing to as
50
much as 16% that of the parent analogue.15
51
Here we evaluate the current regulatory methods used for the detection of AZAs in shellfish by
52
accurately quantitating and comparing the toxin profiles in both raw and heat treated mussels. We
53
additionally describe new AZA analogues and subsequently amend the previously proposed
54
metabolic pathway in M. edulis.
55
56
MATERIALS AND METHODS 57
Che micals All solvents (pesticide analysis grade) were from Labscan (Dublin, Ireland). Distilled 58
H2O was further purified using a Barnstead nanopure diamond UV purification system (Thermo
59
Scientific, Waltham, MA). Formic acid (>98%), ammonium formate and deuterated MeOH
60
(CH3OD, >99.5 atom-% D) were from Sigma–Aldrich (Steinheim, Germany). AZA CRMs for 1–3
61
were obtained from the National Research Council (Halifax, NS, Canada).32 Non certified calibrant
62
standards for 4–10 were prepared as described previously.14
63 64
Analysis of Raw and Heat Treated Mussel Tissues. AZA-contaminated raw samples, tested as part 65
of the routine monitoring programme in Ireland, were selected for analysis. The shellfish were
66
shucked and homogenised before extraction. Tissue samples were weighed (2 g) in duplicate into
5
50 mL centrifuge tubes with one set placed in a water bath (Grant Ltd) and heated to 90 °C for
68
10 min, then allowed to cool. The samples were extracted by vortex mixing for 1 min with 9 mL of
69
MeOH, centrifuged at 3,950 g (5 min), and the supernatants decanted into 25 mL volumetric flasks.
70
The remaining pellet was further extracted using an Ultra Turrax (IKA) for 1 min with an additional
71
9 mL of MeOH, centrifuged at 3,950 × g (5 min), and the supernatants decanted into the same 25 mL
72
volumetric flasks, which were brought to volume with MeOH. The samples were then passed
73
through Whatman 0.2 µm cellulose acetate filters into HPLC vials for analysis by LC-MS/MS.
74
Raw Hepatopancreas Extract. 5g of homogenised hepatopancreas (dissected from AZA
75
contaminated M. edulis, collected from the Northwest of Ireland in 2005) was extracted with MeOH
76
by vortex mixing for 1 min with 4 mL of MeOH, centrifuged at 3,950 g (5 min), and the supernatant
77
decanted into a 10 mL volumetric flask. The remaining pellet was further extracted using an Ultra
78
Turrax (IKA) for 1 min with an additional 4 mL of MeOH, centrifuged at 3,950 × g (5 min), and the
79
supernatant decanted into the same 10 mL volumetric flask. The sample was passed through a
80
Whatman 0.2 µm cellulose acetate filter into a HPLC vial for analysis. A 500 µL of the extract was
81
placed in a water bath heated to 90 °C for 10 min, then allowed to cool.
82
Deuterium Incorporation. Two 500 µL aliquots of the hepatopancreas extract were transferred to 83
HPLC vials and evaporated under N2 without the use of heat. One of the dried residues was dissolved
84
in 500 µL of CH3OD and the other was dissolved in 500 µL of MeOH. Both aliquots were heated in
85
a water bath at 70 °C for 10 min. The samples were evaporated under N2 without the use of heat. The
86
residues were then re-dissolved in 500 µL of MeOH and analyzed by LC–MS.
87
LC-MS Experiments. 88
Method A. Analysis was performed on a model 2695 LC instrument (Waters, Manchester, UK)
89
coupled to a triple-stage quadrupole (TSQ) Ultima instrument (Micromass, Manchester, UK)
90
operated in selected reaction monitoring (SRM) mode, with the following transitions: 5 m/z
6
844.5808.5/362.3, AZA44, 11 m/z 888.5808.5/362.3, 10 m/z 858.5822.5/362.3, AZA45, 12
92
m/z 902.5822.5/362.3, 13 m/z 860.5824.5/362.3, AZA46, 14 m/z 904.5824.5/362.3, 15 m/z
93
874.5838.5/362.3, AZA47, 16 m/z 918.5838.5/362.3. The cone voltage was 60 V and the
94
collision voltage was 40 V, the cone and desolvation gas flows were set at 100 and 800 L/h,
95
respectively, and the source temperature was 150 °C.
96
Binary gradient elution was used, with phase A consisting of water and phase B of 95% acetonitrile
97
in water (both containing 2 mM ammonium formate and 50 mM formic acid). The column used was
98
a 50 mm × 2.1 mm i.d., 3 µm, Hypersil BDS C8 column with a 10 mm × 2.1 mm i.d. guard column
99
of the same stationary phase (Thermo Scientific, Waltham, MA). The gradient was from 30−90% B
100
over 8 min at 0.25 mL/min, held for 5 min, then held at 100% B at 0.4 mL/min for 5 min, and
101
returned to the initial conditions and held for 4 min to equilibrate the system. The injection volume
102
was 5 µL and the column and sample temperatures were 25 °C and 6 °C, respectively.
103
Method B. Analysis was performed on an Acquity UPLC coupled to a Xevo G2-S QToF (Waters,
104
Manchester, UK) operated in MSe mode, scanning from 100−1200 m/z. Leucine encephalin was used
105
as the reference compound. The cone voltage was 40 V, collision energy was 50 V, the cone and
106
desolvation gas flows were set at 100 and 1000 L/h, respectively, and the source temperature was
107
120 °C.
108
The column used was a 50 mm × 2.1 mm i.d., 1.7 µm, Acquity UPLC BEH C18 (Waters, Wexford,
109
Ireland), using the same mobile phase described in method A. The gradient was from 30–90% B
110
over 5 min at 0.3 mL/min, held for 0.5 min, and returned to the initial conditions and held for 1 min
111
to equilibrate the system. The injection volumes were 2 µL and 5 µL and the column and sample
112
temperatures were 25 °C and 6 °C, respectively.
7
Method C. Carboxylated precursors were monitored using the same instrument and UPLC conditions
114
as was used for method B, scanning in MS/MS mode for the following ions: m/z 844.4 (5), 888.5
115
(11), 858.5 (10), 902.5 (12), 860.5 (13), 904.5 (14), 874.5 (15) and 918.5 (16).
116
RESULTS AND DISCUSSION 117
Proportions of 1–10 in Raw and Heat Treated Mussels. To determine the relative importance of 118
1–10, raw shellfish contaminated with AZAs were heated to simulate cooking (with no water loss). 119
The analysis of cooked mussels most accurately reflects what is ingested by the consumer, and
120
additional differences have been reported between the analysis of raw and cooked shellfish (M.
121
edulis) in terms of concentrations.29−31 Compounds 3, 4, 6 and 9 are produced by heat-induced
122
decarboxylation of AZA17, -21, -19 and -23 respectively (Figure 1), and are not normally present in
123
significant amounts in uncooked mussels.18 Compounds 5 and 10 were proposed to be direct
124
bioconversion products of 3 and 6 respectively.21,20 LC-MS showed that 1–3 (regulated) and 6 were
125
the predominant analogues in heat treated mussels (Table 1, Figure 2). There was huge variation in
126
the levels of the analogues 3−10 (Figure 2), possibly due to differing rates of metabolism in the
127
mussels. Time of harvesting may also be significant as mussels harvested directly following an
128
intense bloom will likely have higher proportions of 1 and 2 than if they were harvested at some time
129
after the bloom (due to metabolism). The average levels (relative to 1) of 3 and 6 were 62% (range
130
11−502%) and 31% (range 3−170%) respectively. The average levels of 4, 5 and 8 were each ~ 5%,
131
while 7, 9 and 10 were each under 1.5% (Figure 2). Figure 3 shows an LC-MS/MS chromatogram of
132
a heat treated sample with significant levels of 3, 4 and 6 that were not present in significant
133
quantities in the raw sample. A feeding study (in which M. edulis was fed with A. spinosum)21
134
showed that metabolism of 1 and 2 to AZA17 and -19, respectively, was detectable after 3 h, with
135
levels of these metabolites increasing up to 2 days and then remaining constant to the end of the
136
experiment (4 days). Relative to 1, the proportions of AZA17 and -19 reached a maximum of 145%
137
and 55% respectively while the analogues 4, 5 and 7–10 accounted for ~ 58% in total. However, that
8
study was performed under laboratory conditions, and the high levels of AZA accumulation
139
observed in naturally contaminated mussels33 was not replicated.
140
In a recent study, 6 was found to be 7-fold more cytotoxic than 1,14 whereas a mouse oral dosing
141
study found it to be only slightly less toxic than 1.28 Nonetheless, these results highlight the degree to
142
which AZA-toxicity can be underestimated in routine monitoring programs where uncooked
143
shellfish are tested. Previously, total levels of AZA analogues other than 1–3 were reported to
144
comprise less than 5%,6 however this study indicates that the analogues 4–10 comprise on average
145
13% (ranging from 5% to 24%) of the total AZAs (1–10) in heat treated mussels. Further analysis of
146
AZA contaminated mussels using an ELISA method showed the total concentration of AZAs was
147
significantly higher than the regulated toxins (AZA1−3) detected by LC-MS/MS.34 All of the six
148
formal risk assessments for AZAs35 have been based on a poisoning event in 199736 and only take
149
into account the analogues AZA1, -2 and -3. However, it is now clear that other analogues must have
150
also been present at the time. Different toxin profiles have been reported from other countries, where
151
2 is more abundant than 1,11,37−39 and the shellfish from these locations are therefore likely to contain 152
higher levels of 6, 9 and 10. In such circumstances, these analogues may have greater significance.
153
Identification of Novel Carboxylated Analogues. Previously 5 and 10 were suggested to be formed 154
via C-23 hydroxylation of 3 and 6, respectively.21 In the present study, however, levels of 5 and 10
155
increased significantly after heat treatment (Figures 2 and 3). This suggested that 5 and 10 are, as
156
previously demonstrated for 3, 4, 6, and 9,18 produced via heat-promoted decarboxylation of the
157
corresponding 22-carboxy-precursors (AZA44 and AZA45, respectively). In the heating process,
158
enzymes responsible for hydroxylation would have been destroyed, so it is unlikely that the observed
159
increase in 5 and 10 after heating were due to enzymatic hydroxylation of 3 and 6, respectively. To
160
test this hypothesis, LC-MS/MS analysis of AZA contaminated M. edulis samples for AZA44 (m/z
161
888) and AZA45 (m/z 902) was performed. Analogous carboxylated precursors for 13 and 15 were
162
also anticipated, so the possible presence of AZA46 (m/z 904) and -47 (m/z 918) was also
9
investigated. It was expected that concentrations of these postulated analogues would be low, so a
164
concentrated M. edulis hepatopancreas extract containing high levels of AZAs was analysed. The
165
precursor compounds AZA44–47 (11, 12, 14 and 16) were observed in the hepatopancreas extract,
166
however the presence of the analogues 3, 6, 4, 5, 9, 13 and 15 (Figure 4) also indicated that some
167
decarboxylation had already occurred prior to extraction. Following the application of heat (90 °C,
168
10 min) the carboxylated precursors (AZA17, AZA19, AZA21, AZA23, 11, 12, 14 and 16) could no
169
longer be detected in the extract, and there was a corresponding increase in the intensities of the
170
peaks corresponding to their 22-decarboxylation products (3, 6, 4, 9, 5, 10, 13 and 15, respectively).
171
Because this experiment was performed in filtered methanolic solutions, enzymatic catalysis is
172
unlikely to be directly involved in the transformation.
173
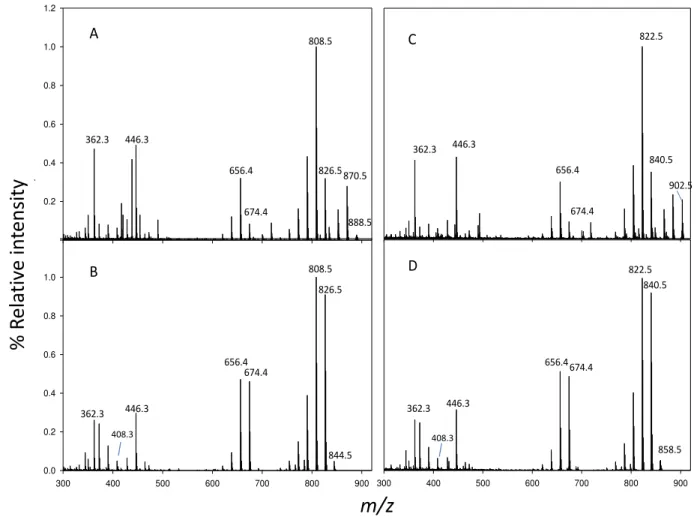
Accurate mass measurements (Table 2) were consistent with the proposed structures of AZA44–47.
174
The carboxylated and decarboxylated analogues displayed similar fragmentation patterns, with the
175
carboxylated precursors showing an increase in mass of 44 Da. The spectra of the carboxylated
176
precursors displayed an initial water loss, followed by a loss of 44 Da due to loss of the
22-177
carboxylic acid group as CO2 (Table 2, Figures 5 and 6). Relative to their decarboxylated products, a
178
smaller RDA fragment at m/z 674.4 is observed, in addition to the absence of the m/z 408.3 fragment
179
that is characteristic2 to the C-23 hydroxylated analogues (Figures 5 and 6). To confirm that 5, 10, 13
180
and 15 are formed following decarboxylation of AZA44, -45, -46 and -47 respectively, an
181
experiment on the hepatopancreas extract was performed to show incorporation of deuterium
182
following heat treatment in the presence of deuterated MeOH. Uptake of deuterium was observed for
183
all analogues with increases in the + 1 Da isotope, that was not observed for 1 and 2. The uptake of
184
deuterium and conversion to known and established structures provides very strong structural
185
evidence for AZA44 and -45 (Supporting information). As the structures for AZA13 and -15 have
186
not yet been fully characterized, the proposed structures for AZA46 and -47 remain tentative. The
187
available evidence is consistent with the pathway shown in Figure 7, with oxidative metabolism at
10
C-3, C-13 and on the 22-Me, and slow (but accelerated by heating) decarboxylation of the resulting
189
22-carboxy group.
190
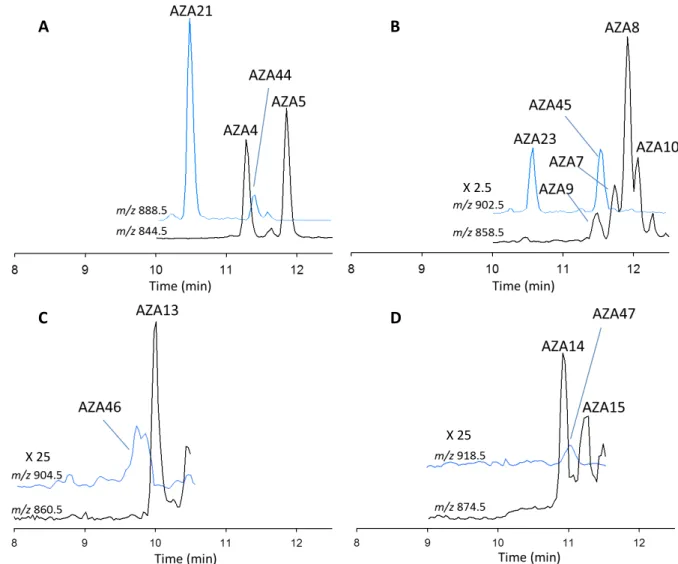
In terms of retention time, distinct differences were observed. AZA44 and -45 eluted ~ 0.5 min
191
earlier than their respective decarboxylated products (5 and 10), while smaller retention time
192
differences were observed for AZA46 and -47 compared to 13 and 15 respectively (difference of ~
193
0.3 min) (Figure 4).
194
In summary, analysis of heat-treated mussels from Ireland that were naturally contaminated with
195
AZAs revealed high levels of 3 and 6. These compounds were not present at significant levels in the
196
uncooked shellfish, highlighting the fact that AZA equivalent values for raw mussels can grossly
197
underestimate the toxicity of the AZAs present (up to 4.6-fold difference for 1−3 and 6). This effect
198
is further compounded by the increase in concentration of these compounds due to water loss during
199
cooking.29 Levels of 4, 5 and 7–10 were generally low in Irish mussels, and did not contribute
200
significantly to overall toxicity, although the situation may be different for other shellfish species.
201
However, in areas where 2 is the predominant AZA analogue, 6, 9 and 10 will most likely have more
202
relevance than in Irish mussels. Not only do these results suggest that tissues should be heat-treated
203
prior to analysis, but also that 6 should be included in the regulations to more accurately reflect the
204
toxin profile to which shellfish consumers are exposed. Due to the huge variation in levels of the
205
decarboxylated analogues it is difficult to build in a safety factor that deals with these bioconversions
206
effectively based on the currently regulated toxins. The EU harmonized LC-MS method40 has been
207
amended to deal with a concentration effect due to the loss of water during cooking for processed
208
samples, however, for the analysis of raw samples a heating step should be included. These measures
209
are necessary to enhance human health protection and prevent loss of valuable processed product due
210
to rejection by importing countries. Such amendments would warrant a review of the current
211
regulatory limit, which should consider the fact that no cases of human intoxications were reported
212
from mussels that were over the regulatory limit following heat treatment.
11
Four additional carboxylated AZA analogues were identified which were shown to be precursors for
214
the analogues 5, 10, 13 and 15 and were named AZA44, -45, -46 and -47, respectively.
215
12
ASSOCIATED CONTENT 217
Supporting Information 218
Table showing proportions of 1–10 in M. edulis samples (n=40); mass spectra of 5, 10, 13 and 15
219
showing incorporation of deuterium; chromatograms of hepatopancreas extract after heating; table
220
showing retention times of decarboxylated AZAs and their precursors.
221
AUTHOR INFORMATION 222
Corresponding author 223
*Tel: +353 91 387376. Fax: +353 91 387201. Email: jane.kilcoyne@marine.ie
224
Funding 225
This project (PBA/AF/08/001(01) was carried out under the Sea Change strategy with the support of
226
the Marine Institute and the Marine Research Sub-Programme of the National Development Plan
227
2007–2013, co-financed under the European Regional Development Fund and supported in part by a
228
Marie Curie International Incoming Fellowship (to C.O.M.) within the seventh European
229
Community Framework Programme (FP7/2007–2013) under grant agreement no. 221117. The
230
research leading to these results has received funding from the European Union Seventh Framework
231
Programme (FP7/2007−2013) under the ECsafeSEAFOOD project (grant agreement n° 311820).
232
Notes 233
The authors declare no competing financial interest.
234 235
ACKNOWLEDGEMENTS 236
We thank the biotoxin chemistry team at the Marine Institute, Galway.
237
13
REFERENCES 239
(1) McMahon, T.; Silke, J. Winter toxicity of unknown aetiology in mussels. Harmful Algae News
240
1996, 14. 241
(2) Satake, M.; Ofuji, K.; Naoki, H.; James, K. J.; Furey, A.; McMahon, T.; Silke, J.; Yasumoto, T.
242
Azaspiracid, a new marine toxin having unique spiro ring assemblies, isolated from Irish
243
mussels, Mytilus edulis. J. Am. Chem. Soc. 1998, 120, 9967–9968.
244
(3) Ofuji, K.; Satake, M.; McMahon, T.; Silke, J.; James, K. J.; Naoki, H.; Oshima, Y.; Yasumoto, T.
245
Two analogs of azaspiracid isolated from mussels, Mytilus edulis, involved in human
246
intoxications in Ireland. Nat. Toxins 1999, 7, 99–102.
247
(4) Braña Magdalena, A.; Lehane, M.; Kris, S.; Fernandez, M. L.; Furey, A.; James, K. J. The first
248
identification of azaspiracids in shellfish from France and Spain. Toxicon 2003, 42, 105–108.
249
(5) James, K. J.; Diaz Sierra, M.; Lehane, M.; Braña Magdalena, A.; Furey, A. Detection of five new
250
hydroxyl analogues of azaspiracids in shellfish using multiple tandem mass spectrometry.
251
Toxicon 2003, 41, 277–283.
252
(6) Rehmann, N.; Hess, P.; Quilliam, M. A. Discovery of new analogs of the marine biotoxin
253
azaspiracid in blue mussels (Mytilus edulis) by ultra-performance liquid
254
chromatography/tandem mass spectrometry. Rapid Commun. Mass Spectrom. 2008, 22, 549–
255
558.
256
(7) Krock, B.; Tillmann, U.; John, U.; Cembella, A. D. Characterization of azaspiracids in plankton
257
size-fractions and isolation of an azaspiracid-producing dinoflagellate from the North Sea.
258
Harmful Algae 2009, 8, 254–263.
259
(8) Krock, B.; Tillmann, U.; Voß, D.; Koch, B. P.; Salas, R.; Witt, M.; Potvin, É.; Jeong, H. J. New
260
azaspiracids in Amphidomataceae (Dinophyceae). Toxicon 2012, 60, 830–839.
261
(9) Kilcoyne, J.; Nulty, C.; Jauffrais, T.; McCarron, P.; Herve, F.; Wilkins, A. L.; Foley, B.; Rise, F.;
262
Crain, S.,; Twiner, M. J.; Hess, P.; Miles, C. O. Isolation, structure elucidation, relative LC-MS
14
response, and in vitro toxicity of azaspiracids from the dinoflagellate Azadinium spinosum. J.
264
Nat. Prod. 2014, 77, 2465–2474.
265
(10) Torgersen, T.; Bremnes, N. B.; Rundberget, T.; Aune, T. Structural confirmation and
266
occurrence of azaspiracids in Scandinavian brown crabs (Cancer pagurus). Toxicon 2008, 51,
267
93–101.
268
(11) Ueoka, R.; Ito, A.; Izumikawa, M.; Maeda, S.; Takagi, M.; Shin-ya, K.; Yoshida, M.; van Soest,
269
R. W. M.; Matsunaga, S. Isolation of azaspiracid-2 from a marine sponge Echinoclathria sp. as
270
a potent cytotoxin. Toxicon 2009, 53, 680–684.
271
(12) Ofuji, K.; Satake, M.; McMahon, T.; James, K. J.; Naoki, H.; Oshima, Y.; Yasumoto, T.
272
Structures of azaspiracid analogs, azaspiracid-4 and azaspiracid-5, causative toxins of
273
azaspiracid poisoning in Europe. Biosci. Biotechnol. Biochem. 2001, 65, 740–742.
274
(13) Kilcoyne, J.; Keogh, A.; Clancy, G.; LeBlanc, P.; Burton, I.; Quilliam, M. A.; Hess, P.; Miles,
275
C. O. Improved isolation procedure for azaspiracids from shellfish, structural elucidation of
276
azaspiracid-6, and stability studies. J. Agric. Food Chem. 2012, 60, 2447–2455.
277
(14) Kilcoyne, J.; Twiner, M. J.; McCarron, P.; Crain, S.; Giddings, S. D.; Wilkins, A. L.; Hess, P.;
278
Miles, C. O. Structure elucidation, relative LC-MS and in vitro toxicity of azaspiracids 7–10
279
isolated from mussels (Mytilus edulis). J. Agric. Food Chem. 2015, 63, 5083–5091.
280
(15) Kilcoyne, J.; McCarron, P.; Twiner, M. J.; Nulty, C.; Wilkins, A. L.; Rise, F.; Quilliam, M. A.;
281
Miles, C. O. Epimers of azaspiracids: isolation, structural elucidation, relative LC-MS response,
282
and in vitro toxicity of 37-epi-azaspiracid-1. Chem. Res. Toxicol. 2014, 27, 587–600.
283
(16) Commission Regulation (EU) No 15/2011 of 10th January 2011 amending Regulation (EC) No
284
2074/2005 as regards recognised testing methods for detecting marine biotoxins in live bivalve
285
molluscs. Official Journal of the European Union L6, 3–6.
286
(17) Tillmann, U.; Elbrächter, M.; Krock, B.; John, U.; Cembella, A. D. Azadinium spinosum gen. et
287
sp. nov. (Dinophyceae) identified as a primary producer of azaspiracid toxins. Eur. J. Phycol.
288
2009, 44, 63–79. 289
15
(18) McCarron, P.; Kilcoyne, J.; Miles, C. O.; Hess, P. Formation of azaspiracids-3, -4, -6, and -9 via
290
decarboxylation of carboxyazaspiracid metabolites from shellfish. J. Agric. Food Chem. 2009,
291
57, 160–169.
292
(19) Salas, R.; Tillmann, U.; John, U.; Kilcoyne, J.; Burson, A.; Cantwell, C.; Hess, P.; Jauffrais, T.;
293
Silke, J. The role of Azadinium spinosum (Dinophyceae) in the production of azaspiracid
294
shellfish poisoning in mussels. Harmful Algae 2011, 10, 774–783.
295
(20) O’Driscoll, D.; Skrabakova, Z.; O’Halloran, J.; Van Pelt, F.; James, K. Mussels increase
296
xenobiotic (azaspiracid) toxicity using a unique bioconversion mechanism. Environ. Sci.
297
Technol. 2011, 45, 3102–3108.
298
(21) Jauffrais, T.; Marcaillou, C.; Herrenknecht, C.; Truquet, P.; Séchet, V.; Nicolau, E.; Tillmann,
299
U.; Hess, P. Azaspiracid accumulation, detoxification and biotransformation in blue mussels
300
(Mytilus edulis) experimentally fed Azadinium spinosum. Toxicon 2012, 60, 582–595.
301
(22) Ito, E.; Satake, M.; Ofuji, K.; Higashi, M.; Harigaya, K.; McMahon, T.;Yasumoto, T. Chronic
302
effects in mice caused by the oral administration of sublethal doses of azaspiracid, a new
303
marine toxin isolated from mussels. Toxicon 2002, 40, 193–203.
304
(23) Ito, E.; Satake, M.; Ofuji, K.; Kurita, N.; McMahon, T.; James, K. J.; Yasumoto, T. Multiple
305
organ damage caused by a new toxin azaspiracid, isolated from mussels produced in Ireland.
306
Toxicon 2000, 38, 917–930.
307
(24) Twiner, M. J.; Hanagriff, J. C.; Butler, S.; Madhkoor, A. K.; Doucette, G. J. Induction of
308
apoptosis pathways in several cell lines following exposure to the marine algal toxin
309
azaspiracid-1. Chem. Res. Toxicol. 2012, 25, 1493–1501.
310
(25) Colman, J. R.; Twiner, M. J.; Hess, P.; McMahon, T.; Satake, M.; Yasumoto, T.; Doucette, G.
311
J.; Ramsdell, J. S. Teratogenic effects of azaspiracid-1 identified by microinjection of Japanese
312
medaka (Oryzias latipes) embryos. Toxicon 2005, 45, 881–890.
16
(26) Twiner, M. J.; Doucette, G. J.; Rasky, A.; Huang, P. X.; Roth, B. L.; Sanguinetti, M. C. The
314
marine algal toxin azaspiracid is an open state blocker of hERG potassium channels. Chem.
315
Res. Toxicol. 2012, 25, 1975–1984.
316
(27) EFSA. Opinion of the scientific panel on contaminants in the food chain on a request from the
317
European Commission on marine biotoxins in shellfish – azaspiracids. The EFSA Journal 2008,
318
1–52.
319
(28) Kilcoyne, J.; Jauffrais, T.; Twiner, M.; Doucette, G.; Aasen Bunæs, J. A.; Sosa, S.; Krock, B.;
320
Séchet, V.; Nulty, C.; Salas, R.; Clarke, D.; Geraghty, J.; Duffy, C.; Foley, B.; John, U.;
321
Quilliam, M. A.; McCarron, P.; Miles, C. O.; Silke, J.; Cembella, A.; Tillmann, U.; Hess, P.
322
Azaspiracids – toxicological evaluation, test methods and identifcation of the source organisms
323
(ASTOX II). Marine Institute - Marine Research Sub-Programme (NDP 2007−2013) series
324
2014, (http://oar.marine.ie/handle/10793/970). 325
(29) Hess, P.; Nguyen, L.; Aasen, J.; Keogh, M.; Kilcoyne, J.; McCarron, P.; Aune, T. Tissue
326
distribution, effects of cooking and parameters affecting the extraction of azaspiracids from
327
mussels, Mytilus edulis, prior to analysis by liquid chromatography coupled to mass
328
spectrometry. Toxicon 2005, 46, 62–71.
329
(30) McCarron, P.; Kilcoyne, J.; Hess, P. Effects of cooking and heat treatment on concentration and
330
tissue distribution of okadaic acid and dinophysistoxin-2 in mussels (Mytilus edulis). Toxicon
331
2008, 51, 1081–1089. 332
(31) Blanco, J.; Arévalo, F.; Correa, J.; Porro, C. M.; Cabado, A. G.; Vieites, J. M.; Moroño, A.
333
Effect of the industrial steaming on the toxicity, estimated by LC-MS/MS of mussels exposed
334
for a long time to diarrhetic shellfish poisoning (DSP) toxins. Food Chem. 2015, 177, 240−247.
335
(32) Perez, R.; Rehmann, N.; Crain, S.; LeBlanc, P.; Craft, C.; MacKinnon, S.; Reeves, K.; Burton,
336
I.; Walter, J. A.; Hess, P.; Quilliam, M. A.; Melanson, J. The preparation of certified calibration
337
solutions for azaspiracid-1, -2, and -3, potent marine biotoxins found in shellfish. Anal.
338
Bioanal. Chem. 2010, 398, 2243–2252.
17 (33) HABs, database. 340 http://www.marine.ie/home/publicationsdata/data/Habs+Search+Database/HabsSearch.htm. 341 Accessed 14 April 2015. 342
(34) Samdal, I. A.; Løvberg, K. E.; Briggs, L. R.; Kilcoyne, J.; Xu, J.; Forsyth, C. J.; Miles, C. O.
343
Development of an ELISA for the detection of azaspiracids. J. Agric. Food Chem. 2015, 63,
344
7855–7861.
345
(35) Twiner, M. J.; Hess, P.; Doucette, G. J. Azaspiracids: toxicology, pharmacology, and risk
346
assessment, in Seafood and Freshwater Toxins 2014, 3rd Edition (Botana, L. M., Ed.), CRC
347
Press, pp 823–855.
348
(36) McMahon, T.; Silke, J. Re-occurence of winter toxicity. Harmful algae News 1998, 17, 12.
349
(37) Taleb, H.; Vale, P.; Amanhir, R.; Benhadouch, A.; Sagou, R.; Chafik, A. First detection of
350
azaspiracids in North West Africa. J. Shell. Res. 2006, 25, 1067–1071.
351
(38) Vale, P.; Bire, R.; Hess, P. Confirmation by LC–MS/MS of azaspiracids in shellfish from the
352
Portuguese north-western coast. Toxicon 2008, 51, 1449–1456.
353
(39) López-Rivera, A.; O’Callaghan, K.; Moriarty, M.; O’Driscoll, D.; Hamilton, B.; Lehane, M.;
354
James, K. J.; Furey, A. First evidence of azaspiracids (AZAs): a family of lipophilic polyether
355
marine toxins in scallops (Argopecten purpuratus) and mussels (Mytilus chilensism) collected
356
in two regions of Chile. Toxicon 2010, 55, 692–701.
357
(40) EURL, 2015. EU Reference Laboratory Marine Biotoxins, web-site, last accessed on 12 July
358 2015: 359 http://aesan.msssi.gob.es/en/CRLMB/web/procedimientos_crlmb/crlmb_standard_operating_pr 360 ocedures.shtml 361 362 363
18
365
Table 1. Measured Concentrations (µg/g) of 1−3 and 6 in Irish M. edulis Samples Before and After Heating (method A) 366
Harvesting location (Irish Atlantic coast)
Harvesting date
Raw Heated
1 2 3 6 *AZA equiv.
(1−3) 1 2 3 6 *AZA equiv. (1−3) Ratio of 1cooked and –3 + 6 in uncooked shellfish West 26/09/2012 0.06 0.02 0.00 0.00 0.10 0.06 0.02 0.07 0.02 0.18 2.1 Southwest 27/09/2012 0.16 0.04 0.01 0.00 0.24 0.16 0.04 0.06 0.01 0.30 1.3 Southwest 27/09/2012 0.10 0.02 0.00 0.00 0.15 0.10 0.02 0.04 0.01 0.20 1.4 Northwest 27/09/2012 0.04 0.01 0.00 0.00 0.07 0.04 0.02 0.07 0.02 0.17 3.0 West 24/09/2012 0.22 0.05 0.01 0.00 0.33 0.20 0.05 0.12 0.03 0.48 1.4 West 24/09/2012 0.12 0.03 0.00 0.00 0.18 0.10 0.03 0.07 0.02 0.24 1.5 Southwest 24/09/2012 0.11 0.03 0.00 0.00 0.16 0.09 0.02 0.04 0.01 0.18 1.1 West 24/09/2012 0.03 0.01 0.01 0.00 0.07 0.03 0.02 0.14 0.04 0.25 4.6 Southwest 26/09/2012 0.08 0.02 0.00 0.00 0.12 0.08 0.02 0.03 0.00 0.16 1.3 West 24/09/2012 0.02 0.02 0.01 0.00 0.06 0.03 0.02 0.08 0.02 0.18 3.0
*AZA equivalents of total regulated AZAs (1–3) calculated following application of the toxic equivalence factors for 2 (1.8) and 3 (1.4) relative to 1.23 Values exceeding the EU regulatory limit
367
(0.16 μg/g) are shown in bold text. 368
Red indicating areas where there is significant change. 369 370 371 372 373 374 375 376
19
Table 2. Accurate Mass Measurements (method B) of 11, 12, 14 and 16. 377
[M+H]+ [M+H-H
2O-COO]+ Group 1 Group 2 Group 3
AZA Measured mass ppm Δ Measured mass Δ ppm Measured Mass ppm Δ Measured Mass ppm Δ Measured Mass ppm Δ AZA44 (11) 888.4738 -0.2 826.4744 0.3 674.3895 -1.3 446.2901 -1.1 362.2679 -4.4 AZA45 (12) 902.4898 0.2 840.4915 2.0 674.3900 -0.6 446.2891 -3.4 362.2695 0 AZA46 (14) 904.4700 1.2 842.4667 -2.8 674.3912 1.2 446.2921 3.4 362.2681 -3.9 AZA47 (16) 918.4825 -2.2 856.4838 -1.1 674.3897 -1.0 446.2901 -1.1 362.2680 -4.1 378
20
380
Figure 1. Structures of AZA1–16, -17, -19, -21, -23, -44, -45, -46 and -47, their protonated masses 381
and origin. Note: Only 1–10 have had their structures confirmed by NMR, while AZA17, 19, 21,
-382
R1 R2 R3 R4 [M+H]+
AZA (C-3) (C-8) (C-22) (C-23) m/z Origin Status Decarboxylation
product
AZA1 (1) H H CH3 H 842.5 A. spinosum phycotoxin
AZA2 (2) H CH3 CH3 H 856.5 A. spinosum phycotoxin
AZA3 (3) H H H H 828.5 shellfish metabolite
AZA4 (4) OH H H H 844.5 shellfish metabolite
AZA5 (5) H H H OH 844.5 shellfish metabolite
AZA6 (6) H CH3 H H 842.5 shellfish metabolite
AZA7 (7) OH H CH3 H 858.5 shellfish metabolite
AZA8 (8) H H CH3 OH 858.5 shellfish metabolite
AZA9 (9) OH CH3 H H 858.5 shellfish metabolite
AZA10 (10) H CH3 H OH 858.5 shellfish metabolite
AZA11 OH CH3 CH3 H 872.5 shellfish metabolite
AZA12 H CH3 CH3 OH 872.5 shellfish metabolite
AZA13 (13) OH H H OH 860.5 shellfish metabolite
AZA14 OH H CH3 OH 874.5 shellfish metabolite
AZA15 (15) OH CH3 H OH 874.5 shellfish metabolite
AZA16 OH CH3 CH3 OH 888.5 shellfish metabolite
AZA17 H H COOH H 872.5 shellfish metabolite AZA3
AZA19 H CH3 COOH H 886.5 shellfish metabolite AZA6
AZA21 OH H COOH H 888.5 shellfish metabolite AZA4
AZA23 OH CH3 COOH H 902.5 shellfish metabolite AZA9
AZA44 (11) H H COOH OH 888.5 shellfish metabolite AZA5
AZA45 (12) H CH3 COOH OH 902.5 shellfish metabolite AZA10
AZA46 (14) OH H COOH OH 904.5 shellfish metabolite AZA13
21
established structures (3, 6, 4, 9, 5, 10, 13 and 15, respectively).
384
385
Figure 2. Proportions (% ± SD) of 2–10 relative to 1 (method B) in raw and heat treated M. edulis 386
(n=40) harvested off the Atlantic coast of Ireland.
387 388 389 390 391
A)A a alogue
%
Rel
ati
ve
to
A
)A
0 20 40 60 80 100 120 140 160 1 2 3 4 5 6 7 8 9 10 Raw Heat treated22 m/z . m/z . m/z . m/z . m/z . 3.0. 3.5. 4.0. 4.5. 5.0. 3.0 3.5 4.0 4.5 5.0
A
B
A)A
A)A
A)A
A)A
A)A
A)A
A)A
A)A
A)A
A)A
A)A
A)A
A)A
A)A
A)A
A)A
Ti e i
392 393 394 395 396 397 398 399 400 401 402 403 404Figure 3. LC-MS (method B) of A) a raw M. edulis sample extract (0.7 µg/g AZA equivalents in the raw extract) from the Marine Institute biotoxin monitoring 405
programme and B) the same extract after heat treatment, showing peaks for 1–10.
23
408
409
Figure 4. LC-MS analysis (method A) of: A) AZA44 (11) and AZA5 (5); B) AZA45 (12) and 410
AZA10 (10); C) AZA46 (14) and AZA13 (13); and D) AZA47 (16) and AZA15 (15) in a raw M.
411
edulis hepatopancreas extract.
412 413 414 415 A B D C X 2.5 X 25 X 25
24
416
Figure 5. LC-MS mass spectra (method C) of: A) AZA44 (11) and B) its decarboxylation product 417
AZA5 (5); C) AZA45 (12) and D) its decarboxylation product AZA10 (10).
418 419 420 421 422 423 888.5 808.5 674.4 656.4 446.3 362.3 870.5 826.5 0.0 0.2 0.4 0.6 0.8 1.0 1.2 300 400 500 600 700 800 900 0.0 0.2 0.4 0.6 0.8 1.0 1.2 % R e la ti v e i nt e ns it y 844.5 826.5 808.5 674.4 656.4 446.3 362.3 m/z A B 300 400 500 600 700 800 900 858.5 840.5 822.5 656.4674.4 362.3 446.3 822.5 362.3 446.3 656.4 674.4 840.5 902.5 C D 408.3 408.3
%
R
el
a
ti
v
e i
n
ten
si
ty
m/z
25
424
Figure 6. LC-MS mass spectra (method C) of: A) AZA46 (14) and B) its decarboxylation product 425
AZA13 (13); C) AZA47 (16) and D) its decarboxylation product AZA15 (15).
426 427 428 429 430 918.5 856.5 838.5 656.5 674.5 446.5 362.5 300 400 500 600 700 800 900 856.5 838.5 674.4 656.4 446.3 362.3 874.5 C D 0.0 0.2 0.4 0.6 0.8 1.0 1.2 904.5 842.5 824.5 656.4 674.4 446.3 362.3 300 400 500 600 700 800 900 0.0 0.2 0.4 0.6 0.8 1.0 1.2 860.5 842.5 824.5 674.4 656.4 446.3 362.3 % R e la ti v e i nt e ns it y m/z A B
%
R
el
a
ti
v
e i
n
ten
si
ty
m/z
408.3 408.326
431
Figure 7. Proposed AZA inter-relationships in M. edulis. 432
433 434 435
27 TOC graphic 437 438 439 440
441 % relative (to 1) proportions Uncooked M. edulis Heat treated M. edulis Aza sp iraci d an al ogu e 0 50 100 1 2 3 4 5 6 7 8 9 10 0 50 100