Publisher’s version / Version de l'éditeur:
Vous avez des questions? Nous pouvons vous aider. Pour communiquer directement avec un auteur, consultez
la première page de la revue dans laquelle son article a été publié afin de trouver ses coordonnées. Si vous n’arrivez pas à les repérer, communiquez avec nous à [email protected].
Questions? Contact the NRC Publications Archive team at
[email protected]. If you wish to email the authors directly, please see the first page of the publication for their contact information.
https://publications-cnrc.canada.ca/fra/droits
L’accès à ce site Web et l’utilisation de son contenu sont assujettis aux conditions présentées dans le site LISEZ CES CONDITIONS ATTENTIVEMENT AVANT D’UTILISER CE SITE WEB.
The 17th International European Conference on Machine Learning and the 10th
European Conference on Principles and Practice of Knowledge Discovery in
Databases (ECML/PKDD 2006) [Proceedings], 2006
READ THESE TERMS AND CONDITIONS CAREFULLY BEFORE USING THIS WEBSITE.
https://nrc-publications.canada.ca/eng/copyright
NRC Publications Archive Record / Notice des Archives des publications du CNRC :
https://nrc-publications.canada.ca/eng/view/object/?id=24ec87c1-576b-4774-a926-b59c7188c80c
https://publications-cnrc.canada.ca/fra/voir/objet/?id=24ec87c1-576b-4774-a926-b59c7188c80c
NRC Publications Archive
Archives des publications du CNRC
This publication could be one of several versions: author’s original, accepted manuscript or the publisher’s version. / La version de cette publication peut être l’une des suivantes : la version prépublication de l’auteur, la version acceptée du manuscrit ou la version de l’éditeur.
Access and use of this website and the material on it are subject to the Terms and Conditions set forth at
Measuring to Fit: Virtual Tailoring through Cluster Analysis and
Classification
National Research Council Canada Institute for Information Technology Conseil national de recherches Canada Institut de technologie de l'information
Measuring to Fit: Virtual Tailoring Through
Cluster Analysis and Classification *
Viktor, H.L., Paquet, E., and Guo, H.
September 2006
* published at the 17th
International European Conference on Machine Learning and the 10th
European Conference on Principles and Practice of Knowledge Discovery in Databases (ECML/PKDD 2006). Berlin, Germany. September 18-22, 2006. NRC 48749.
Copyright 2006 by
National Research Council of Canada
Permission is granted to quote short excerpts and to reproduce figures and tables from this report, provided that the source of such material is fully acknowledged.
Measuring to Fit: Virtual Tailoring through
Cluster Analysis and Classification
Herna L. Viktor1, Eric Paquet2, and Hongyu Guo1 1 School of IT and Engineering, University of Ottawa,
800 King Edward Road, K1N 6N5 Ottawa, Canada {hlviktor, hguo028}@site.uottawa.ca, http://www.site.uottawa.ca/∼hlviktor/
2 Visual Information Technology Group, National Research Council of Canada,
50 Montreal Road, K1N 6N5 Ottawa, Canada [email protected]
Abstract. Clothes should be designed to tailor well, fit the body ele-gantly and hide obvious body flaws. To attain this goal, it is crucial to know the interrelationships between different body measurements, such as the interplay between e.g. shoulder width, neck circumference and waist. This paper discusses a study to better understand the typical con-sumer, from a virtual tailor’s perspective. Cluster analysis was used to group the population into five clothing sizes. Next, multi-relational clas-sification was applied to analyze the interplay between each group’s an-thropometric body measurements. Throughout this study, three-dimensi-onal (3-D) body scans were used to verify the validity of our findings. Our results indicate that different sets of body measurements are used to characterize each clothing size. This information, together with the de-mographic profiles of the typical consumer, provides us with new insight into our evolving population.
1
Introduction
Designing clothes that fit the population well is an important issue in the in-dustry. This is of crucial importance, not only for the mass market, but also for expensive designer labels. Consider today’s highly competitive clothing market. If a clothing brand that sells, for example jeans, do not produce garments that tailor well, the customers will take their business elsewhere. Clothes must fit the population. Otherwise, they will not sell. This implies that the different sizes (e.g. small, medium, large) must correspond to real body shapes, in the sense that one or more archetypes should represent any individual member belonging to the cluster. Clothing designers cannot utilize averages, since, if one average many human bodies, one ends up with a blob that has no relation whatsoever with any human being.
This gives rise to a number of important questions. What is the typical profile of consumers’ bodies? How do the body measurements within different clothing sizes interrelate? For example, what is the interplay between the arm length,
waist size and shoulder width of a typical medium-size male? What are the interrelationships with the demographic profiles of our consumers, in terms of income, education, number of children, and age, amongst others. We may want to consider, e.g., the hip circumference, thigh circumference and bottom to knee height of the members of the female population with a high income, in order to design expensive pants to fit these consumers well. This paper discusses our experimental results when attempting to answer these questions. Here, we discuss how we analysed the body measurements of a number of human subjects, as contained in the CAESART Manthropometric database. We verified the outcome
of our results against a set of corresponding 3-D body scans, i.e. the scans of the subjects who are sitting and standing. This approach is used in order to ensure that our results correspond to reality.
This paper is organized as follows. Section 2 introduces the CAESART M
database, an anthropometric repository. Next, in Section 3, we introduce the experimental approach we followed to analyze this data. Section 4 contains the experimental results. This is followed, in Section 5, by our analysis of the results and the lessons learned. Section 6 concludes the paper.
2
CAESAR
T MDatabase
What is anthropometry? Anthropometry is the study of human body measure-ments (height, weight, size, proportions, etc.) and its biomechanical characteris-tics, including the stature, sizes of body parts and the space in which the body functions, e.g. reach its limits and clearances needed for movement. Anthropo-metric data therefore refer to a collection of physical dimensions of a human body. The aim of anthropometry is to characterize the human body by a set of measurements [1, 2]. The field of anthropometry has many applications, ranging from the architectural and interior design of restricted spaces such as airline and vehicle seats, to the design of spaces for easy access by the elderly and the dis-abled. Anthropometry is also very important in retail tailoring, in order to ensure that the clothing fits the person well, is esthetically pleasing and comfortable. This application is the focus of our research, i.e. to investigate anthropometric body measurements from a tailoring point of view. To this end, we are analyzing the CAESART M database, as discussed next.
The CAESART M Project is an international anthropometric survey that was
carried out in the United States, Italy, the Netherlands and Canada. This survey involved a large number of individuals in each country. For each individual, a series of highly accurate anthropometric measurements was performed and ques-tions of demographic nature were recorded. The anthropometric measurements included forty-nine details which have been recorded by domain experts, using standard anthropometric practices [1]. These include the stature, weight, thigh circumference, acromial height, feet length, and so on. The demographic data corresponding to the answers of the participants to questions regarding their family income, number of children, age, etc.
What makes the originality of this survey is that each person was scanned in three dimensions using a full body scanner. Different types of technologies were used but they are all built around the same principles. A few laser scanners move along a rigid frame and capture a full body scan in a few seconds. Within the CAESART M Project, each subject was scanned in three different postures.
The 3-D body scans were described using a global shape-based descriptor, which is an abstract and compact representation of the three-dimensional shape of the corresponding body [1, 2]. In essence, each scan was represented by a set of three histograms, which constitutes a 3-D shape index for the human body. Interested readers are referred to [2] for a detailed description of our cord-based approach. This database thus represents a detailed and accurately measured subset of the typical human morphology, together with a 3-D body scan which maps these measurements and demographic profiling information.
Fig. 1.An example of 3-D human body scans as contained in the CAESART Mdatabase
3
Methodology
This section describes the experimental approach we followed to analyze the CAESART M data. This data resides in an IBM DB2 relational database and
our aim was to utilize this structure when mining the data directly, using multi-view learning.
Initially, the data was grouped into clusters based on the anthropometric body measurements. The aim here was to create clusters that correspond to typical industry-based clothing sizes, such as small, medium, etc. That is, to identify the natural body size groupings within the CAESART M, in which
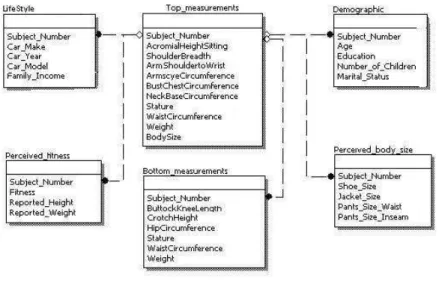
Next, this clustering information was used to determine the class labels, based on the body (or clothing) size. Figure 2 shows the Entity-Relationship (ER) diagram of the CAESART M database. The figure shows that the database
consists of six (6) relational tables, with the BodySize class label as an attribute in the Top measurements table. The database also contains tables describing the demographics of the human subjects, including the financial information, per-ceived fitness and body size, age, education and so on. This relational database was used for multi-view relational classification, as discussed next.
Fig. 2.The Entity Relationship (ER) diagram for the CAESART M database
3.1 Multi-view Relational Classification
Recall that the CAESART M data resides in a commercial IBM DB2 relational
database. Our goal is to directly and transparently mine the data, without flat-tening or propositionalizing the database into a universal relation [5, 6]. Our motivation is as follows. It usually takes considerable time and effort to convert relations into the required flat format. Another drawback is that this process can cause a loss of information [5] and can create a large amount of redundant data. Furthermore, a universal relation with a large amount of entities and at-tributes often leads to efficiency and scaling challenges. We aim to provide the clothing designers and anthropometric domain experts, who are not necessarily data miners, with easy, intuitive access to the CAESART M database. Also, we
envisage that the end results of our research presented here will, in future, be applied to much larger anthropometric databases with complex schemas. To this end, we engaged in multi-view learning, as discussed next.
What is multi-view learning? In the multi-view setting, each view of the data can be expressed in terms of a set of disjoint features of the training data. The target concept is learned independently, i.e. on each of these separate views using the features present. As in the example given by Blum and Mitchell [7], one can classify segments of televised broadcast based either on the video or on the audio information.
When considering a relational database, each relation (or table) thus corre-sponds to a view. One of these tables are considers as the target, while the others act as background relations. Each relation usually has a naturally divided dis-joint feature set. When considering relational data mining, each of the relations therefore has diverse set of attributes, each providing different viewpoint (or ”views”) regarding the target concepts to be learned. This is especially evident when considering the CAESART M database. Here, each relation describes
differ-ent characteristics of a specific person. For example, the Demographic relation contains a person’s demographic information, but the Top-measurements and LifeStylerelations identify a person’s body measurements, income and automo-bile details. In other words, each relation from this database provides different types of information, or views, of the person.
Formally, in a relational classification setting, we have a database DB and a target relation Ttarget which includes a target variable y. The relational
clas-sification task is to find a function F (x) which maps each tuple x of the target table Ttarget to the category y.
y= F (x, DB, Ttar)|x ∈ Ttar
In the above scenario, the Ttar table is considered the target relation while all
others are background relations.
Our multi-view learning approach consists of two stages, firstly, an Informa-tion PropagaInforma-tionstage and, secondly, a Multiple View Learning stage [8]. During Information Propagation, the training data sets of the multiple views are constructed. Here, each background relation obtains the classes from the target relation. Aggregation information, if any, is also propagated. (Note that the CAESART M database denotes a special case, with one-to-one relationships
between tables.) Next, each of the views is used to construct various hypotheses on the target concept, using traditional single-table learning algorithms.
Let us again consider the construction of the view for the Demographics table. During the Information Propagation Stage, both relations Top-measurements and Demographics have the class labels to be learned. Thus, each of them is individually able to construct a target function for the target concept. How-ever, the relation Top-measurements only includes information about a person’s body measurements. Therefore hypothesis produced by this relation will only reflect how those body measurements such as Stature and Weight relate to the class label, namely, BodySize. On the other hand, the Demographics relation only consists of information about a person’s demographic information. Con-sequently, classification model built using this relation will only have the rela-tionship between class BodySize and people’s demographic information, such as Age, Education and Marital Status, etc.
Note that a detailed discussion of our multi-view learning method falls be-yond the scope of this paper. Interested readers are referred to [8] of an overview of our approach.
4
Experimental Results
We implemented the experiments using the WEKA data mining system, a Java-based knowledge learning and analysis environment developed at the University of Waikato in New Zealand [9]. The Cleopatra multimedia information retrieval system was used to verify the quality of the end results, against the 3-D body scans [1]. Recall that the CAESART M database was implemented in IBM DB2.
The original data set consisted of the data of 670 human subjects, each con-taining one 3-D body scan of a person facing the scanner and 15 demographic attributes, together with 49 anthropometric attributes for females and 48 an-thropometric attributes for males. (Note that no under bust circumference of the male subjects was recorded.) The data was separated into two sets based on the gender of the subject, to form two sets of 414 males and 256 females, re-spectively. The results when exploring the data regarding the 414 male subjects are reported here. The subjects we analyzed were all residents of the USA, thus making them a pool of similar genetic and environmental conditions.
Fig. 3.Visualization of Clusters
4.1 Cluster Analysis
Firstly, the anthropometric data was considered in order to identify typical clus-ters within the male population. A number of clustering algorithms was consid-ered. These included partitioning, hierarchical, density-based, model-based and grid-based approaches [3, 4]. We also considered the use of principal component analysis (PCA) to reduce the number of attributes prior to clustering.
In our experiments, the number of initial clusters was set to five (5), since that corresponds to the number of clothing sizes we were interested in identify-ing. By inspection, through the analysis of the results using the Cleopatra and
Weka systems, the k-means classifier algorithm was found to produce the best clusters. Also, it was found that there where no need to apply PCA prior to clus-tering, since the inter-cluster relationships were weak. The k-means algorithm is a Centroid-based partitioning technique, in which each cluster is represented by the mean value of the objects in the cluster and the Centroid is viewed as the cluster’s centre of gravity [3, 4]. This technique is highly suitable for discov-ering similar sized clusters with convex shapes, on numeric attributes. Also, it works well with domain with little noise or outliers. The body measurements were recorded and verified by at least two anthropometric domain experts, thus making the level of noise and occurrence of outliers rare.
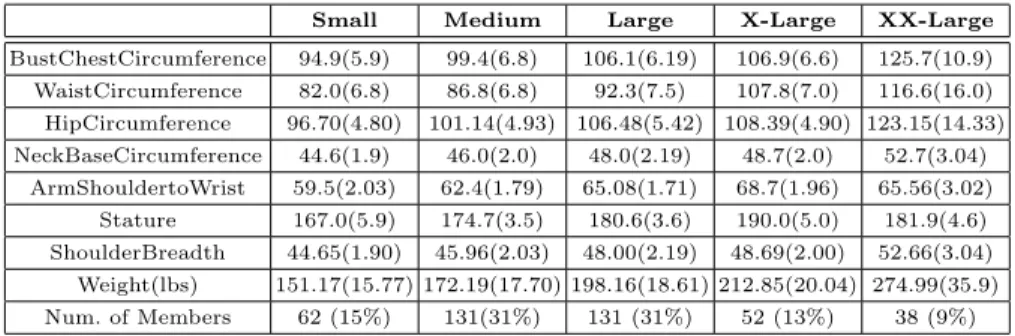
Table 1. Body measurements of cluster Centroids as contained in the CAESART M
database.
Small Medium Large X-Large XX-Large
BustChestCircumference 94.9(5.9) 99.4(6.8) 106.1(6.19) 106.9(6.6) 125.7(10.9) WaistCircumference 82.0(6.8) 86.8(6.8) 92.3(7.5) 107.8(7.0) 116.6(16.0) HipCircumference 96.70(4.80) 101.14(4.93) 106.48(5.42) 108.39(4.90) 123.15(14.33) NeckBaseCircumference 44.6(1.9) 46.0(2.0) 48.0(2.19) 48.7(2.0) 52.7(3.04) ArmShouldertoWrist 59.5(2.03) 62.4(1.79) 65.08(1.71) 68.7(1.96) 65.56(3.02) Stature 167.0(5.9) 174.7(3.5) 180.6(3.6) 190.0(5.0) 181.9(4.6) ShoulderBreadth 44.65(1.90) 45.96(2.03) 48.00(2.19) 48.69(2.00) 52.66(3.04) Weight(lbs) 151.17(15.77) 172.19(17.70) 198.16(18.61) 212.85(20.04) 274.99(35.9) Num. of Members 62 (15%) 131(31%) 131 (31%) 52 (13%) 38 (9%)
For the male population, the Centroids of the clusters are depicted in Table 1. The distribution of the clusters is depicted in Figure 3. As can be seen from Figure 3, the cluster sizes are comparable and the shapes thereof are convex, therefore making k-means a good choice.
We subsequently verified the cluster membership through querying the 3-D body scans using the Cleopatra system. Table 1 shows some of the characteristics of the Centroids of the male population [10]. Shown are the means (in cm) and standard deviations of each of the clusters and the number of cluster members. Figure 4 shows the 3-D body scans of the human subjects that correspond to these anthropometric measurements, highlighting the difference in body types of the five clusters. The clusters as also depicted in Figure 3. From Table 1 and Figures 3 and 4, and our manual inspection, it follows that the anthropometric clusters distinguish between small, medium, large, extra-large and extra-extra-large body sizes.
4.2 Multi-view Relational Classification
Next, we engaged in multi-relational classification, using the five clusters of body size, as class labels. For our multi-relational experiments we used the benchmark-ing C4.5 decision tree algorithm [11], the PART rule learner that constructs de-cision list based on the repeated creation of partial dede-cision trees [12] as well
as the widely used RIPPER propositional rule inductor, which have shown to generate rules that are easy for humans to understand [13, 14].
Fig. 4.Cluster Centroids for Male Population
Table 2.Accuracy and number of rules for three multi-view learning tasks
Learning task Ripper C4.5 PART
Top measurements 78.7% (10) 78.2% (30) 76.6% (18) Bottom measurements 76.3% (11) 78.2% (19) 77.5% (19) Top and Bottom measurements 79.2% (12) 80.1% (30) 78.7% (21)
We proceeded to analyze the data in order to find the rules to describe the body measurements within each class. To this end, we executed our multi-view learning algorithm three times, used the (1) Top measurements, (2) Bot-tom measurements and (3) Top and Bottom measurements relations as target relations.
Table 2 shows the accuracies of the three learners against the three different learning tasks, for C4.5, RIPPER and PART. The table shows that the learning approaches provided consistent results, in terms of accuracy and number of rules constructed. Next, we identified those rules with high positive and little negative coverage. This makes sense from an application point of view, since we aimed to obtain interesting, general rules for application in industry. Table 3 shows some of the most important rules we found for each body size, in terms of the information given and the rule coverage. Shown are the positive and negative coverage, as well as the percentage of subjects within that class which satisfies each rule.
When considering the rule set in Table 3, the following observations are noteworthy. The table shows that, for the extra-extra large size, the rules mainly address the weight and stature. Again, this makes sense from an application point of view. Extra-extra large individuals are often difficult to characterize, due to the nature of their body shape and the difficulty to obtain accurate
Table 3.Some high coverage rules for each clothing/body size Positive
Class Coverage Coverage(%) Learner Learning Top Measurements
(Stature ≤ 170.9) AND Small (44/ 3) 71.0 RIPPER
(BustChestCircumference ≤ 100.2)
(167 < Stature ≤ 176) AND Medium (77/5) 58.8 C4.5 (163 < Weight ≤ 213.5) AND
(ArmShouldertoWrist ≤ 65.0)
(Weight > 179) AND (Stature ≤ 182.5) Large (73/1) 55.7 PART AND (ArmShouldertoWrist > 60.4)
AND (ShoulderBreadth ≤ 54.4)
(Stature > 184.2) AND (Weight < 243) X Large (31/0) 59.6 C4.5 AND (ArmShouldertoWrist > 67.9)
(Weight ≥ 241) XX Large (38/5) 100.0 RIPPER
Learning Bottom Measurements
(Stature ≤ 170.9) AND (Weight ≤ 190) Small (52/3) 83.8 RIPPER (167 < Stature ≤ 176) AND (Weight > 163) Medium (78/6) 59.5 C4.5
AND (HipCircumference ≤ 113.5) AND (ButtockKneeLength ≤ 63.5)
(176<Statute≤182.5) AND (183<Weight≤243) Large (72/5) 55.0 C4.5 AND (CrotchHeight ≤ 87)
(Stature≥184.3) and (WaistCircumference≥93.2) X Large (35/5) 67.3 PART (Stature > 176) AND (Weight > 243) XX Large (29/0) 76.3 C4.5
AND (CrotchHeight ≤ 84.3) Learning Top and Bottom Measurements
(Stature ≤ 171.9) AND (HipCircumference ≤ 98.1) Small (36/1) 58.0 RIPPER (167<Stature≤176) AND (163<Weight≤199.5) Medium (61/0) 46.5 PART
AND (HipCircumference ≤ 113.5) AND (ButtockKneeLength ≤ 63.5)
AND (CrotchHeight > 73)
(183 < Weight ≤ 243) AND Large (94/8) 71.8 C4.5 (62 < ArmShouldertoWrist ≤ 66.9)
AND (CrotchHeight≤87) AND (Stature>176)
(ButtockKneeLength > 61.4) AND X Large (31/5) 59.7 PART (BustChestCircumference ≤ 113)
(Weight ≥ 239) and XX Large (28/0) 73.7 RIPPER
measurements. This fact makes it difficult for tailors to design clothing that fits these individuals well, as mentioned by many of the participants in this study. From the rule set, one can, in addition, conclude that when designing clothes, the attributes to be taken into account are different for each clothing size. For example, for the large clothing size the width of the shoulders and the length of the arms are important factors. Our rules also indicate that Small (or Thin) individuals are usually shorter than the other body sizes. This implies that, for this group, the majority of e.g. pants should have short lengths. Otherwise, a mass market manufacturer may be left with an overflow of pants that cannot sell.
The positive coverages of the rules shown here indicate that they are gen-eral enough to be applied when tailoring clothes. Their number is sufficient to constrain the design without increasing the production costs. Indeed, the later is increased if too many rules or constraints need to be implemented.
Note that we also analyzed the data within each class to better understand the demographic nature of our customer. When considering the typical pro-files of the individuals who correspond to the individual clothing sizes, we were able to pinpoint interrelationships between fitness, family income and education, amongst others. For example, our exploration of the demographic profiles of the medium-sized males indicate that, for this data set, a 25 to 40 aged single male with a high level of fitness who holds a Bachelors degree earns, on average, sub-stantially more than an unfit person with the same background. Also, a married person with a doctorate earns more than his single counterpart, irrespective of his marital status. Due to limited space, interested readers are referred to [15] for a detailed discussion.
5
Analysis of Results
Clothes must fit the population. If they do not, they will not sell. This implies that the different sizes (e.g. small, medium, large) must correspond to real group-ings within the population. Each cluster must be well defined in the sense that one archetype can represent any individual member belonging to the cluster. Clothing designers cannot utilize averages. This is not difficult to understand, if one average many human bodies, one ends up with a blob that has no relation whatsoever with any human being.
Consequently, it is important to define clusters that can be characterized by one archetype, i.e. a representative individual that belongs to the cluster and that represent any other member of the cluster. Usually this archetype corre-sponds to the closest individual to the Centroid of the cluster. Such a working hypothesis is based on the implicit assumption that the cluster has a spherical or quasi spherical symmetry. One can also choose one of the individuals belonging to the sub-region presenting the highest density in terms of number of individ-uals. If it is not the case, more than one archetype might be necessary to fully characterize the cluster. In practice, it is preferred to have only one. Each new
size of sub-size involves more costs and increase the complexity involved in both the manufacturing and the distribution process.
It is also important that each cluster represent a large proportion of the population. If it is not the case, clothes are manufactured for a size that fits virtually nobody which again implies financial lost. Nevertheless, clusters with a small number of members can be justified for very expensive clothes for which a good fit is a paramount condition.
The method we utilised satisfies the above mentioned requirement because we were able to group the individuals into one of five clusters with a well-defined Centroid. Our verification, by means of the Cleopatra system, indicated that the cluster membership do correspond to the reality, in the sense that the bodies did correspond to our expectations of the cluster membership.
Also, we were able to create sets of rules that describe the interrelationships between the different body measurements within each of the five groupings. Im-portantly, the rules indicate which of these measurements need to be taken into account when tailoring clothes. For example, for the medium-sized individuals, the rules indicated that the Stature, Hip Circumference, Buttock to Knee Length and Crotch Height are important when designing pants.
When exploring the clusters as class labels, we used three different classifica-tion methods, which gave us consistent sets of rules, in terms of overall accuracy, as well as coverage. We have discovered some worth-while relationships between this data. For example, it is interesting to note that, when e.g. distinguishing between large and extra large subjects within the male population, the chest and hip circumferences do not differ substantially. Rather, the waist circumfer-ence and stature is of importance here. This reality is not reflected in the ”ideal” clothing sizes and is thus an important factor to consider when designing clothes. One of the most remarkable results that we have obtained is that the attributes that must be considered when designing clothes differ according to clothing size.
6
Conclusion
Tailoring clothes that fit the population poses an important challenge to the clothing industry. The mining of anthropometric body measurements, in order to understand and future explore the body profile of the typical consumer has application in the mass marketplace as well as in haute couture both for the design and the distribution. Such an understanding is fundamental in order to minimize the number of returned items in e.g. Internet shopping.
This paper discussed our results when analyzing a data set containing anthro-pometric body measurements, together with demographic data. We were able to cluster the population into five well-defined clusters. We also generated some general rules with high coverage, for application in industry. Our results showed that the body measurements to be taken into account for the various body sizes differ substantially. That is, each clothing size is characterised by a different set of anthropometric body measurements. We were able to verify the results of our experimentation against a set of corresponding 3-D body scans. Future work will
include the analysis of the 3-D body scans to complement the results presented in this paper. Our preliminary analysis, when clustering the 3-D body scan his-tograms, indicate that clusters, which complement those presented here, can be found [16].
References
1. Paquet, E., Robinette, K.M., Rioux, M.: Management of three-dimensional and an-thropometric databases: Alexandria and cleopatra. Journal of Electronic Imaging 9(4) (2000) 421–431
2. Brunsman, M.A., Daanen, H.M., Robinette, K.M.: Optimal postures and posi-tioning for human body scanning. In: NRC ’97: Proceedings of the International Conference on Recent Advances in 3-D Digital Imaging and Modeling, Washington, DC, USA, IEEE Computer Society (1997) 266
3. Abdali, O., Viktor, H.L., Paquet, E., Rioux, M.: Exploring anthropometric data through cluster analysis. SAE 2004 Transactions Journal of Aerospace 113-1 (2004) 241–244
4. Dunham, M.H.: Data Mining: Introductory and Advanced Topics. Prentice Hall PTR, Upper Saddle River, NJ, USA (2002)
5. Dzeroski, S., Lavrac, N.: editors, Relational Data Mining. Springer, Berlin (2001) 6. Krogel, M.A., Wrobel, S.: Facets of aggregation approaches to propositionalization.
In: Proceedings of the Work-in-Progress Track at the ILP. (2003)
7. Blum, A., Mitchell, T.: Combining labeled and unlabeled data with co-training. In: COLT: Proceedings of the Workshop on Computational Learning Theory, Morgan Kaufmann Publishers. (1998) 92–100
8. Guo, H., Viktor, H.L.: Mining relational databases with multi-view learning. In: MRDM ’05: Proceedings of the 4th international workshop on Multi-relational mining, New York, NY, USA, ACM Press (2005) 15–24
9. Witten, I.H., Frank, E.: Data mining: practical machine learning tools and tech-niques with Java implementations. Morgan Kaufmann Publishers Inc., San Fran-cisco, CA, USA (2000)
10. Viktor, H., Paquet, E.: A multi-strategy approach for mining multimedia data repositories, Data mining 2005. Skiathos: Greece, WIT Press: UK (2005)
11. Quinlan, J.R.: C4.5: programs for machine learning. Morgan Kaufmann Publishers Inc., San Francisco, CA, USA (1993)
12. Frank, E., Witten, I.H.: Generating accurate rule sets without global optimization. In: ICML ’98: Proceedings of the Fifteenth International Conference on Machine Learning, San Francisco, CA, USA (1998) 144–151
13. Furnkranz, J., Widmer, G.: Incremental reduced error pruning. In: Proceedings of the 11th International Conference on Machine Learning (ML-94). (1994) 70–77 14. Cohen, W.W.: Fast effective rule induction. In Prieditis, A., Russell, S., eds.:
Proc. of the 12th International Conference on Machine Learning, Tahoe City, CA, Morgan Kaufmann (1995) 115–123
15. Viktor, H.L., Paquet, E., Guo, H.: Demographic profiling of CAESART M
anthro-pometric data. Technical Report 001-2006, Intelligent Data Lab, School of IT and Engineering, University of Ottawa (2006)
16. Paquet, E., Viktor, H.L.: Anthropometric calibration of virtual mannequins through cluster analysis and content-based retrieval of 3-D body scans. In: Proc. of the 2005 IEEE Instrumentation and Measurement Technology Conference, Ottawa, Canada, IEEE Press (2005)