Publisher’s version / Version de l'éditeur:
Vous avez des questions? Nous pouvons vous aider. Pour communiquer directement avec un auteur, consultez la première page de la revue dans laquelle son article a été publié afin de trouver ses coordonnées. Si vous n’arrivez pas à les repérer, communiquez avec nous à PublicationsArchive-ArchivesPublications@nrc-cnrc.gc.ca.
Questions? Contact the NRC Publications Archive team at
PublicationsArchive-ArchivesPublications@nrc-cnrc.gc.ca. If you wish to email the authors directly, please see the first page of the publication for their contact information.
https://publications-cnrc.canada.ca/fra/droits
L’accès à ce site Web et l’utilisation de son contenu sont assujettis aux conditions présentées dans le site LISEZ CES CONDITIONS ATTENTIVEMENT AVANT D’UTILISER CE SITE WEB.
10th Canadian Conference on Building Science & Technology (10BS&T)
[Proceedings], pp. 127-138, 2005-05-01
READ THESE TERMS AND CONDITIONS CAREFULLY BEFORE USING THIS WEBSITE. https://nrc-publications.canada.ca/eng/copyright
NRC Publications Archive Record / Notice des Archives des publications du CNRC : https://nrc-publications.canada.ca/eng/view/object/?id=02fe1746-e843-4d08-98f2-c5064914ce5f https://publications-cnrc.canada.ca/fra/voir/objet/?id=02fe1746-e843-4d08-98f2-c5064914ce5f
NRC Publications Archive
Archives des publications du CNRC
This publication could be one of several versions: author’s original, accepted manuscript or the publisher’s version. / La version de cette publication peut être l’une des suivantes : la version prépublication de l’auteur, la version acceptée du manuscrit ou la version de l’éditeur.
Access and use of this website and the material on it are subject to the Terms and Conditions set forth at
Assessing the effectiveness of wall-window interface details to manage
rainwater
Assessing the effectiveness of wall-window interface
details to manage rainwater
Lacasse, M.A.; Rousseau, M.Z.; Cornick, S.M.;
Plescia, S.
NRCC-47685
A version of this document is published in / Une version de ce document se trouve dans :
10
thCanadian Conference on Building Science & Technology, Ottawa, ON.,
May 12-13, 2005, pp. 127-138
ASSESSING THE EFFECTIVENESS OF
WALL-WINDOW INTERFACE DETAILS TO
MANAGE RAINWATER
M. A. Lacasse1, M. R. Rousseau1, S. M. Cornick1 and S. Plescia2
1
Institute for Research in Construction, National Research Council Canada, Ottawa, ON
2
Canada Mortgage and Housing Corporation, Ottawa, ON
ABSTRACT
Inadequate detailing and defective installation of windows has accounted for a significant number of premature failures of the building envelope. This has spurred the development of alternative construction details to control water intrusion at the wall-window interface. However, it is not known how effective these construction details may be over the life expectancy of the wall assembly. Laboratory investigations can provide an effective way to obtain reliable, insightful information regarding the effectiveness of specific wall-window interface details on their ability to influence rainwater entry to the wall assembly. A study was undertaken to investigate the effectiveness of such details typically used in wood frame low-rise wall assemblies to manage rainwater. An overview of the experimental approach and test protocol is given and includes a description of the test apparatus and the basis for estimating the effects on specimens subjected to simulated climate loads. The test specimen configuration is described and details of specific window interfaces evaluated in the study are provided. Results on water entry for the different wall-window interface configurations are provided and the effectiveness of different details is discussed.
INTRODUCTION
A key design element for exterior walls is the control of rain penetration. Lack of attention to design principles or failure to implement them in the detailing of wall components may lead to premature deterioration of wall elements as has been evident across Canada in past years [1, 2, 3, 4].
Inadequate detailing and defective installation of windows has accounted for a significant number of premature failures of the building envelope and this has spurred a review of existing standards for assessing the performance of windows and the development of alternative construction details to manage water intrusion at the wall-window interface. For example, Ricketts completed two studies [5, 6] on behalf of CMHC; the results of the initial study [5] indicated that although a wide range of causal factors was found to contribute to leakage activity, the principal paths for water leakage are those associated with the wall-window interface. These could occur either through the wall-window assembly to the adjacent wall assembly or through the window to wall interface with the adjacent wall assembly. A review of the CSA A440 B rating performance [7] indicated that the criteria for water penetration control do not identify leakage associated with these leakage paths, nor is there a requirement for testing of the installed window assembly. Additionally, it was found that the selection of windows and the design of the wall-window interface do not consider local exposure conditions as may be provided by the local topography or other building features such as overhang protection.
Hence, recommendations that followed from this report included [5]:
• Assessment of micro exposure conditions in the specification and selection of windows,
• Design of the wall-window interface, special attention should be focused on the provision for redundancy in water penetration control through the installation of sub-sill drainage.
The second study [6] identified specific limitations of the current mandated approach for water penetration control provided in national model and local building codes that should be addressed. Specifically, it is suggested that there is a need to consider:
• In-service exposure conditions
• Water penetration control at the window to wall interface • Durability of water penetration control performance
Given the nature of these recommendations there was a need to obtain useful benchmarking information on the effectiveness of different construction details at managing water intrusion over the life expectancy of the wall assembly. Such type of information would necessarily benefit building envelope designers, specifiers and expert practionners. As well, considering that the deterioration of building materials within exterior walls can progress significantly before any symptoms become apparent to the owner, one should not rely solely on feedback from in-situ investigations to assess the effectiveness of the window-wall interface details. Laboratory investigations can provide an effective way to obtain reliable, insightful information regarding the effectiveness of specific wall-window interface details to manage rainwater intrusion in the wall assembly [8, 9]. Although laboratory studies are short–term tests that do not directly relate to expected long-term performance, these can be used to determine the response of wall assemblies to specific rain events in a given climatic region for which the recurrence period can be ascertained. Establishing the response of wall assemblies to simulated events for which the period of reoccurrence is known is an indirect means of determining the likely risk of water entry over a given period and for a specific region. These may also provide some measure of the expected risk to water entry and the fault tolerance of different installations methods in extreme conditions. Hence, a study was undertaken to investigate the ability of such details, typically used in wood frame low-rise wall assemblies, to manage rainwater.
An overview of the experimental approach and test protocol is given and includes a description of the test apparatus and the basis for estimating the effects on specimens subjected to simulated climate loads. The test specimen configuration is described and details of specific wall-window interfaces evaluated in the study are provided. Results on water entry for the different wall-window interface configurations are provided.
APPROACH TO EVALUATING WATER MANAGEMENT OF WINDOW INTERFACE DETAILS
The objective of the experimental work consists of comparing the ability of different wall-window details to manage rainwater. Given that there are many different combinations of windows and wall cladding systems (including the flashing details) that could be assessed, consideration was made on establishing specifications to which all test specimens would nominally be fabricated. This included the:
• Overall size of specimen (determined by maximum size permissible in test apparatus) • Size and location of windows
• Type of windows and cladding
• Type of sheathing board and interior finish
Accordingly, the configuration of test specimens was established that nominally permitted comparisons among the different details when subjected to simulated wind-driven rain conditions. Wall specimens were designed to permit side-by-side comparison of two wall-window interfaces details (Figure 1). Hence, each 2440 mm by 2440 mm wall specimen included two large openings of 625-mm by 1250-mm, in each of which was placed a 600 mm by 1200 mm window together with a set of wall-window interface details. These details include those located at the head, the jambs and the sill. Half the specimen included a “best current practice detail”, the other a “variation”, which typically could be an “upgrade” of detailing the interface that may or may not be common but nonetheless presents a research interest. Entry of water around either window opening was collected in troughs located beneath the respective sills. Water was also collected at the window, just beneath the sill level, on the interior side of the specimen.
Thereafter, a choice was made as to which window-wall combinations to evaluate based on regional considerations of current practice and variations thereof. Additional details regarding the test specimen configuration specific to the results reported are provided below.
FIGURE 1 – (LEFT) TYPICAL LAYOUT OF THE WALL SPECIMEN FRAMING FOR INVESTIGATION OF WATER MANAGEMENT RESPONSE OF TWO SIDE-BY-SIDE WALL-WINDOW INTERFACE DETAILS.
WATER COLLECTION TROUGHS ARE LOCATED BENEATH THE WINDOWSILL. (RIGHT) ELEVATION VIEW OF THE EXTERIOR CLADDING OF A COMPLETED SPECIMEN.
The Dynamic Wind and Wall Test Facility (DWTF), previously used to subject similar specimens to simulated wind-driven rain conditions, has been shown to offer a reproducible method for rainwater deposition [8]. A test protocol was developed based on previous work [8], and also took into consideration existing North American water penetration test standards such as ASTM E331 [10] and CSA A440.4 [11]. The protocol established parameters for spray rate (water deposition rate) on the cladding and pressure difference across the assembly [12]. Specimens were thus subjected to simulated wind-driven rain conditions for specified periods of time; these conditions mimicked specific rain events. Rates of water entry at the sill and behind the cladding were determined by monitoring the rate of water collected from these locations as well as that which entered the window at the interface between the lite and frame. The use of the facility together with the test protocol permitted comparisons of water entry results among the different wall-window interface details. Both the apparatus and protocol are briefly described in the sections that follow.
Description of Test Apparatus
-
Dynamic Wind and Wall Test Facility (DWTF)The facility used to conduct the tests was the Dynamic Wind and Wall Test Facility (DWTF) [8]. This facility, depicted in Figure 2, is capable of subjecting full-scale test specimens (nominal size 2.44 by 2.44-m) to static or dynamic pressure fluctuations of over 2 kPa and spray rates of up to 8 L/min-m2. Dynamic pressure fluctuations are obtained by the displacement of a sealed 2.44-m diameter piston that causes the volume of the space between it and the test specimen assembly to increase or decrease, thus varying the air pressure difference across the specimen. The movement of the piston can be programmed to produce sinusoidal, triangular or square waveforms of air pressure at frequencies ranging from 0.1 to 10Hz and amplitudes exceeding 2 kPa. A secondary blower generates a steady-state component of air pressure and provides a means to assess the air leakage characteristics of the specimens.
The apparatus also contains a pressure regulated water spray system that simulates the action of rain deposition on the cladding surface. Different water deposition rates (hereafter referred to as spray rates) are achieved by regulating the pressure level along specific lines of spray nozzles. Water spray rates can be regulated between 0.8 and 8 L/min-m2. Water can be applied to the front face of the specimen in either full-spray format in which water is deposited evenly across the front of the specimen, or by cascading water from the top of the specimen in a continuous sheet of water.
2.44
-m
2.44-m
Water collection troughs 625-mm
by 1250-mm
FIGURE 2 – INSIDE VIEW OF APPARATUS SHOWING A TEST SPECIMEN (SIZES UP TO 2.44 BY 2.44-M). THE EXTERIOR CLADDING FACES THE INSIDE OF THE APPARATUS
Summary of Test Protocol
The test protocol was adapted from the MEWS protocol described in Lacasse et al. [8] and was completed in three stages, each of which is summarised below:
TABLE 1 – SUMMARY OF TEST PROTOCOL
Stg Description Purpose
1. Characterization of air leakage and pressure equalisation potential of the wall assembly.
To determine the air leakage characteristics of the specimen installed in the test apparatus. All specimens should be tested at or near the same air leakage rate. Gathering information on pressure distribution across the wall at or near water collection points is also useful.
2.
Water penetration without deficiency in static mode at spray rates varying from 0.8 to 3.4 L/min.-m2 with pressure variations from 0 to 700 Pa and nominal air barrier system (ABS) leakage of 0.3 and 0.8 L/s-m2
To test the proposed wall-window interface details to failure (or maximum reasonable test conditions). Specimens are assumed to be in unflawed condition (i.e. tested as designed without deficiencies) and are supposed to function as intended. Water penetration through small unintentional openings, consistent with specimens built of unflawed conditions, tends to be more sensitive to variations in pressure. Consequently the focus in this stage is on the variation of pressure with high rates of water spray.
3.
Water entry with deficiency in static mode at spray rates varying from 0.8 to 3.4 L/min.-m2 and pressure variations from 0 to 700 Pa and nominal ABS leakage of 0.3 and 0.8 L/s-m2
To test the ability of the wall-window interface details to manage water given a deficiency. Deficiencies, purposely introduced in the specimens, will consist of openings such as missing caulking (sealant) or key elements that help maintain the watertightness of the cladding (e.g. between siding boards or other cladding elements that promote
watertightness). The ability of the detail to manage water is evaluated for a less than ideal construction and determines the fault tolerance of the interface detail. In this situation, the sensitivity of water penetration through relatively large deficiencies to the rate of water impinging on the façade will be evaluated. Water entry through larger openings appears to be more sensitive to variations in spray rate than pressure differential. Pressure differentials across the assembly are restricted to 300 Pa.
Water was applied in a cascade over the specimen from its uppermost extremity thus ensuring a uniform water deposition load over the exterior face of the specimen. The range of values used for both spray rate
and air pressure difference exceeds the average values that might be expected on a low-rise building in Canada [12]. However, windows may be subjected to 500 Pa pressure difference in extreme cases (e.g. St. John’s, NF) and testing at these level permits assessing the threshold at which components no longer function adequately. As well, testing at different levels of simulated wind-driven rain may provide a basis from which performance expectations at lower levels can be extrapolated.
Air barrier system (ABS) leakage was regulated by introducing a series of openings at the interface between the window frame and the ABS. The desired nominal leakage through the ABS was achieved by applying and lengthening the openings along the interface as was necessary to obtain two nominal leakage levels of 0.3 and 0.8 L/s-m2. The nominal values for air leakage are those achieved at 75 Pa and derived from air leakage tests over which pressure differences across the specimens ranged from 50 to 700 Pa. The water management ability of the specimens and wall-window detailing was investigated in two sets of conditions, as described above in Stages 2 and 3 of the test protocol. The specimens in Stage 2 are evaluated in what are assumed to be unflawed condition, as built in the laboratory. These specimens necessarily include unintentional deficiencies. Thereafter in Stage 3, deficiencies are introduced in the first line of defence against water entry; e.g., a length of sealant at the wall-window interface or in the cladding assembly above the window is removed to simulate the effect of aging or cracking of the seal. This provides a path for water entry behind the siding and permits evaluating the ability of the second line of defence at the wall-window interface detail to collect and evacuate water to the exterior of the assembly.
Description of Test Specimens
The fixed PVC windows used in this study were 600 mm wide by 1200 mm high (Figure 1). The selection of this specific width permitted accommodating two “window plugs” in the wall specimen, a requirement for side-by-side comparison. The window height of 1200 mm allowed for about 600 mm of opaque wall above the window, thus permitting water to run off over the window head.
The windows were selected on the basis of regional variations regarding window framing features that might affect the detailing of the wall-window interface for water management. The two types of fixed PVC windows were used in the project:
• Non-finned (“box”) window frame, fabricated in Canada; • Fixing flange integral to the frame, fabricated in Canada.
The composition of the walls was intended to be representative of low-rise residential construction with the exception of changes for clear sheathing materials. As such, the specimen consisted of: 38 by 138 mm (nominal 2” by 6”) wood studs, transparent acrylic sheet on the inside as the principal element of the air barrier system (ABS), an acrylic sheet on the exterior of the framing acting as the sheathing board, spun-bonded polyolefin membrane serving as sheathing membrane and an exterior horizontal hardboard siding installed on vertical furring strips for one set of test runs and directly against the back-up wall for a second set. Clear acrylic sheets were used instead of common building materials given that their transparency provided a means to trace water entry from behind the sheathing board. The expectation was that the location and timing of water ingress could readily be observed using this technique.
Selection of Wall-Window Detailing
A team of Canadian building envelope specialists provided input into what is currently best practice and typical practices of detailing the wall-window interface of wood-frame buildings in their respective geographical region of practice, that is the West Coast, the Prairies (i.e. Alberta, Saskatchewan, Manitoba) and Quebec. This exercise highlighted significant differences in regional practices across Canada for detailing the wall-window interface and wall assembly that are given below. These differences can be related to climate severity as well as traditional practice.
• On the West Coast flanged windows are predominantly used and the cladding (particularly traditional stucco) tends to be installed over a 10 to 19 mm air space created by the installation of
vertical furring strips. Best practices include installing a water-resistant membrane over the rough framing of the opening and a waterproof membrane on the subsill, which is intended to drain into the air space behind the cladding. Thermal insulation is usually not placed in the 12-15 mm (1/2 to 5/8 in.) air space between the window frame and the rough opening.
• In the Prairies, flanged windows are also predominantly used and the cladding is typically installed directly against the backup wall. Typically no attempt is made to drain the subsill or protect the rough opening materials against water absorption. Best current practice includes the addition of water-resistant membranes over the materials of the rough opening.
• In Quebec, box frame windows are common and the trend is to install the cladding over an air space. The gap between the window frame and the rough opening is usually filled with thermal insulation. Best current practice includes the installation of a water-resistant membrane on the material making up the rough opening and a waterproof membrane on the subsill. The subsill is intended to drain into the air space behind the cladding. The focus of the study in this instance was on the advantage of “upgrading” this practice with additional features, to provide an additional degree of redundancy.
Of the different types of details evaluated in this study, focus in this paper is made on the specifications for and test results derived from the initial test assembly, configured according to Quebec regional practice.
Wall-Window Detailing for Quebec Regional Practice
The effect of certain design features on the water management at the wall-window interface was investigated and included:
• Levels of drainage in place at the sill of the rough opening (for box and flanged window frame installations);
• Levels of redundancy in the seals installed at the wall-window interface (for box frame window installation).
The reference assembly representative of the Quebec region, is a pair of box frame window installed in a wall with a clear drained cavity of 19 mm depth behind the cladding. Figure 3 shows the wall-window details for the “Best Current Practice” half of the test specimen and Figure 4, the “Variation” half of the test specimen (Side ”V”). The difference between the two details is an additional seal joining the window frame to the sheathing board, at the jamb and head of the rough opening for the “Variation” half of the test specimen. This creates an additional level of redundancy in the event that the external seal becomes deficient during its service life.
FIGURE 4 – VARIATION ON BEST CURRENT PRACTICE – HORIZONTAL SECTION
Deficiencies Incorporated in the Cladding
The deficiencies incorporated at the interface between the exterior wall and the window frame are 90-mm missing lengths of sealant and backer rod located at the lower and outer corner of the window frame, at the exterior face of the cladding, as shown in Figure 5. The deficiencies extend from the outer corner towards the center of the window frame. In Figure 5, “B” refers to “Best Current Practice” and “V” to the “Variation” on current practice. The “Variation” side of the specimen, shown in Figure 4, includes an additional sealant and backer rod at the head and jamb (not the sill); this set remained in place and was not removed when deficiencies were incorporated in the perimeter seal at the interface.
The right hand portion of Figure 5 provides a vertical sectional schematic of the wall assembly showing the location of water collection troughs beneath the windowsill (1) and at the window (2) on the interior side of the test specimen.
FIGURE 5 – SCHEMATIC (LEFT) OF FRONT ELEVATION OF 2.44-M BY 2.44-M SPECIMEN (CLADDING SIDE) SHOWING LOCATION OF 90-MM DEFICIENCIES (MISSING SEALANT AND BACKER ROD AT THE FACE OF THE SPECIMEN). (RIGHT) A VERTICAL SECTIONAL SCHEMATIC OF THE WALL ASSEMBLY SHOWING THE LOCATION OF WATER COLLECTION TROUGHS (1) BENEATH THE WINDOWSILL AND (2) AT THE WINDOW ON THE INTERIOR SIDE OF THE TEST SPECIMEN.
(1) Collection trough beneath window (2) Collection trough at window Deficiency 90-mm 90-mm
NOMINAL RESULTS FROM SELECTED TESTS
A nominal set of test results has been selected from those derived of tests on interface details representative of Quebec Regional practice. These provide information on water entry for Stage 3 of the test protocol at deficiencies incorporated in the cladding at the wall-window interface as well as the air barrier system (ABS), as described in the previous section and illustrated in Figure 5. Results from Stages 1 and 2 of the test protocol and those obtained from testing other deficiencies of Stage 3 will be provided in subsequent publications, as will the results of tests on wall-window interface details representative of regional practices across Canada.
Window Response - No Applied Pressure Differential
A characteristic of the comportment of these interface details derived from the results is that water enters when no pressure is applied across the assembly; gravity alone produces water entry, as shown in Tables 2 and 3. Values of water collection in these conditions vary between 0 and 110 mL/min., hence under certain conditions, a considerable amount of water may be collected. There does not appear to be corresponding increases in rates of collection at the window subsill with increases in spray rate; however, the greatest collection rate when no pressure is applied across the assembly is nonetheless achieved at the highest spray rate, i.e. Table 3 - at a spray rate of 3.4 L/min.-m2,68 and 110 mL/min. for Sides “V” and “B” respectively.
TABLE 2 – WATER COLLECTION RATES IN ML/MIN. AT WINDOWSILL FOR INTERFACE DETAILS “B” AND “V” AT AN ABS LEAKAGE OF 0.3 L/S-M2, IN RELATION TO NOMINAL SPRAY RATE AND
PRESSURE DIFFERENCE Nominal spray rate
0.8 L/min.-m2
Nominal spray rate 1.6 L/min.-m2
Nominal spray rate 3.4 L/min.-m2 Nominal pressure across specimen Pa Side “V” Collection rate mL/min. Side “B” Collection rate mL/min. Side “V” Collection rate mL/min. Side “B” Collection rate mL/min. Side “V” Collection rate mL/min. Side “B” Collection rate mL/min. 0 6 33 31 0 5 0 75 4 37 55 54 13 28 150 5 49 54 86 36 57 200 5 52 n/a n/a 51 89 300 15 51 63 140 70 119 500 19 59 63 177 102 136 700 13 46 63 182 96 188
TABLE 3 – WATER COLLECTION RATES IN ML/MIN. AT WINDOWSILL FOR INTERFACE DETAILS “B” AND “V” AT AN ABS LEAKAGE OF 0.8 L/S-M2, IN RELATION TO NOMINAL SPRAY RATE AND
PRESSURE DIFFERENCE Nominal spray rate
0.8 L/min.-m2
Nominal spray rate 1.6 L/min.-m2
Nominal spray rate 3.4 L/min.-m2 Nominal pressure across specimen Pa Side “V” Collection rate mL/min. Side “B” Collection rate mL/min. Side “V” Collection rate mL/min. Side “B” Collection rate mL/min. Side “V” Collection rate mL/min. Side “B” Collection rate mL/min. 0 5 52 30 0 68 110 75 10 56 75 43 70 185 150 12 62 89 82 98 246 200 15 40 84 109 110 263 300 26 59 117 230 119 301
Wall-Window Response – Variations to Increases in Spray Rate
Water collection rates at the windowsill in general intensify with increases in spray rate. This effect is more pronounced at higher pressures, above 200 Pa pressure difference, for both levels of nominal ABS leakage of the system. For example, at 300 Pa pressure difference and an ABS leakage of 0.3 L/s-m2, water is collected from the windowsill of Side “V” at rates of 15, 63 and 70 mL/min. for respective increases in spray rate of 0.8, 1.6 and 3.4 L/min.-m2. Likewise, at an ABS leakage of 0.8 L/s-m2 and the same pressure difference, water was collected for respective increases in spray rate of 0.8, 1.6 and 3.4 L/min.-m2 at 26, 117, and 119 mL/min. Similar trends at the same pressure differential are evident for side “B” for which rates of collection of 51, 140 and 119 mL/min. at an ABS leakage of 0.3 L/s-m2,and 59, 230, and 301 mL/min. at an ABS leakage of 0.8 L/s-m2 for respective increases in spray rate of 0.8, 1.6 and 3.4 L/min.-m2. Below 200 Pa pressure difference, this effect is generally evident when the specimen has a higher level of ABS leakage. At the lower ABS leakage of 0.3 L/s-m2, an increase in spray rate from 1.6 to 3.4 L/min.-m2 yields a decrease in water collection rate on side “V” from 55 to 13 mL/min. at 75 Pa, and from 54 to 36 mL/min. at 150 Pa pressure difference across the assembly; similar results at the lower ABS leakage rate and designated pressure levels were obtained for the “B side”. It is not immediately apparent why these anomalies occurred although the degree of wetting of interstitial surfaces over the course of a test may affect the path of water flow and hence the amount of water collected over the course of a test period. This information is not readily derived from the test set-up.
Wall-Window Response – Significance of Air Leakage
The effect of degree of ABS leakage on water entry and rates of collection is also apparent. Rates of collection are more pronounced for specimens configured with greater ABS leakage (0.8 L/s-m2) as compared to those that are tighter (0.3 L/s-m2). For example, at a 300 Pa pressure difference and spray rates of 0.8, 1.6 and 3.4 L/min.-m2, respective rates of water collection for Side “V” at an ABS leakage of 0.8 L/s-m2 are 26, 117, and 119 mL/min. as compared to respectively lower values of 15, 63, and 70 mL/min. at an ABS leakage of 0.3 L/s-m2. A similar set of results is obtained for Side “B”: at an ABS leakage of 0.8 L/s-m2 collection rates of 59, 230, and 301 mL/min. as compared to values of 51, 140, and 119 mL/min. respectively at an ABS leakage of 0.3 L/s-m2. Hence this suggests that the degree of air tightness of the assembly affects water ingress at the interface and furthermore, enhanced air tightness reduces the likelihood of water entry. This is to be expected given that a reduction in air leakage at the plane of maximum air tightness in turn reduces pressure differences across other planes of air tightness in the assembly.
Wall-Window Response – Air Pressure Difference Across Assembly
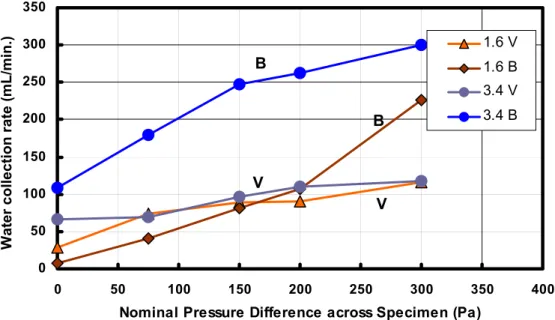
The results also reveal that rates of water collection in general increase in relation to increases in pressure difference across the assembly. For example in Figure 6, rates of collection (mL/min.) from the windowsill of interface details for Sides “B” and “V” are provided as a function of the nominal pressure difference across the specimen at a spray rate of 3.4 L/min.-m2. The upward trend in rates in relation to increases in pressure difference is evident from these plots. The trend occurs irrespective of the degree of ABS leakage although a lower degree of ABS leakage provides a less significant effect as compared to higher ABS leakage. This is in keeping with the previous observation that suggested reduced rates of collection were likely for tighter (less ABS leakage) specimens.
Similar results are obtained at different spray rates as shown in Figure 7, in which a comparison is made of water collection from the windowsill of details for Sides “B” and “V”. Rates of water collection are shown to increase in relation to changes in pressure difference across the specimen for specimens subjected to spray rates of 1.6 and 3.4 L/min.-m2 and having an ABS leakage of 0.8 L/s-m2.
FIGURE 6 – WATER COLLECTION FROM WINDOWSILL OF DETAILS FOR SIDES “B” AND “V” AS A FUNCTION OF NOMINAL PRESSURE DIFFERENCE ACROSS THE SPECIMEN FOR SPECIMENS HAVING
AN ABS LEAKAGE OF 0.3 AND 0.8 L/S-M2 AND SUBJECTED TO SPRAY RATES OF 3.4 L/MIN.-M2.
FIGURE 7 – WATER COLLECTION FROM WINDOWSILL OF DETAILS FOR SIDES “B” AND “V” AS A FUNCTION OF NOMINAL PRESSURE DIFFERENCE ACROSS THE SPECIMEN FOR SPECIMENS SUBJECTED TO SPRAY RATES OF 1.6 AND 3.4 L/MIN.-M2 AND HAVING AN ABS LEAKAGE OF 0.8 L/S-M.
Wall-Window Response – Comparison of “Best Current Practice” to “Variation”
The results also indicate that the comportment of different details in regard to water collection can readily be differentiated provided adequate test conditions prevail. For example in Figure 6, rates of collection at the higher ABS leakage (0.8 L/s-m2) show the response of side “B” (0.8-B: “Best” current practice) as compared to “V” (0.8-V: “Variation” on current practice) as a function of pressure difference. Side ”B” at this level of ABS leakage offers a lower degree of watertightness, more water entry, in relation to “V”
0 50 100 150 200 250 300 350 0 50 100 150 200 250 300 350 400
Nominal Pressure Difference across Specimen (Pa)
W a te r c o lle c tion ra te (mL/min.) 1.6 V 1.6 B 3.4 V 3.4 B B V B V 0 50 100 150 200 250 300 350 0 100 200 300 400 500 600
Nominal Pressure Difference across Specimen (Pa)
Wa te r c o lle c tion ra te (mL/min.) 0.3 - V 0.3 - B 0.8 - V 0.8 - B V B V B
given that there is a more significant increase in rate of collection for “B” as compared to “V”. Hence the results indicate that the addition of an extra seal and backer rod (Side “V”) at interface between the window frame head and jambs reduces the likelihood of water entry. This same trend is evident when the test is carried out with a specimen configured at a lower ABS leakage (i.e. 0.3 L/s-m2); side “B” (0.3-B) provides a lower degree of watertightness. In both these instances, results were reported from specimens subjected to the highest spray rate (i.e. 3.4 L./min.-m2); at a lower spray rate of 1.6 L./min.-m2 and lower pressure differences, as shown in Figure 7 (1.6-V; 1.6-B), differentiating the results may not be as straightforward.
Response of Windows
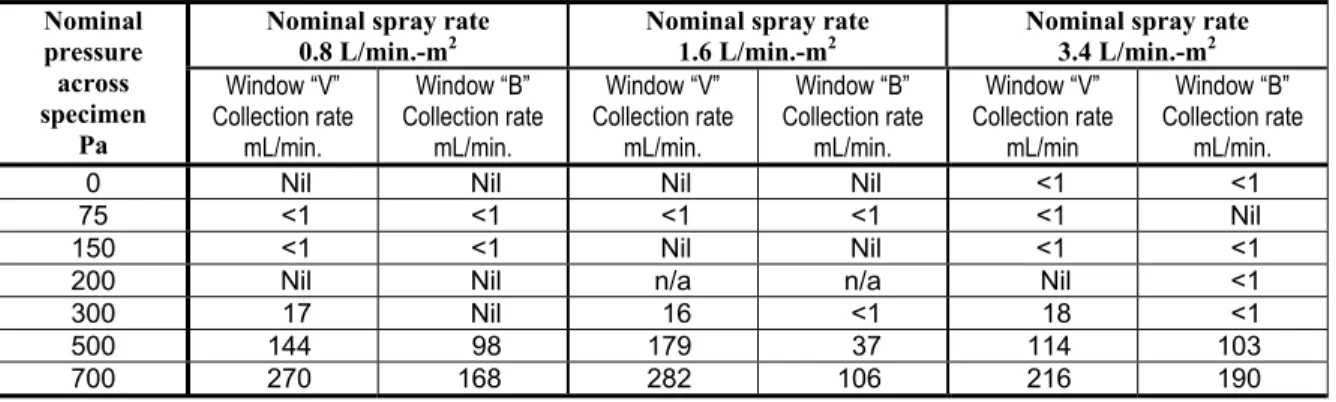
Finally, the results also provide a means of identifying the performance level at which windows may no longer perform in regards to resisting water entry. As shown in Table 4, water was collected at the window at the 300 and 500 Pa pressure levels. As well, water was collected in all instances at the 500 Pa level and only in some instances at the 300 Pa level. Hence, the level of performance evidently lies between these two pressures likely closer to the 300 Pa level.
TABLE 4 – WATER COLLECTION RATES IN ML/MIN. AT WINDOW FOR INTERFACE DETAILS “B” AND “V” AT AN ABS LEAKAGE OF 0.3 L/S-M2, IN RELATION TO NOMINAL SPRAY RATE
AND PRESSURE DIFFERENCE. Nominal spray rate
0.8 L/min.-m2
Nominal spray rate 1.6 L/min.-m2
Nominal spray rate 3.4 L/min.-m2 Nominal pressure across specimen Pa Window “V” Collection rate mL/min. Window “B” Collection rate mL/min. Window “V” Collection rate mL/min. Window “B” Collection rate mL/min. Window “V” Collection rate mL/min Window “B” Collection rate mL/min.
0 Nil Nil Nil Nil <1 <1
75 <1 <1 <1 <1 <1 Nil
150 <1 <1 Nil Nil <1 <1
200 Nil Nil n/a n/a Nil <1 300 17 Nil 16 <1 18 <1
500 144 98 179 37 114 103
700 270 168 282 106 216 190
SUMMARY
A study was undertaken to investigate the effectiveness of wall-window interface details to manage rainwater. The window interface details described were those typically used in wood frame low-rise wall assemblies that incorporate a box window (non-flanged). The experimental approach consisted of evaluating the water entry and management performance of two sets of details in “side-by-side” comparisons when subjected to simulated wind-driven rain conditions. The test apparatus subjected the specimens to water deposition rates varying between 0.8 and 3.4 L./min.-m2 and pressure differences across the assembly ranging between 75 and 700 Pa. Tests were also conducted under no pressure difference to assess the significance of gravity alone to cause water entry. Rates of water entry were monitored in relation to given spray rates, air pressure differences and air leakage rates acting across the assembly. Water entering openings and deficiencies in the cladding was collected in troughs located beneath the sill and water passing through the window was also collected. Water entry was determined under different test scenarios that included wall assemblies in “as built” conditions as well as assemblies incorporating deficiencies at the interface between the window and wall. Results on water entry through a deficiency at the wall-window interface for configurations representative of Quebec practice provided the following information:
• Significant amounts of water entered deficiencies when subjected to spray and no pressure differential; gravity alone may produce water entry.
• Collection rates for water accumulating beneath the sill increased in relation to greater spray rates. • Water collection rates are generally greater for walls having greater ABS leakage as compared to
• Rates of water collection at the interface details increased in relation to pressure differences across the assembly.
• The performance of different interface details in regard to water entry can be discerned on the basis of results from water collection at the interface and window.
ACKNOWLEDGEMENTS
Mr. Stacey Nunes is gratefully acknowledged for having undertaken the testing of specimens and related operations to ensure adequate data retrieval and analysis. Thanks are also extended to Ms. Marianne Manning and Mr. Chris Short for having supported completion of the post-processing of data. As well, we offer our sincere appreciation of the work completed by Mr. Michael Nicholls to fabricate specimens.
REFERENCES
1. Scott, D.L. (1984), “Rain Leakage in Wood Frame Walls: Two Case Histories”, Building Research Note No. 210, National Research Council of Canada.
2. Blackall, T.N. and Baker, M.C. (1984), “Rain Leakage of Residential Windows in the Lower Mainland of British Columbia”, Building Practice Note, Division of Building Research, National
Research Council of Canada, BPN-42, pp. 8, November.
3. Morrison Hershfield Limited (1996), “Survey of Building Envelope Failures in the Coastal Climate of British Columbia”, Canada Mortgage and Housing Corporation, 43 p.
4. Building Envelope Engineering (1999), “Wall Moisture Problems in Alberta Dwellings”, Canada Mortgage and Housing Corporation, 60 p.
5. Ricketts, D. R. (2002), "Water Penetration Resistance of Windows: Study of Manufacturing, Building Design, Installation and Maintenance Factors”, Study 1, Canada Mortgage and Housing
Corporation, Ottawa, December, 86 p.
6. Ricketts, D. R. (2002), "Water Penetration Resistance of Windows: Study of Codes, Standards, Testing and Certification”, Study 2, Canada Mortgage and Housing Corporation, Ottawa, December, 91 p.
7. CAN/CSA A440 (2000), Windows, Canadian Standards Association, Mississauga, ON, 249 p. 8. Lacasse, M. A., O’Connor, T. J., Nunes, S. and Beaulieu, P. (2003), “Report from Task 6 of MEWS
Project Experimental Assessment of Water Penetration and Entry into Wood-Frame Wall Specimens, Final Report”, Research Report 133, Institute for Research in Construction, National Research Council Canada, 133 p., February (IRC-RR-133).
9. Lacasse, M. A. (2003), "Durability and Performance of Building Envelopes," BSI 2003 Proceedings (15 Cities across Canada, 10/7/2003), pp. 1-6, October (NRCC-46888).
10. E331-00 (2005), Standard Test Method for Water Penetration of Exterior Windows, Skylights, Doors, and Curtain Walls by Uniform Static Air Pressure Difference, ASTM International, West
Conshohocken, PA, USA, 4 p.
11. CAN/CSA A440.4 (1998), Window and Door Installation, Canadian Standards Association, Mississauga, ON.
12. S. M. Cornick and M. A. Lacasse (2005), “A Review of Climate Loads Relevant to Assessing the Watertightness Performance of Walls, Windows and Wall-Window Interfaces,” to be published
in: Performance and Durability of the Wall-Window Interface, ASTM STP, B. G. Hardman, C. R.