MIT LIBRARIES
Digitized
by
the
Internet
Archive
in
2011
with
funding
from
Boston
Library
Consortium
Member
Libraries
b
531
1415
.cz-Massachusetts
Institute
of
Technology
Department
of
Economics
Working
Paper
Series
ASSET
ALLOCATION
AND
ASSET
LOCATION:
HOUSEHOLD
EVIDENCE
FROM
THE
SURVEY
OF
CONSUMER
FINANCES
Daniel
Bergstresser
James
Poterba
Working
Paper
02-34
September
2002
Room
E52-251
50
Memorial
Drive
Cambridge,
MA
02142
This
paper can be
downloaded
withoutcharge from
the SocialScience
Research Network Paper
Collection atMASSACHUSETTS
INSTITUTE OFTECHNOLOGY
ASSET
ALLOCATION
AND
ASSET
LOCATION:
HOUSEHOLD
EVIDENCE
FROM
THE
SURVEY OF
CONSUMER
FINANCES
DanielBergstresser Harvard Business School
James
PoterbaMIT
andNBER
March
2001 RevisedSeptember
2002
ABSTRACT
The
rapidgrowth ofassetsinself-directedtax-deferredretirementaccounts has generatedanew
setoffinancialdecisionsfor
many
households. Inadditiontodecidingwhich
assets tohold,households withsubstantial assets inbothtaxable
and
tax-deferredaccountsmust
decidewhere
tohold them. Thispaperuses data
from
the SurveyofConsumer
Financestoassesshow
many
householdshaveenough
assets inbothtaxable
and
tax-deferredaccountstofacesignificantassetlocation choices. Italso investigates theassetlocationdecisions thesehouseholdsmake. In 1998,45 percentof households
had
at leastsome
assets ina tax-deferred account,and
more
thantenmillionhouseholdshad
atleast$25,000inbothataxable
and
a tax-deferred account.Many
householdsholdequities in theirtax-deferredaccounts,but notintheirtaxableaccounts,whilealsoholdingtaxable
bonds
in theirtaxable accounts.Most
ofthesehouseholds could reducetheirtaxes
by
relocatingheavily-taxed fixedincome
assets to theirtax-deferred account. Assetallocationinsideand
outside tax-deferred accountsisquite similar,with about seventy percentofassetsineachlocationinvestedinequitysecurities. Fornearly three quartersofthehouseholdsthatholdapparently tax-inefficientportfolios, ashiftoflessthan$10,000in financial assetscan
move
theirportfolio toatax-efficient allocation. Assetlocationdecisionswithin
IRAs
appeartobesensitive tomarginaltax rates;
we
do
not findevidenceforsuch sensitivity inother tax-deferred accounts.We
aregrateful toBrad
Barber,David
Bradford, JoelDickson,Roger
Gordon,Andrew
Samwick, and
John
Shoven
forhelpfulconversations,toAmir
Sufi forassistancewiththe SurveyofConsumer
Finances,andtothe
Hoover
Institution,theNationalInstituteof Aging,and
theNationalScience Foundationforresearch support.Households
have always facedtheassetallocationproblem,havingtodecidewhich
assetstopurchase
and
how much
toinvest ineach of them.But
withtherecentgrowth
ofself-directed retirementplanassets,
many
householdsnow
alsofaceanasset locationproblem. This isthequestionofhow much
of
agivenassettoholdinataxableaccount,and
how much
ofittoholdina tax-deferredaccount. Assetsinparticipant-directedtax-deferredaccountstotalednearlyfivetrilliondollars atthe
end
of 2001, with$2.4trillioninIndividualRetirementAccounts,
and
$2.3 trillionin401(k)-typeplans.At
theend
of1990,
by
comparison,therewere $637
billion inIRAs,
and $735
billion indefinedcontributionplans.The
recentgrowth
of IRAs,401(k)'s,and
other self-directed tax-deferred retirement vehicles hasdrawn
substantial interesttotheinvestmentdecisionsmade
by
households withthese accounts. Assetlocationhas
begun
to attractattentionfrom
researchers inpublicfinanceand
financial economics,and
itisafrequent topicofdiscussion
among
financialplanners.Shoven
(1998)outlined the structureoftheasset locationproblem,
and
observedthattaxminimizationwould
usuallydictateholdingheavily-taxedtaxable
bonds
inthetax-deferredaccount,withless-heavilytaxedequitiesinthetaxable account.Recent
work
by
Dammon,
Spatt,and
Zhang
(2002),Huang
(2001), Poterba, Shoven,and
Sialm(2001),and
Shoven and
Sialm (forthcoming) hasoffered further insighton
theoptimalassetmix
forhouseholdsfacingvarioustax
and
financialcircumstances.Absent
liquidityor other considerations,households should holdrelativelyheavily taxedassets intheirtax-deferredaccount.
Whether
thisimpliesthattaxablebonds
should be heldinthetax-deferredaccount
depends
on
thesetofassetsavailabletothehousehold. For example,Shoven and
Sialm(forthcoming) considerthe assetlocationdecisionfor investors
who
can only holdequitiesintheform
ofrelativelytaxinefficientvehicles,suchashigh-turnoveractively-managedmutualfunds. Ifthese
investorshave accesstotax-exempt bonds, thentheiroptimal assetlocation
may
involve equitymutualfundsinthe tax-deferred account,
and
tax-exemptbonds
inthetaxableaccount.Most
oftherecentresearchon
assetlocationhas focusedon
the derivationof tax-minimizingportfoliostrategies,ratherthan
on
theanalysisofhousehold
portfoliochoices.Three
studies have(1997),is based
on
asurveyof
TIAA-CREF
participants. It findsthat investorschoosesimilar assetallocationsintheirtaxable
and
tax-deferredaccounts,with littleapparent regardforthebenefits oftax-efficientassetlocation.
One
open
issue concerningthisresearchconcernsthe extenttowhich
thebehavior of
TIAA-CREF
participantscan begeneralizedtothepopulationatlarge.A
second
study,Barberand
Odean
(forthcoming), isbasedon
datadrawn from
brokerage firmrecords.
The
datasuggestthathouseholds holdequitymutual fundsand
taxablebonds
intheirtax-deferred accounts,while theyholdindividual equitiesin theirtaxableaccount.
Because
individual equityholdings tendtobelessheavily taxed than
bonds
orequitymutual
funds,this assetlocation patternisbroadlyconsistentwith tax-minimizingbehavior.
However,
householdsaremore
likelytotrade stocks intheirtaxablethanin theirtax-deferredaccount,
even
thoughtradingin the tax-deferredaccountwould
notgenerate currentcapitalgains taxliability.
A
key
concern withthisstudyisthedegreetowhich
dataon
assetsheldthrougha singlebrokerage firmdepict ahousehold's broader balancesheet,
and
inparticularwhether
householdsmay
have
offsettingpositionsatother financialinstitutions.Finally,athirdstudy,
Amromin
(2002),usesdatafrom
theSurvey of
Consumer
Financestoinvestigate
whether
precautionarydemands
forfinancial assets,coupled withpenaltiesand
restrictionson
withdrawing
assetsfrom
tax-deferred accounts, canexplain deviationsfrom
tax-efficientassetlocationpatterns.
The
paperalsoprovidessummary
informationon
tax-deferredaccountholdings.The
findingssuggestthatthe standard deviation
of household
laborincome
isrelatedtoassetlocation choices,withhouseholdsin lessriskyoccupationschoosing
more
tax-efficientasset locations. Thispaperrepresentsanimportantstep
toward
buildingmodels of
the factorsthataffectassetlocation choices.In thispaper,
we
also usedatafrom
severalSurveysof
Consumer
Finances(SCFs)
toanalyzeassetlocation decisions.
The
SCF
dataprovide completeand
disaggregatedataon
the portfoliosheldby
alarge
sample
of households.The
SCF
askshouseholdstoaggregatetheirholdingsacrossallfinancialintermediaries. This
makes
itpossibletostudythe overall structureofthe householdportfolio,ratherthanThispaper has
two
goals.The
firstis todescribe theimportance ofthe assetlocationproblem,asmeasured
by
thenumber
ofhouseholdsfacing asset location decisionsand
thevalue ofthe assetsheldby
households with suchchoices.
The
second istoexplore assetlocationpatterns,and
to relatethesepatternstohouseholdcharacteristicsthataffectthe gains
from
tax-efficientasset location,particularlyhousehold marginaltaxrates.
The
paperisdividedintofive sections.The
firstpresents informationon
thenumber
ofhouseholdsthatface substantivelyimportantassetlocation decisions.
We
identifysuchhouseholdsby
thepresenceofsignificantassetholdingsinbothtaxable
and
tax-deferredaccounts(TDAs).
Sectiontwo
explores
how
householdsallocatetheirassetsintaxableand
intax-deferred accounts. Inthe aggregate,equityinvestments
make
up
more
thantwo-thirdsoftax -deferred financial assetsand
a similarproportionoftaxable financialassets.
The
thirdsectionfocuseson
assetlocation decisions. Itdevelopsa simpleclassificationrule toindicate
whether
ornothouseholdsaremaking
assetlocation decisionsthatare taxefficient.
We
developseveralpossiblemeasures
oftax efficiency,and
we
present estimatesoftheportfolioreallocationthat
would
beneeded
tobringhouseholdsintax-inefficientpositionsto tax-efficientpoints. Sectionfour presents cross-sectional regression
and
discretechoiceevidenceon
the correlationbetween
varioushousehold
characteristicsand
assetlocationpatterns.We
investigate age,income,and
net
worth
patternsintax efficiency,and
studyhow
ahousehold'smarginalincome
taxrateaffectsthelikelihoodthatitsassetlocationchoicesaretax-efficient.
A
briefconclusion suggestsdirections forfutureresearch.
jL
How
Many
Households Face
AssetLocationChoices?The
recentexpansion oftax-deferredaccountshas includedIndividualRetirementAccounts
(IRAs),
which
are availabletoalltaxpayerswith earned income, 401(k)plans,which
areemployer-provided definedcontributionplansavailableat
some
firms,403(b)plans,which
aresimilarto401(k)plansbutare availableto
employees
atnonprofitinstitutions,and
anumber
ofothersmallerprograms.characteristicsofthose
who
participateinthem. Table1shows
thetotalvalueofassetsheldintax-deferredaccountsasafractionoftotalfinancialassets forselected yearsduringthelast
two
decades.The
TDA
sharewas
16.8percentattheend
of 2001, almost doublethesharein1985. Tax-deferredassetsareroughlyequallydivided
between
IRAs
andvarious typesofdefined contributionpension planaccounts.A
growing
fractionoftheassets in
IRAs
were
actuallyaccumulatedinpensionaccounts,and
then"rolledover"toanIRA.
The
aggregatedataillustratethegrowing
importance ofIRAs
and
401(k)s, buttheydo
notindicate
how many
householdshave
substantialbalances bothinTDAs
and
intaxable accounts,and
thusface substantivelyimportantassetlocationproblems.
To
investigatehow
many
householdsfallin thisgroup,
we
usedatafrom
the 1989, 1992, 1995,and 1998
Surveys ofConsumer
Finances (SCFs).The
SCF
isthebest availablesource ofdataon
household wealthand
itscomponents.
Itasksa relativelycomprehensive
setofquestions,hasa largesample
size,and
oversamples highnetworth
households.The
1998SCF, which
isdescribedby
Kennickell,Starr-McCluer,and
Surette (2000),sampled
4309
households, with
2813
intherandom
sampleand 1496inthestratifiedrandom
samplethatover-weightedthosewith highincomesor net worth.
By
combining
anareaprobabilitysample withahigh-incomeoversample,the
SCF
provides accurate informationon
broad populationcharacteristics,whilealsoofferingin-depthinformation
on
thehouseholdsthatholda disproportionateshareoffinancialassetsand
networth.Four householdsareexcluded
from
the publicusedatasetduetodisclosureconcerns, leavingasample
with4305
observations.One
fourthofthehouseholdsinthesurveyhave
networth of overa milliondollars. Allof ourtabulationsweightthevariousobservationsinthesurvey
by
theirsampling weightssothatourreportedstatisticsshouldberepresentativeoftheU.S.population.
We
measurethetotal valueofthe assetsheldintax-deferredaccountsas thesum
ofassetsheldin401(k)s, 403(b)s,IRAs, and supplementalretirementaccounts(SRAs).
We
excludethe valueofassets insome
traditionaldefined contribution plansthatdo
notfallintothesecategories,sincesome
oftheseplansmay
notallowparticipantsmuch
controlovertheirassetallocation decisions. Thisexclusionprobablyleadsustounderstate the valueoftax-deferredassets thataredirectlycontrolled
by
individualinvestors.A
similarallocation
may
limitindividual controlof investmentoptions.We
neverthelessincludeall401(k)planassets,becausevirtuallyall401(k)participantscontrolassetallocationdecisionsforatleast
some
oftheirholdings.Table 2presents
summary
informationon
thepercentageof households withtax-deferred accounts.The
firstcolumn shows
thepercentage withIndividualRetirement Accounts, 401(k)plans,403(b)plans,orotherself-directedretirementsavingplans. This percentagerises
from
30.7percentin 1989to45.7percentin1998.
The
nextcolumn shows
thepercentageof households withfinancial assets,excludingtransactionaccountssuchascheckingaccounts, outsidetheir
TDA.
Approximately
45 percentofthehouseholds ineachofthefourSurveys of
Consumer
Financesreportownership oftheseassets. This percentagewould
bemuch
greaterif
we
includedfinancialassetsintransactionaccounts.We
excludethem on
thegroundsthattheydo
notreflectlong-terminvestmentpositionsinthe
way
thatTDA
balancesdo.The
lastcolumn
inTable 2shows
thepercentageof households witheithertaxableor tax-deferredassets. Thisgroup accountsfor55percentof householdsin 1989
and
63percentin 1998.These
dataillustratetherapidgrowth duringthelastdecadeintheshareof households with
some
involvementin financialmarkets.Table3 presents
more
detailedinformationon
thesetof householdsthatfaceassetlocationproblems. It
shows
thenumber
of households withTDA
balances,andnon-TDA
balances,above
variousthresholdlevels in 1989
and
1998. Assetthresholds aremeasured
inconstant 1998dollars,and
theshadedentriesalongthe diagonal
show
theresultswhen
we
applythesame
thresholdtobothtaxableandtax-deferred accounts.
The
assetthresholdsdo
notadjust forthedeferred taxes associatedwithholdingsinsideTDAs,
or the greater prospectiveafter-taxreturnsassociatedwithassetsheldintheseaccounts. Poterba(2002)suggeststhatfortime horizonsof
between
25and
40
years,thesetwo
factorslargelyoffseteachother.The
upperpanelof Table3presentsinformationfrom
the 1989SCF,
whilethelower panelpresentsdata
from
1998.The
lowerpanelshows
that in 1998, 30.3 millionhouseholdshad
positiveamounts
of bothtaxableandtax-deferredassets.
Over
halfofthesehouseholdshad
significantamounts
inbothaccounts; 15.6millionhouseholds
had
more
than $10,000inboth,while 10.3 millionhouseholdshad
more
than$25,000inhouseholds,
had
more
than$100,000inbothtypesofaccounts. Thisgroup,which
accountsfor justover3percentofallhouseholds,heldalmost
42
percentofnon-transactionaccountfinancial assets.Comparing
theentriesinTable3for1989and
1998 demonstratesthegrowing
importance ofassetsintax-deferred accounts,and ofthe assetlocationissue. In1989, 8.6 millionhouseholdshad
more
than$10,000, and2.6million
had
more
than$50,000,inbothtaxableand
tax-deferredaccounts.These
amounts
are
measured
in 1998dollars.Between
1989and 1998, thenumber
ofhouseholds withtax-deferredassetsabovevarious thresholds
grew
much
more
rapidlythanthenumber
of households withtaxableassetsabovevariousthresholds.
To
place tax-deferredassetholdingsinthebroadercontextof householdportfolios,Table4
presentsinformation
on
the distributionoftheratioofTDA
assets tototalfinancial assets for the 1998SCF.
Assetlocationissuesare
more
importantforhouseholds withlargeTDA
balances thanforthosewithsmallbalances.
They
arerelativelymore
importantforhouseholds with roughlysimilarholdingsinsideand
outsidetheir
TDAs.
Forahousehold withaportfolioalmostentirely inthetaxableaccount,the assetmix
withinthe401(k)
may
beoflittleconsequence,sincethe valueofthe401(k)atretirementmay
represent a smallfractionoftotalwealth. Forahousehold with almostallofitsassets inthe
TDA,
theassetlocationdecisionisalsooflittleconsequence
—
theremay
betoofew
assetsoutside theTDA
toallowmuch
flexibility.Table4
shows
that in 1998, themedian
household with bothtax-deferredandtaxablefinancialassetshad
57.1percentofitsfinancial assets ina tax deferred account.At
the25thpercentilethisvaluewas
28
percent,whileatthe75thpercentileit
was
85.6 percent.Thus
thereissubstantialdispersionintheshareofassetsheldin
TDAs,
and
asubstantialnumber
of households havebetween
aquarter,andthree-quarters,oftheir financial assets inthese accounts. Forhigher networthhouseholds,the distributionoftax-deferred
assets relative toallfinancial assetsshiftstowardtheleft.
The
median
valueofthisratioforhouseholds withat least$250,000innetworth,forexample,is47.9percent,
compared
with57.1 percentforallhouseholds.The
measure
ofnetworth usedforthiscutoffincludes non-financialassets,andifwe
limitour sampletohouseholds withfinancial assetsof
more
than$250,000,we
findthatthemedian
household has only42.3the networthandfinancial asset distributions,asubstantialgroup of households have
TDA
and
non-TDA
holdingsthatareofsimilarmagnitude.
Not
surprisingly,networthisstrongly correlatedwithTDA
balances.The median
networth ofhouseholds with
more
than$25,000inbothtaxableandtax-deferredaccountsis$510,000, whilethemedian
forthosewith
more
than $100,000inbothsettingsis$1.18million. Inbothcases,mean
networthissubstantiallygreaterthan
median
($1.31 millionforthosewithmore
than$25,000inbothsettings,and $2.58millionforthosewith
more
than $1 00,000).Income
alsoriseswithTDA
holdings.Median
householdincome
risesfrom
$81,200forthosewithmore
than$25,000inboththeTDA
andthetaxable account,to$124,900forthosewith
more
than$100,000
ineachsetting,whilethemedian
ageofthehouseholdhead
rises
from
54to 56.The median income
statisticsdo
not capture asignificantnumber
ofretiredhouseholdswithlargeholdingsof both
TDA
and
non-TDA
financial assets,butrelativelylow
currentincome.2. AssetAllocation Patterns
The
datainthelastsectionsuggestthatroughlythirtymillionhouseholdsfacedassetlocationdecisionsin1998,andthatroughlyfifteenmillion
had
atleast$10,000inataxableaswellasatax-deferredaccount.
A
substantialshareofthehouseholds withsignificantTDA
balanceshad
similarbalancesinsideand
outsidetheir
TDAs.
Forthesehouseholds,decisionsaboutassetlocationcanhaveanon-trivialimpacton
theirlong-runfinancialstatus. Considera45-year-oldcouplewith$100,000ina
TDA,
and
thesame amount
ina taxable account.
Assume
thatthecouplefacesa28
percentmarginalincome
tax rateon
interestand
dividends,
no
capitalgainstax,and
thatbothbonds
and
stocks yield returnsof7 percent peryear,butallofthe
bond income
iscurrentlytaxablewhileonly 2percentoftheequityreturn,thedividendyield,istaxable.Ifthecoupleallocates the
TDA
tostocksand
thetaxableaccounttobonds,and
makes no
subsequentreallocationdecisions,thenatage70,netoftaxespaidtowithdrawassets
from
theTDA,
theywillhave$732,650.
By
comparison,ifthey invest theTDA
inbonds and holdequityin theirtaxable account,thelowertaxburden
on
thebond income
that resultsfrom
holdingbondsintheTDA
will result inanafter-tax8
thatcould haveimportanteffects
on
financialstatus. Inthissection,we
usedatafrom
theSurvey ofConsumer
Financesto investigate assetallocationpatterns,andtheninthenextsection,we
considerassetlocation.
2.1 Survey of
Consumer
Finances Informationon
AssetAllocationFor
most
typesoftax-deferredaccounts, theSurvey ofConsumer
Financesaskswhethertheaccountisinvested 'mostly orallinstock','split
between
stockandinterestearningassets',or"mostlyorallininterest-bearingaccounts,"orin "real estate,""insurance,"or"other." Hardly
any
TDA
assets areheldinrealestate,insurance,or"other."
We
usethisinformationtoconstructestimatesoftheassetcompositionoftax-deferred accounts,
and
tocompare
theseestimateswithcomparableestimateson
thecomposition oftaxableaccounts.
We
allocateall oftheassets inaccountsidentifiedas'mostly orallinstock' toequity,halfofthevalueof'split' accounts,and
none
ofthevalueofotheraccountstoequity.We
thensum
these equityholdings,aswellas thetotalvalueofallaccounts.
The
SCF
doesnot distinguish taxableand tax-exemptbondsinthe
TDA,
butbasedon
evidenceinBarberand
Odean
(forthcoming),we
assume
thatthereareno
tax-exemptholdings.
Forone group oftax-deferredaccounts, the
SCF
collects assetvalues but not thecompositionofassets.
These
are theaccountsof householdswho
had
a defined contributionplanataprevious job, butwho
have notyet rolledtheiraccounttoan
IRA
ortakencashdistributionsfrom
theplan. Nearlythreehundredthousandhouseholds have suchaccounts.
We
includedthesehouseholdsinoursummary
tabulationsintheprecedingsection,butinthisandlatersections,
we
exclude them.The
SCF
asksrespondentstoseparately reportthe dollarvaluesofdirectstock holdings, equitymutual fundshares,
and mixed
equity-fixedincome
mutual fundsharesthatareheldoutsidetax-deferredaccounts. Aggregatingthesereportedassetholdingsprovides a
measure
ofequityheldintaxableaccounts.We
do
not include equityinprivately-heldcompanies,sincesuchassetsmay
beilliquidanddifficulttotransfer
from
the taxabletothetax-deferredaccount.The
SCF
alsoprovidesconsiderabledetailon
fixed-income
assetsheld outsideoftax-deferred accounts.Our
measure of fixed-income assetsincludescertificatesforegoinganalysis,
we
excludethe valueof checking accountsand
money
marketaccounts,on
thegroundsthatholdingsoftheseaccountsare driven
by
liquidityconcernsratherthanassetallocationor taxissues.Tax-exempt bonds
raisespecialproblemsforouranalysis.While
theirrisk attributesaresimilartoother fixed
income
securities, theirincome
istaxedlessheavilythantheincome from
taxablebonds.The
holdersof tax-exempt
bonds
pay
implicitratherthanexplicittaxes,sothe effectivetaxburdenon
tax-exemptbonds
equals the yieldspreadbetween
comparably-riskytaxableand
tax-exempt bonds. Thisyieldspreadisusually smaller than the topmarginal
income
tax ratetimes the taxablebond
yield,soatleastforhouseholdswithrelativelyhigh marginaltaxrates,tax-exemptbondsofferahigherafter-taxreturnthan taxable bonds.
For
some
households,tax-exemptbonds
may
thereforeofferaless risky,butlightly-taxed,alternativetotaxableequity. In
some
of ourcalculations,we
combine
tax-exemptbonds withequitytodescribehouseholdassetallocations
between
heavily-taxedandlightly-taxedassets.Inthe 1
998
SCF,
4.8 percentofallhouseholdsreportedowning
tax-exempt bonds,and
another 1.8percentheldtax-exempt
money
marketaccounts. Ifwe
restrictourattention tohouseholdsthathave bothtaxableandtax-deferredfinancial assets, 11.9percentholdtax-exempt bonds. Thisfractionhasdeclined;it
wasl6.3percentin 1989. In contrast,thepercentofallhouseholds
owning
tax-exemptbonds
hasbeen
verystable.
Most
ofthehouseholdsthatown
tax-exemptbonds
alsoholdtaxablefixed-incomesecurities. In1998,ofthe4.9 millionhouseholds holding tax-exempt bonds, roughlyhalfa million reported
no
financialassetsoutsidetheir
TDA,
andone
millionheldno
corporatestock.2.2AssetAllocation Patterns
Our
analysisofassetlocationdecisionsfocuseson
whether households holdequities in theirtaxableaccountsorintheirtax-deferredaccounts. Table5reportsthefirststepinouranalysis:
summary
informationon
theequityexposure ofSCF
households.The
table alsoshows
thepercentageof householdswho
holdfixed
income
assets,and tax-exemptbonds.The
tablepresentscross-sectionalinformationanditalsodocuments
recenttrends.The
firstpanelshows
thatequity rosefrom
40.4 percentoffinancialassets in 1989to69.7 percentoffinancial assets in 1998. Thisincreasereflectedboth highremrns
and
broadening10
accountsrose
from
27.3percentto45.8percent,whiletheshareofinvestorsholdingfixed-incomeassetsremainedsteadyataround 50percent.
The
shareof households with anyequity orfixed-incomeassetsrosefrom 54to63percentoverthistimeperiod,while theshareholdingtax-exemptbonds
was
steadyatbetween
fourandfivepercent.
The
lowerpanelsof Table5present separateinformationon
financial assetsheldinside,and
outside,tax-deferred accounts. In 1989, the equity shareofassetsheldin
TDAs
(34percent)was below
the equityshareintaxableaccounts(43percent).
By
1998,68
percentofTDA
assetsand
71 percentofnon-TDA
assetswere
heldin equities.The
similarityofthestock-bondmix
insideand
outsideTDAs
raisesquestionsabouttheextentto
which
investorsareconsideringtax factors indecidingwhetherto locate assetsinsideor outsidethe
TDA.
Table5 alsoshows
thatthepercentageofTDA
households withequityin theirTDA
rosefrom
13.3 in1989to34.5in 1998.
Table5 focuses exclusively
on
householdsthatown
equity,and
itdocuments
how
thesehouseholdsown
theirstock. There canbesubstantialtaxconsequencesassociatedwithdifferentmethods
ofequityownership. For example,investors
who
holdstockthroughequitymutual funds cedesome
controlovertheirtaxburdenstofundmanagers'capitalgainrealizationdecisions.
The
firstrow
inTable 6shows
that in 1989,27.3percentof households
owned
stock. Thistotalcan bedisaggregated: 7.3percentheld equityonlythroughtheir
TDA,
6percentheldequitybothinsideand
outside theTDA,
and
14percentheldequityonlyoutsidetheir
TDA.
The
tablealsoshows
that 14 percentofallhouseholds(10.2+
3.8)had
onlydirectequityholdings,while 6percent(1.1+1.1+1.8+2.0)heldat least
some
equitythroughamutualfund.These
summary
statisticschanged
duringthe 1990s.By
1998, 12.4 percentof households heldtaxableequityonlythroughstock
owned
directly,while15.3percentheldsome
taxableequitythroughamutual fund(15.3
=
4.7+4.8+2.1+3.7).The
percentageofthe populationholdingatleastsome
equity roseto45.8 percentin 1998,
and
thiswas
theresultofrisingnumbers
who
held equityonlyinaTDA
(from7.3percentto 18.1 percent) aswell asbothinsideandoutside a
TDA
(6percentto 16.4percent).The
datafrom
theSurvey of
Consumer
Financesdocument
apronounced
trendtowardahigherfractionofequity11
taxburdens
on
stocksand on bonds,sincethe effectivetaxburdenon
equitiesheldthroughintermediariesisoftenhigherthanthat
on
buy-and-holddirectequity investments.Table7 presents information similarto that inTable6, butitdoessoforthecaseof
bonds
ratherthanstocks. For bonds,the difference
between
holdingassetswithinaTDA,
andoutsidesuchanaccount,isveryimportantfordeterminingtheeffectivetaxburden. Inadditionto splittingfixed-income investments
by
TDA
and
non-TDA
location,Table7 also distinguishes taxablefixed-income investmentsintaxableaccountsfrom
holdingsof tax-exempt bonds. Table 7 does notsuggestany changesin
bond
ownershipthatarenearly aspronouncedas thoseforstockownership. There
was
literallyno
changebetween
1989 and 1998inthepercentageof households
-
48.8-
owning
fixedincome
assets.Roughly
onequarterofthisgroupheldfixed-income
assetsinsidetheirTDA
butnotoutside,whilenearly halfheld fixedincome
assetsoutside theTDA
butnotinside. There hasbeen
some
increase,from
8.8percentto 13.1 percent,inthepercentageofhouseholds with fixed-income investmentsheldonly throughtheir
TDA,
and
adecline,from
25.6to22.7percent, inthe setof households withfixed
income
heldonlyoutsidetheTDA.
The
overwhelming
majorityof
SCF
households holdno
tax-exempt bonds, althoughthosewho
do
holdthesebonds
tendtobeinthehighest networthstrata,
which
makes
theaggregateportfolioshareheldinthesebonds
significant.3. AssetLocation Decisions
We
now
exploreassetlocationchoicesinthe Survey ofConsumer
Finances.We
begin withasummary
ofthese choices. Table8 presentsinformationon
thenumber
of householdswho
reportvariousassetlocation patternsinthe 1998
SCF.
The
columns
ofthistableindicatewhether households havetax-deferred accounts,
and
ifthey do,what
assets(onlyequity, only bonds,and
some
combination)theyholdintheseaccounts.
The rows
describethe assets thatthehouseholds holdin theirtaxableaccounts.We
combine
tax-exempt
bonds
withequitiesheldintaxableaccounts.The
tableshows
thatthereare 46.2 millionhouseholds withassets intax-deferredaccounts; theseare thehouseholdsin
columns
two
throughfour.Of
thisgroup, thereare30millionhouseholds withtaxableassetsoutside the
TDA.
Thisisthegroup of12
We
definetax-minimizingassetlocation patterns asonesthatallocatefixedincome
assets totax-deferredaccountsbefore taxable accounts.
Households
thatfollowsuchassetlocation patternsarelabeledastaxefficient.
The
entries inTable8thatarelightlyshaded correspondtoassetlocation patternscouldbetax-minimizing.
The
darklyshadedthe entriescorrespondtoinvestmentpatterns thatdo
notappeartobeconsistentwithtax-minimization. Thereare 10.8millionhouseholds(23.4 percentofallhouseholds with
TDAs,
and 36
percentofthosewithTDAs
as well as taxableassetsoutside theTDA)
holdingonlyfixed-income
assets in theirTDAs.
Thisisagroupthatmight beallocatingtheirhighly-taxedassets to theirtax-deferredaccount. Less thanhalfofthisgroup,however,4.1 millionhouseholds,holds
any
equity outsidetheTDA.
These households,who
arefollowingastrict"bonds
intheTDA,
stocksinthetaxableaccount"allocationrulerepresentlessthanonetenthofthehouseholds withtax-deferredaccounts,
and
13.6percentofthosewith both
TDA
and
non-TDA
financial assets.Table8 also
shows
thatthereare2.5millionhouseholds with onlybonds
intheTDA,
and
onlybondsoutside the
TDA.
Thisgroupmay
alsobe followingatax-minimizingassetlocationstrategy,asmay
bethe4.9 millionhouseholds with onlyequityin their
TDA
andin theirtaxableaccount. Forahousehold withrisktolerancethatpointstoward holding onlystocksorholdingonly
bonds
inbothsetsofaccounts, thereisno
effective assetlocationdecision.
One
additional group, thosewithbonds and
stocksintheTDA,
andstocksinthetaxable account,couldalsobetax-rninimizing. Thisgroupconsistsof2.3millionhouseholds.
Adding
allofthesegroupsinthe lightlyshaded boxestogether,thereare 13.8millionhouseholds
~
29.9 percentofallhouseholds with
TDA
assets,or46
percentof
thosewithbothTDA
andnon-TDA
financial assets- who
may
be following tax-minimizingassetlocationrules.Table8 also
shows
thatthereisasubstantialgroupof householdsthathold both fixed-incomeandequity investments, but
who
holdalloftheirequities inside theirtax-deferred account.These
householdsareindark-shadedentriesofthetable. Thereare 6.5(=3.3
+
3.2)millionhouseholdsthathold onlyfixed-income
securitiesoutsidetheirTDA,
while holdingeitherallequitiesoramix
ofbonds and
stocksintheTDA.
These households appeartobe followingjust thereverseofthe"bondsintheTDA"
strategy. Another13
Thereare9.7 millionhouseholdsthatreportonlyequityinthe
TDA
orbothequityand
fixed-incomesecurities inthe
TDA,
and
holdingsof bothequityand fixed-incomeassetsoutsidetheTDA.
These
households,likethose
who
holdbonds
outside theTDA
and
stocksintheTDA,
could probablyincreasetheirafter-tax financial assetsatretirement
by
adjustingtheirportfolio toholdmore
oftheirfixed-incomeinvestmentsin theirtax-deferredaccount,whilepreservingtheir overallriskexposure.
The
entries inTable8useastark criterion forinclusionincategoriessuchas"onlyequityin theTDA." To
capturehouseholdsthathave mostlyequityintheTDA, we
repeatedthecalculationsthatunderliethetableusing"greaterthan
80
percentoftheTDA
investedinequity"inplaceofthe 100percent cutoffinTable8.
We
made
similarchangesinourother categorizationcriteria,replacingany
100percent cutoffwith80percent,
and
percentwith20
percent.The
resultsarebroadlysimilartothe findingsinTable8,althoughfewer householdsare classified asfollowingstrategies thatarenottaxminimizing
when
we
takethisapproach.
Of
the46.2 millionhouseholds withTDA
assets,3.8millionhavemore
than80percentoftheirTDA
inequity,and
lessthan20
percentoftheirtaxableaccountinequity. Thiscompares
with3.2millionhouseholds inTable8withall oftheir
TDA
inequity,andalloftheirnon-TDA
assets infixedincome.The
number
of households followingassetallocation patternsthatarenot taxminimizing,and
aredark-shadedinthetable,dropsfrom16.2millionto 10.5million
when
we
usethelooser categorizationcriterion.Summary
statisticslikethoseinTable8 provide a useful perspectiveon
assetlocationdecisions.We
havealsopresentedthisinformationina graphical format. Figure 1plotsthebivariate distributionof
householdasset allocationdecisionsintaxable as wellastax-deferredaccounts.
The
concentrationofhouseholds with
TDA
equityallocationsofzero,50percent,and
100percentreflectsinpartour procedureforturning categoricalresponsesinthe
SCF
into quantitativemeasures.The
figureshows, however,thatthereisa verysubstantialconcentrationof householdsinthe four cornersofthedistribution. Thereare
two
mass
pointsinthedistribution,correspondingtomore
than80percentequityallocationinboththeTDA
andoutside the
TDA
(28.3 percentofthehouseholds withTDAs
and
non-TDA
financial assets)and
lessthantwentypercent equityallocation(justover 10percent).
Amromin
(2002)presents similar information,14
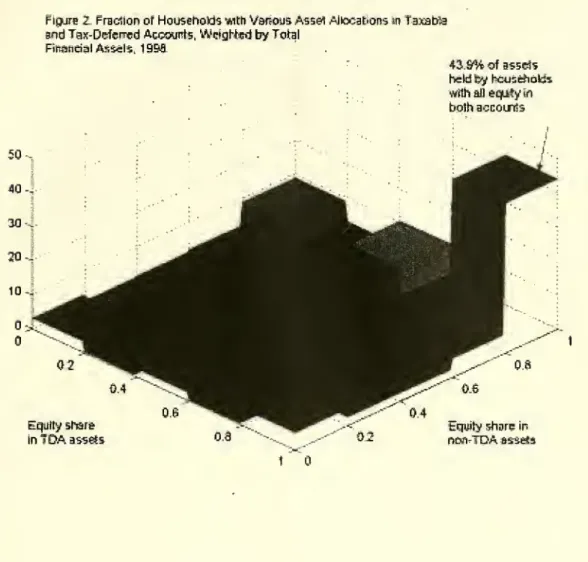
Figure 2 presents information similarto that inFigure 1,buthouseholdsare
now
weightedby
thetotal
amount
offinancial assets thattheyholdinsideand
outsidetheirTDAs.
The
datainFigures 1and 2takentogethersuggestthatthehouseholds with littleor
no
equityin theirTDAs
tendtobe low-wealthhouseholds.
When
we
weightby
financial assets,43.9percentofallhouseholds havemore
than80percentoftheir
TDA
assetsinequity,and
a similarfractionoftheirnon-TDA
assets in equity. Figure2demonstratesthat
most
ofthe assets intax-deferredaccountsareheldinaccountswith highallocations to equity,asthe datainTable5suggested.
Table8
and
Figures 1 and2providesome
insighton
theextenttowhich
householdsarepursuingtax-minimizingassetlocationstrategies,but they
do
notofferaquantitativemeasure
ofhow
closetax-inefficienthouseholdsare to tax -efficient points.
To
addressthisissue,we
compute
theamount
of wealththateach household witha
TDA
and
non-TDA
financialassetswould need
to reallocate inordertoreach atax-efficientportfolio. Table 9
summarizes
the findings.The
firstrow
reportsinformation alreadypresentedinTable8:thereare 16.2millionhouseholdsthatappeartobefollowingtax-inefficient strategiesbased
on
theircurrentportfolioholdings.
The
secondrow
askshow many
ofthesehouseholds holdportfolios thatwould
requireasset
movements
ofmore
than$2500
toreach atax-efficientpoint. For example,ahousehold witha$2000
TDA
balanceinvestedinequity,and
largebond
holdings outsidetheTDA,
couldbe broughttoatax-efficientpoint
by swapping $2000
ofTDA
equityfor debt.Such
ahouseholdwould
be countedastax-inefficient inthefirst
row
of Table9,but notinthesecond.The
resultssuggestthatnearly halfofthehouseholds withtaxinefficientholdingsarewithin
$2500
ofatax-efficient point:only8.5millionofthe 16.2milliontax-inefficienthouseholds cannot be broughttotax-efficiencywithassettransfersof
$2500
orless. Ifwe
allowforasset transfersofno
more
than$10,000 per household,allbut 4.6 millionhouseholds can bebroughttothetax-efficient point.Thisresultsuggeststhat
by moving no
more
than 11.8 millionhouseholds*($10,000), or $118billion,
we
canmove
three-quartersofthetaxinefficienthouseholdstotaxefficient points.
The
informationinTable 9suggeststhatformany
ofthehouseholdsthatarefollowingwhat
15
wealth they
would
accumulateundera taxefficientstrategy,and
theamount
theywillaccumulateiftheycontinuetofollowtheircurrentstrategy.
Table 10 presents another calculationdesignedtoaddress theproximity ofexistingportfolios to
tax-efficient allocations. Itfocuses
on
thetotalamount
of wealththatmust
bereallocatedtoachieveatax-efficientallocation forallhouseholds with
TDAs,
ratherthanon
thenumber
of householdsthathave holdingsthatare inefficient
by
more
thanacertainamount. Sinceassetholdingsarehighly concentrated,resultsbasedon
householdsand on
assetscandiffersubstantially.The
firstrow
inTable1 focuseson
theuniverseofhouseholds with
TDAs
and
positiveholdingsoffinancial assetsoutside theTDA.
In 1998,thetotalbalancein
TDAs
was
$2.64trillion.To move
allhouseholds withTDAs
toatax-minimizingassetlocationwould
requireassettransfersof $250.8billion,orjustunderonetenthof
TDA
assets. Thisisslightlymore
thantwice thetransfer,calculatedabove,that
would
bringallbut 4.6 millionhouseholdsto tax-efficientpoints.Table 10also
shows
thepercentageofassets thatneedtobereallocatedtoachievetaxefficiencyforhouseholds
whose
assetsmeet
various thresholdsforTDA
and
non-TDA
holdings. Forthosewithatleast$250,000inbothtaxable
and
tax-deferredholdings,therequired reallocationis$83billion,orelevenpercentof
TDA
assets.The
required reallocation asapercentageofTDA
assetsissmallestforthosewithsmallholdings
-
thosewho
do
nothave
atleast$25,000inboththeirtaxableandtax-deferred accounts. Forthisgroup, thereallocation
needed
toachievetaxefficiency ($33.9billion)isonly4.3 percentoftotalTDA
assets.Thisreflectsthesmallersize
of
TDA
relative tonon-TDA
assetsforthisgroup,aswellasa greatertendencytoholdtaxablefixed
income
assets intheTDA
among
smallaccountholders.Table 10 also
shows
theaggregateportfolioreallocation thatwould
beneeded
tomove
householdstoequal equity/fixed-income allocations insideandoutsideoftax-deferred accounts.
The
required reallocationisnot
much
largerthan theone
thatisneeded
tomove
allhouseholdstothetax-minimizingasset location.The
comparison ofthese calculationssuggeststhathouseholds appeartobeslightlyclosertothetax-minimizing
outcome
thantoa defaultstrategy thatwould
allocatethesame
fractionof boththetaxableandthetax-deferredaccountto equities.
The
thirdcolumn
of Table 10shows
thereallocationthatwould
be16
each household could hold $25,000infixed-incomeassetsoutsideofthe
TDA
for financialemergencies.Such
abuffer stockmight beattractiveif,asinAmromin
(2002) andHuang
(2001),householdsfacerandom
shocksto theirexpenditureneeds
and
theycanmake
earlywithdrawalsfrom
tax-deferredaccounts onlyatsubstantial cost.
The
required reallocationwhen
we
allowfora buffer stockofnon-TDA
fixedincome
savingisonlyslightlysmaller thanthat
when
we
do
notconsidersuchabuffer.The
notionofafinancialbuffer stock outsidetheTDA
raisesan importantquestionabouttheextentto
which
TDA
and
non-TDA
assets are substitutes. Forindividualsovertheageof 59Vz,who
canwithdraw
assetsfrom
TDAs
withoutpenalty,thedegreeofsubstitutabilityisgreaterthanforyounger
householdswho
facewithdrawalpenaltiesof 10percent.
Depending on
the structureoftheTDA,
theremay
alsobeotherfactors,suchashardship withdrawalrestrictionsin401(k)plans, that limitthedegreeto
which
TDA
assetscansubstitutefor
non-TDA
assets.Our
analysisfocuseson
the tax differencesbetween
assetsheldinsideandoutside
TDAs,
butnon-taxdifferencesshouldalsobe consideredinfuturework.4. ExplainingtheDivergence
Between
Actual Asset Locationand Tax-Minimizing
BehaviorThereissubstantialheterogeneity acrosshouseholdsin the asset allocations thattheychoseintaxable
and
TDA
accounts.While
developingastructuralmodel
oftheoptimalamount
ofequity ordebttoholdinthetax-deferredaccount,giventhe
random
shocksfacinghouseholds,isbeyond
thescopeofthe currentpaper,
we
canexplorewhich
typesof householdsmake
tax-efficientassetlocation decisions.We
do
thisinthreeways. First,
we
estimate probitmodels
for the discretechoiceof whetherornot ahouseholdisinthetax efficientregioninTable8. Second,
we
estimate regressionmodels
toexplain the differencebetween
theshareofthetax-deferredaccountthatisheldinfixed
income
assets,andtheshareofthe financial assetportfoliooutside the
TDA
thatisheldinfixedincome
assets. Finally,we
estimate regressionmodels
inwhich
thedependentvariableistheshareofTDA
assets thatwould
needtobereallocatedtobringthehouseholdtoatax-efficient allocation.
We
considerthehousehold's marginaltaxrate,itsreportedrisktolerance,itsage,networth, and17
rate,are readilyavailableontheSurvey of
Consumer
Finances.Our
marginaltaxratevariableisanestimateofthehousehold's marginalfederal
income
taxrateon
ordinaryincome,constructedusingthealgorithmdescribedinPoterba and
Samwick
(forthcoming).The
benefitofmaking
atax-efficientassetlocationdecisionisincreasinginahousehold's marginal
income
taxrate.We
thereforetestforanassociationbetween
themarginaltaxrateandassetlocationpatterns.Inourestimation,
we
report resultsbothfortheentiresample of households withTDAs
and
non-TDA
financialassets(1709observations),and
forasubsample ofthosehouseholds withIRAs
(1410observations).
Some
householdsinthesubsample haveTDA
holdingsonlyinanIRA,
whileothershaveboth
IRA
andnon-IRA
holdings.When
we
analyze thesubsample withIRA
holdings,we
defineourmeasure
oftaxefficiencyusingonlytheassetsheldintheIRA.Thus
ahousehold with anERA
fullyinvestedinbonds,but a401(k) withsubstantialequity holdings,
and
equityholdingsina taxableaccountaswellwould
beclassifiedastax efficient inthesubsampleanalysis.Our
rationale forfocusingon
thesecondgroupisthatsome
households with 401(k) accountsmay
holdequityintheir
TDAs
becauseofemployer
restrictionson
asset allocation.Many
employersmake
401(k)matchingcontributionsin
employer
stock,and
theyrequireemployees
toholdthisstockforsome
periodoftime. Thiscouldresult in
some
households holdingequityin theirTDA,
even thoughtheywould
prefertochoosea
more
tax-efficient asset allocation.We
haveno
way
toidentifyhouseholds withconstrained holdingsin their401(k)s, so
we
focusonlyon
IRA
holdingsbecause households have completediscretioninallocatingtheseassets.
Table 1 1 presentsthe resultsof ourempirical analysisofthe cross-sectional determinantsofasset
allocation.
The
firsttwo columns
present estimatesofprobitmodels
foradiscretedependentvariablesetequaltounityifthehouseholdexhibits a taxefficientassetlocationpattern,andzero otherwise.
The
basicspecificationis
(1)
Prob(TAXEFFi
=
1)=
<D(p+
5*MTR, + I
of AGE,
+
I
yk*NETWORTH
ik18
where
TAXEFF,
isanindicator variablefortaxefficiency,and
0(.) denotesthestandardnormal
distributionfunction,and
we
include categorical indicator variables for age, networth,and
householdincome.
The
RISK
variables areresponsestothreeSCF
questionsthattrytoelicitahousehold'spreferenceswithrespecttotherisk-rewardtradeoff.
The
coefficientestimatessuggest apositive,althoughvariable, relationshipbetween
householdmarginaltaxratesandthetax efficiency
of
ahousehold'sassetlocation choices. Forthefullsample,thecoefficient
on
thetaxvariableispositive,butstatisticallyinsignificantly differentfrom
zero. Itislarger inabsolutevalue,
and
statisticallysignificantly differentfromzero, fortheIRA
subsample.The
resultswithrespecttothemarginaltaxratecoefficientsaresensitive,however,tothe other variables includedinthe
equation. Eliminatingthecategoricalvariablesforhousehold income,forexample, reducesthemarginaltax
ratecoefficient
and
insome
specifications results ina negativecoefficientestimate.Thereis
some
evidence of anage-related patternintax-efficiency.Both
oftheestimated equationsshow
asubstantiallylargeragecoefficientsforthe 60-69year oldagegroupthanfor the50-59 yearoldgroup.
The
significance ofthesetwo
agecategoriesisthatthe taxpenaltyforwithdrawalsfrom
tax-deferredaccountsiseliminatedoncethehousehold reaches age
59
54,therebyreducingtheimportanceofprecautionarysavingconsiderations.
Households
over age60
aremore
likely tohave
tax-efficient allocationsthantheirslightlyyoungercounterparts.
We
experimented withexpandingthe specificationtoincludeaninteractionterm
between
themarginaltaxrateand
anindicatorvariableforhouseholds overtheageof60,butwe
couldnotreject the nullhypothesisthatthecoefficienton
thisvariablewas
equalto zero.Thereisonly
weak
evidence ofnetworth-related, or income-related, patternsinthe probabilityofholdingatax-efficient portfolio.
The
specificationinthefirstcolumn
suggeststhathouseholds withnetworth oflessthan$25,000are less likely to
make
tax-efficientchoicesthan otherhouseholdsare,but thedifferences acrossnetworthcategories arenotstatisticallysignificant. Similarproblemsariseininterpreting
the
income
coefficients.The
nexttwo columns
of Table 11,columns
threeandfour, reportregression equations inwhich
the19
shareof
non-TDA
assets infixedincome
securities.The
specificationincludes thesame
explanatoryvariablesastheprobit
models
reportedinthefirsttwo
columns:(2) DIFF,
=
p
+ 8*MTR,
+
I
a
j*AGE
1J+
I
yk*NETWORTH
lk+Et]
c*RISK,
c+
2
p
s*rNCOME
is+
£,.Once
again, theestimatedcoefficienton
themarginaltax ratevariableissensitive toourchoiceofestimationsample.
The
coefficientson
themarginaltaxratearenegativeinthemodels
forboththefull sampleand
theERA
subsample.The
coefficientisstatisticallysignificantly differentfrom
zeroforthesample withERA
holdings.
The
pointestimatefor this specification, -.412,impliesthataone percentagepoint increaseinahousehold's marginaltax rateleadstoa 0.4percent declineinthedifference
between
theshareoffixed-income
assets inthetaxableand
the tax-deferredaccount.Thereis
some
evidence ofalinkbetween
networth andthedifferenceinasset allocations.Highernetworth households appeartoholdahighershareoftheir
non-TDA
assets infixedincome
thanlowernetworthhouseholds. Thisfindingistruefor the
ERA-only
sampleaswellas forthebroadersample. Itislargelydriven
by
a smalleramount
of fixed-income holdinginthetax-deferredaccountsof highnetworthhouseholds. Thereisonce again
some
evidenceofa differenceinassetallocationpatterns forhouseholdsintheirfifties
and
sixties,witholderhouseholdsshowing
asmallerdifferentialbetween
theshareoffixedincome
assets intaxableandtax-deferredaccounts. Thereareno pronounced
patternsinthe assetallocationpatternsacross
income
groups,andthecoefficientson
some
oftheadjacent indicator variablesforincome
categoriesdiffersubstantially.
The
lasttwo columns
of Table 1 1 presentourlastempiricaltestof whethertax rates affect assetlocation.
The
dependentvariableintheseregressionmodels
isthepercentageofTDA
assets thatneedtobereallocatedinordertoreach a tax-efficientallocation.
The
specificationisotherwisethesame
as thatinequation(2).
Once
againthemarginaltaxratevariablehasmixed
effectsacrossspecifications.The
coefficientestimateispositive
when
we
estimate themodel
forthefullsample,andnegativewhen
we
estimateonthesample of
ERA
holders. Enneithercaseisthe coefficienton
themarginaltax ratevariable20
5. Conclusions
Thispaperpresentsevidence
on
assetallocationand
locationdecisionsforhouseholdswithsubstantial balancesinboththeirtaxableandtax-deferredaccounts. It
shows
that assetlocationisanimportantfinancialissueforasubstantialgroup ofU.S.households.
More
thanelevenmillionhouseholdsin1998
had
atleast$25,000inbothtaxableand
tax-deferredaccounts,and
atleast3.4millionhad
more
than$100,000investedineachtypeofaccount.
Many
households havechosenassetlocationstrategies thatallocateequityto theirtax-deferredaccount while theyareholdingfixed
income
investmentsintaxableaccount.A
broad range ofstudiesbothinacademicjournalsandin outlets that areread
by
financialservices professionals,suchasCharron (1999)and
Crain
and
Austin(1997), suggestthathouseholds canraise their after-taxretirementwealthby
holding highlytaxedassets in theirtaxdeferred account,
and
lightlytaxedassetsoutside. Datafrom
theSurvey ofConsumer
Financesneverthelesssuggestthattheequity shareoftax-deferredassetsisroughlyequaltotheequityshare
offinancial assetsoutsidethe
TDA.
The
costoftax inefficientbehaviormay
be modest,however,formany
households.
Our
calculationssuggestthatforroughlythreequartersofthehouseholdsthatappeartodeviatefrom
tax-efficientassetlocationstrategies,moving
lessthan$10,000inbonds
or stockswould
bringthem
toatax -efficient allocation.
The
limitedsizeofthisreallocationplacesanupperbound on
theforegoneretirementwealthassociatedwithcurrentassetlocation decisions.
We
havehad
limitedsuccessinexplaining theassetlocation patternsthatwe
observeincross-sectionalsurveydata. In the 1998 Survey of
Consumer
Finances,forexample,we
findatbest aweak
relationship
between
ahousehold'smarginalincome
taxrateandthetax-efficiencyofitsportfolio allocation.Explainingthese patternsisclearlyachallengefor futurework,
which
shouldfocusbothon
theinformationthathouseholdsreceiveaboutassetallocationdecisionswithin tax-deferred accounts,
and
on
householdawarenessoftheafter-taxreturnconsequences ofdifferentassetlocationchoices.
The
assetlocationdecisionispartofabroader householddecisionaboutportfolio allocation.Findingthat
many
households pursuetax-inefficient assetlocationstrategies raisesquestionsaboutother21
one suchdecision:
consumer
borrowing. Datafrom
the 1998SCF
suggestthat44
percentof U.S. householdshaveoutstandingcreditcard balances. Moreover, 1 1.5percenthaveacreditcardbalance ofat least$5000,
and
more
than 18 percenthavemore
than$2500
inoutstanding balances. Since 1986,interestpayments on
consumer
debthavenotbeendeductiblefrom
adjustedgrossincome
forthepurposeofcomputing
taxableincome. Interest
on
mortgagedebt,however, remainsdeductibleforincome
taxpurposes.The
taxdeductioncreatesastrong incentiveforhouseholdsto
borrow
throughhome
equitycredit linesratherthanon
creditcards
when
theycan.Maki
(1996)and
Stango (1999)suggest a declineinbothcreditcarddebtand
inautoloan financingafter
TRA86,
along withanincreaseinmortgage
borrowing.Inspiteofthetaxincentives,thereappeartobeasignificantminorityof households withcreditcard
balances
who
couldgeneratesubstantialtax savingsby
increasingtheiruseof mortgagedebt.Our
preliminary estimates suggestthat
among
the 18 percentof households withat least$2500
inoutstandingconsumer
debt,5.4percent,orjustunderonethirdofthegroup, haveatleast$50,000inself-reportedhousingequity. Nearly one seventh ofthisgroup, or2.3percentoftheaggregate population,hasatleast
$100,000inhousingequity. Itispossiblethatthetransactionscostsassociatedwithestablishinga
home
equitylineoutweighthe taxsavingfor
some
households,particularlythosewho
do
not itemizeand
who
do
notexpecttomaintaintheircreditcardbalanceforverylong. Nevertheless,it
seems
thatmany
ofthesame
issues that arise inexplainingapparentlytax-inefficient assetlocationdecisionsalso arisewithrespectto
consumer
borrowingdecisions.Work
iscurrentlyunderway on
these,and
otherrelatedhouseholdfinancialREFERENCES
Amromin,
Gene
(2002), "PortfolioAllocationChoicesinTaxable and
Tax-Deferred Accounts:An
Empirical Testof
Tax
Efficiency,"mimeo,
UniversityofChicago Department
ofEconomics.
Barber,
Brad
M.
and
TerranceOdean
(forthcoming), "Are Individual InvestorsTax
Savvy?
Asset LocationEvidence
from
Retailand
DiscountBrokerage
Accounts."Journalof PublicEconomics
.Bodie, Zvi
and Dwight
B.Crane
(1997), "Personal Investing:Advice, Theory,and
Evidence," Financial AnalystsJournal 53,Number
6(November/December),
13-23.Charron,TerryS.(1999), "Tax-Efficient Investing for
Tax
-Deferredand Taxable
Accounts," Journal of Private PortfolioManagement
(Fall),31-37.Crain,TerryL.
and
JeffreyR. Austin(1997),"An
AnalysisoftheTradeoffBetween
Tax
Deferred EarningsinIRAs
and
Preferential CapitalGains," Financial ServicesReview
6(4),227-242.Dammon,
Robert,ChesterSpatt,and Harold
Zhang
(2002)."Optimal
Asset Locationand
Allocationwith Taxableand
Tax
-DeferredInvesting,"Mimeo,
Carnegie-Mellon
University.Huang,
Jennifer (2001). "TaxableorTax
DeferredAccount?
PortfolioDecisions with Multiple Investment Goals."Mimeo,
MIT
SloanSchool ofManagement.
Kennickell,ArthurB.,
Martha
Starr-McCluer,and
Brian Surette.2000."Changes
inU.S.Family
Financesatthe
End
ofthe 1990s: Resultsfrom
the1998 Survey
ofConsumer
Finances." Federal ReserveBulletin (January).Maki,
Dean
(1996), "Portfolio Shufflingand
Tax
Reform,"
NationalTax
Journal 49,317-329.Poterba,
James
(2002). "Valuing AssetsinRetirementSaving Accounts,"mimeo,
MIT
Economics
Department.Poterba,James,
John
Shoven,and
Clemens
Sialm
(2001). "Asset Location forRetirementSavers,"inW.
Gale,J. Shoven,
and
M.
Warshawsky,
eds.,PrivatePensionsand
PublicPolicies(Washington:Brookings
Institution).Poterba,James,Steven
Vend, and David
Wise
(2001)."The
TransitiontoPersonalAccounts and
IncreasingRetirement Weaith:
Macro
and
Micro
Evidence,"NBER
Working
Paper 8610.Samwick, Andrew, and James
Poterba(forthcoming). "Taxationand Household
PortfolioComposition:Evidence from
Tax
Reforms
inthe 1980sand
1990s." Journalof PublicEconomics
.Shoven,
John
B. (1999)."The
Locationand
Allocationof AssetsinPensionand
Conventional Savings Accounts,"NBER
Working
Paper
7007.Shoven,
John
B.and
Clemens
Sialm(forthcoming). "Asset LocationinTax-Deferredand
Conventional Savings Accounts,"JournalofPublicEconomics.
Stango,Victor(1999).
"The
Tax Reform
Act
of1986
and
theComposition
ofConsumer
Debt." NationalTax
Journal52, 717-739.Table 1: Self-DirectedTax-Deferred Assetsasa PercentofTotal Financial Assets
Year
IRA
DC
pension Total1985
3.1%
5.5%
8.6%
1990 5.3 6.1 11.4
1995 6.9 7.9 14.8
1998 7.9 8.4 16.3
2001 8.5 8.3 16.8
Source:
Flow
of Funds,Z.l release,TablesL.10
and
L.l19.c. Total financial assetswere
$8.0trillionin 1985, $12.3trillionin1990, $18.6 trillionin1995, $27.2 trillionin1998,
and
$28.3trillionin2001.
Table2: Percentageof
Households
withTax-Deferred Accounts
or FinancialAssetsOutside Tax-DeferredAccounts,1989-1998
Year
Tax
Deferred AssetsTaxable
Financial AssetsOutsideTDA
Either
Taxable
orTax
Deferred Assets1989 30.7 45.6 55.1
1992 33.8 44.5 55.4
1995 40.7 43.1 58.4
1998
45.7%
46.8%
63.0%
Source: Tabulations
from
SurveysofConsumer
Finances. Financial assets outside the tax -deferred account includestocks, equitymutual funds,certificatesof
deposit,savings bonds,and
other taxable bonds.Tax-exempt bonds
arenot includedinthesetoffinancial assetsoutside theTDA.
In 1989,6.5 percentof
households reportedsome
holdingsoftax-exempt bonds;thisfractionwas
stableacross surveys, rising to 6.6 percentin 1998. Virtuallyallhouseholdsowning
tax-exemptbonds
alsoheld taxablebonds.The number
of householdsinthefourSurveys ofConsumer
Financesare93
million (1989),95.9million (1992),99
million (1995),and
102.6million (1998).Table3:
Households
withSignificantHoldings
ofBoth
Taxableand
Tax-DeferredFinancial AssetsValue
ofTax-Deferred
Account
Financial Assetsin
Taxable
Account
>0
>10K
>25K
>50K
>100K
1989>0
-A7
•* 11.2 8.0 5.9 3.6>10K
13.1 8.7-: v;cj\, -;'.-6.8 5.1 3.2>25K
8.0 5.9 4.8 3.8 2.4>50K
4.4 3.6 2.9 '2.6 1.8>100K
2.0 1.6 1.4 1.3 1-0 1998>0
30.3 18.6 14.0 10.9 6.6>10K
22.9 15.6 12.3 9.6 6.0>25K
17.2 12.7 10.3 -; 8.2 5.4>50K
11.9 9.2 7.6 6.2 - 4.3>100K
6.9 5.7 5.0 4.1 3.2Notes:
Each
entryshows
thetotalnumber
of
households(inmillions)withthespecifiedmix
ofassets in24
Table4: ShareofFinancialAssets
Held
inTax
DeferredAccounts, 1998Net
Worth
or FinancialAssetCriterion
Millionsof
Households
withTDA
&
Non-TDA
Assets
TDA
Assetsas aPercentageof
Total FinancialAssetsFor
Households
withBoth
TDA
and
Non-TDA
AssetsPercentile
Mean
10lh25
thMedian
75th90
th AllHouseholds
30.310.6%
28.0%
57.1%
85.6%
97.3%
55.9%
Net
Worth
>$100K
22.6 9.1 24.8 54.1 83.4 96.3 53.8Net
Worth >
S250K
14.3 6.8 19.6 47.9 77.9 94.5 48.9Net
Worth
>$1M
3.4 4.1 13.4 34.7 68.2 88.2 40.7 FinancialAssets>
$100K
15.3 7.3 20.9 49.2 79.0 94.7 49.8 FinancialAssets>
$250K
7.4 5.7 15.3 42.3 69.4 93.3 44.2 FinancialAssets>
$1M
1.6 3.0 7.9 25.0 51.5 85.1 33.3 Source: Authors'tabulationsusing1998Survey
ofConsumer
Finances. Seetextfor furtherdetails.Table5: Asset AllocationinTaxable and
Tax-Deferred
Accounts,1989-1998
1989
1992
19951998
AllFinancial AssetsEquityasPercentage
of
TotalFinancialAssets :. - ?•140$%':-
:47,8%
-DO.3/0 „ 69.7%:>
Tax
Exempt Bonds
asPercentageofTotal FinancialAssets 13.5 12.0 9.6 6.2 PercentofHouseholds
with Equity orFixed-Income
Assets 54.0 54.5 56.7 62.6 PercentofHouseholds
withAny
Equity 27.3 32.4 36.6 45.8 PercentofHouseholds
withAny
Fixed-Income
Assets 49.2 48.6 48.4 50.5 Financial AssetsHeld
inTDA
EquityasPercentage
of
TDA
FinancialAssets 33.6 46.8 54.467*sBHH
PercentofHouseholds
with EquityorFixed-Income
Assets 29.1 32.2 38.3 45.0 PercentofHouseholds
withAny
Equity 13.3 19.9 24.7 34.5 PercentofHouseholds
withAny
Fixed-Income
Assets 23.2 24.3 25.0 26.1 FinancialAssetsHeld
inOutsideTDA
EquityasPercentage


![[PDF] Cours avance avec exemples sur le fonctionnement des systemes d’exploitation - Cours informatique](data:image/gif;base64,R0lGODlhAQABAIAAAP///wAAACH5BAEAAAAALAAAAAABAAEAAAICRAEAOw==)