Publisher’s version / Version de l'éditeur:
Vous avez des questions? Nous pouvons vous aider. Pour communiquer directement avec un auteur, consultez la
première page de la revue dans laquelle son article a été publié afin de trouver ses coordonnées. Si vous n’arrivez pas à les repérer, communiquez avec nous à [email protected].
Questions? Contact the NRC Publications Archive team at
[email protected]. If you wish to email the authors directly, please see the first page of the publication for their contact information.
https://publications-cnrc.canada.ca/fra/droits
L’accès à ce site Web et l’utilisation de son contenu sont assujettis aux conditions présentées dans le site LISEZ CES CONDITIONS ATTENTIVEMENT AVANT D’UTILISER CE SITE WEB.
ICETECH 2010: 9th International Conference and Exhibition on Performance of
Ships and Structure in Ice [Proceedings], 2010-09-20
READ THESE TERMS AND CONDITIONS CAREFULLY BEFORE USING THIS WEBSITE. https://nrc-publications.canada.ca/eng/copyright
NRC Publications Archive Record / Notice des Archives des publications du CNRC :
https://nrc-publications.canada.ca/eng/view/object/?id=3b31310a-a905-4d3f-b34e-8708c5af882f
https://publications-cnrc.canada.ca/fra/voir/objet/?id=3b31310a-a905-4d3f-b34e-8708c5af882f
NRC Publications Archive
Archives des publications du CNRC
This publication could be one of several versions: author’s original, accepted manuscript or the publisher’s version. / La version de cette publication peut être l’une des suivantes : la version prépublication de l’auteur, la version acceptée du manuscrit ou la version de l’éditeur.
Access and use of this website and the material on it are subject to the Terms and Conditions set forth at
Assessment of lifeboat laminate strength
1
Assessment of Lifeboat Laminate Strength
Peter Gifford
Allison Kennedy
Memorial University of Newfoundland & Institute for Ocean Technology St. John’s, NL, Canada
[email protected] [email protected]
ABSTRACT
The objective of this work was to assess the material strength of conventional lifeboat composites and to examine the effect that particular factors have on the strength, using design of experiments methods. The research was a direct response to the growing need for information pertaining to the performance of lifeboats in ice-covered waters. Evaluating the strength of lifeboat laminates was completed through two test programs. The first focused on assessing the tensile strength while the second examined the impact strength.
KEY WORDS:
Laminate, Lifeboat, Strength, Experiments.INTRODUCTION
The research presented in this paper details two sets of laboratory tests that were performed to assess the material strength of lifeboat laminate. The aim of this research was to increase the knowledge base regarding the material properties of lifeboat laminates and to determine critical factors that affect the material performance. The insight gathered from this research can be used to guide regulations or to steer the structural design of an ice capable lifeboat.
DESIGN OF EXPERIMENTS METHODOLOGY
Design of Experiments (DOE) is a technique for developing experimental test plans and analyzing the results that are obtained. The test plans are optimized to reduce the total number of tests required to determine reliable results. DOE is particularly powerful because of its use of statistics to map each effect and to determine which of the examined factors are significant to the measured responses.
Design of Experiments has a number of applications in a broad range of fields. In the case of the experiments being presented in this report, DOE was used for the assessment of material properties and the determination of significant factors relevant to these properties.
There were two laminate properties assessed in this study: tensile
strength and impact strength. The research was conducted via two separate laboratory test programs. The analysis methodology is described by Montgomery (2005).
Tensile Testing
The tensile tests were configured to meet the standards outlined in ASTM: “Standard Test Method for Tension-Tension Fatigue of Polymer Matrix Composite Materials.” The experiments were planned using a five-factor, half-fraction, factorial design with two replicates. Testing was conducted in a calibrated tensile test machine located at Memorial University.
Test Factors
There were five factors considered in the tensile strength assessment: material type, specimen temperature, heat treatment, submergence and pre-stress. A factorial design limits the analysis to two levels for each factor. In this analysis four of the factors were categorical and one was numerical. The numerical factor was specimen temperature.
The upper level of the material type factor was laminate material that came from the hull of an out of use conventional lifeboat. The lower level of this factor refers to laminate that was fabricated to replicate actual lifeboat laminate. A burn test was completed on a piece of actual lifeboat laminate to determine the lay-up schedule that was required for fabrication of the replicated laminate.
The lower and upper level of the specimen temperature was -10oC and 18oC respectively. The upper level was representative of the room temperature of the test site. To obtain the lower level temperature the test specimens were cooled in a freezer room and transferred to the test location in a cooler. The lower temperature level is representative of the mean temperature of the chilled specimens at test time.
Specimens that underwent heat treatment were subjected to repeated temperature changes. The specimen underwent 2 cycles of 24 hours at – 20oC and 8 hours at 18oC to simulate typical freeze-thaw cycles that
2 could be experienced by a lifeboat operating in ice. The number of cycles was limited by the project time frame. The submerged specimens were placed in fresh water at room temperature for seven hours. Pre-stress involved suspending a 5 kg weight from the midpoint of a specimen for 21 hours. Treatment times for submergence and pre-stress, as outlined directly above, were selected such that they fit within the test schedule.
Heat treatment, submergence and pre-stress had an upper level corresponding to “yes” and a lower level corresponding to “no.” The level designations indicated if the treatment was applied or not. For example, a specimen with an upper level of the pre-stress factor was subjected to stress prior to testing.
Each factor was labeled as follows: A – material type, B – temperature, C – heat treatment, D – submergence and E – pre-stress.
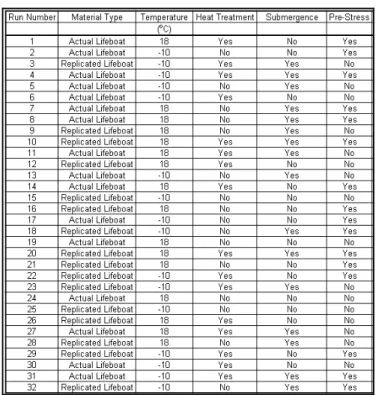
Test Results
There were a total of 32 tests conducted to assess the effect of five factors on the tensile strength of laminate. The run description for each of the 32 tests is provided in Table 1.
Table 1: Tensile Test Run Description
Destructive Impact Panel Testing
The destructive impact panel tests used the ISO standard: “Plastics – Determination of puncture impact behaviour of rigid plastics” as a guideline. Changes to the testing standard were implemented to allow for testing of larger panels, more representative of a lifeboat hull. The modifications affected the test frame, indenter and specimen size. The indenter size was increased from a hemisphere with a diameter of 0.020 m to 0.150 m. The specimens tested were square with dimensions of 0.50 m by 0.50 m.
Testing was completed using a hydraulic ram. The impact experiments were planned and analyzed using a full-factorial four factor design.
Test Factors
The destructive impact panel testing examined 4 different factors at 2 levels each. These factors will be described below along with a discussion to support the selection of each factor and the significance of the levels that were selected. The factors that were examined included temperature at time of impact, laminate thickness, construction method employed and construction materials used.
Temperature
Lifeboats operating in ice-covered waters are exposed to low temperature environments as a result of the surrounding air and water temperatures. A key factor that has been hypothesized to have a significant effect on the strength and impact resistance of a lifeboat hull is the temperature of the material. Analysis of this factor will determine whether temperature has an effect on a fiberglass panel’s ability to resist impact loads. The experiment evaluated the response of impacts on panels at 6oC and 16oC. These temperatures represent cold-water temperature and temperate air temperature respectively.
In an effort to ensure the lowest possible testing temperature was attained, the panels that were tested at low temperature were stored at -20oC until they were tested. At test time the chilled panels were removed from the cold room and fixed to the test frame for immediate testing.
Laminate Thickness
The laminate was tested at 10 mm (approximately 3/8 inch) and 16 mm (approximately 1/2 inch). The laminates of different thickness are similar in layup schedule, employing both chopped strand mat (CSM) and woven roving (WR). The quantity of fiberglass layers required to achieve the correct laminate thickness was different for the 10 mm and 16 mm panels.
Construction Method
The experiment examined two different construction methods in an effort to determine if modern techniques had a significant effect on the strength of the panels that were tested. This factor was tested as a categorical factor.
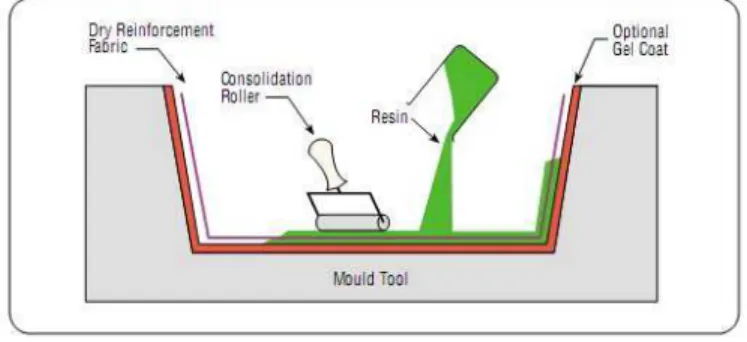
The first method of construction tested was the traditional hand lay-up technique in which the layers of glass are applied to the mould, wet out and then consolidated together to reduce the chance of de-lamination between layers and to reduce the number of void spaces in the laminate (shown in Figure 1). This technique results in a laminate that is strong, but typically heavy. An additional drawback to this method is that because the laminates are constructed and left to cure in an open mould, there is significant exposure to toxic chemicals and fumes. This has recently been identified as a significant health and safety risk.
3 Figure 1 - Hand Layup Method
The second method of construction tested was the vacuum bagging technique. This technique is similar to the hand layup technique, except rather than consolidating the fibers by hand, a vacuum bag is applied over the laminate, and all of the air in the bag is removed to create a vacuum (shown in Figure 2). The result is a highly compressed laminate with a consistent resin content and reduced overall weight. The result of the curing process being completed under vacuum is that there is less exposure to toxic chemicals and gasses that are the by-product of the curing process.
Figure 2 - Vacuum Bag Method
Construction Materials
Conventional lifeboat construction has used basic E-glass layup schedules in an effort to reduce material and labor costs. Additionally, because these conventional construction materials met all the strength requirements there was no need to explore modern, and typically more expensive, materials. Specifically, the materials and techniques traditionally used in the construction of lifeboats were such that the final lifeboat construction was able to pass the required Life Saving Appliance (LSA) tests. These tests simulated both an uncontrolled lifeboat drop from 3.5m and an impact with the side of a ship at ** m/s. Lifeboats operating in ice experience higher loads than those operating in open water. The experiment considers if the inclusion of Aramid (more commonly known as Kevlar™) on the outside skin of the panel improves the panel’s ability to resist failure from impact.
E-glass has a number of properties that make it attractive for marine vessel construction. The material has good tensile and compressive strength, and is relatively inexpensive to produce and acquire. These attributes have lead to E-Glass being the most common form of reinforcement fiber used in composites.
Aramid is a more modern material that is becoming increasingly common in the marine industry. It is a synthetic fiber that has both high strength and low density. Aramid has an excellent ability to resist
puncture. One of the drawbacks of this material however is that it has low compressive strength, and degrades slowly if exposed to ultraviolet light.
The construction material factor has two different categorical levels that include panels built solely from glass and panels built with E-glass plus a 7 oz Aramid layer near the outer skins of both sides of the laminate.
Test Response
There were three responses considered in the impact experiments. The acquisition of each response is described below.
Maximum Applied Load
To measure the applied load, a load cell was placed in line with the hydraulic ram. The load cell captured the applied load, measured in kilopond’s (kips), at a rate of 20 Hz. The load cell had a capacity of 650 kN (146 kips).
Deflection at Maximum Applied Load
A Linear Variable Differential Transducer (LVDT) was used to measure the deflection of the panel. This device captured the movement of the hydraulic ram in millimeters at a rate of 20 Hz. The LVDT was capable of measuring up to 254 mm (10 inch) of travel.
Impact Energy
The impact energy between the hydraulic ram and the FRP panel was calculated by integrating the area under the applied load versus deflection plot. It should be noted that the impact energy was calculated from the moment the ram began to apply load to the panel to the moment the maximum applied load was achieved.
Impact energy is an important response as it can easily be used to correlate the test data from this experiment to full-scale trials that have been completed.
Test Results
There were a total of 16 tests conducted to assess the impact strength of lifeboat laminate. There were no repeats conducted. The run description of the impact tests is presented below, Table 2.
4 Table 2 - Destructive Impact Testing Run Description
Run Number Thickness Temperature Material Construction
mm oC
1 10 6 E-Glass Hand Layup
2 16 6 E-Glass Hand Layup
3 10 16 E-Glass Hand Layup
4 16 16 E-Glass Hand Layup
5 10 6 E-Glass with Kevlar Hand Layup
6 16 6 E-Glass with Kevlar Hand Layup
7 10 16 E-Glass with Kevlar Hand Layup
8 16 16 E-Glass with Kevlar Hand Layup
9 10 6 E-Glass Vacuum Bag
10 16 6 E-Glass Vacuum Bag
11 10 16 E-Glass Vacuum Bag
12 16 16 E-Glass Vacuum Bag
13 10 6 E-Glass with Kevlar Vacuum Bag
14 16 6 E-Glass with Kevlar Vacuum Bag
15 10 16 E-Glass with Kevlar Vacuum Bag
16 16 16 E-Glass with Kevlar Vacuum Bag
OBSERVATIONS
Tensile Testing
All experimental results were entered into the statistical software Design Expert (DE) for analysis. This program uses the ANOVA test to study the results and formulate conclusions. To complete the analysis the first consideration was what effects should be included in the model. To determine this one must observe the effects list provided by DE and see which effects have large percent contributions. The effects list indicated that heat treatment (C), pre-stress (E), the interaction between material type and temperature (AB) and the interaction between temperature and pre-stress (BE) had the highest percent contributions and thus should be included in the model. Because AB and BE are combined effects Design Expert automatically selected A and B to also be included in the model in order to have hierarchy. There are three main assumptions of the ANOVA test. The assumptions were assessed prior to data analysis. The assumption of normality was satisfied by viewing the normal plot of residuals and confirming that all data points aligned well with the normal line. Next it was ensured that the variance of the data set was equally distributed around the mean. This was ensured by analyzing the residuals versus predicted plot which proved that all data points had roughly equal variance. The third main assumption of the ANOVA is that the data is random. This was verified by viewing the residuals versus run plot. It should also be noted that the box-cox plot was reviewed to determine if DE suggested a data transformation. There was no data transformation suggested. When all assumptions were satisfied, the ANOVA results were studied. A confidence interval of 0.05 was used in this analysis and therefore any effect that had a p-value below 0.05 was significant. The ANOVA results are shown in Table 3, presented below.
Table 3 - Tensile Strength ANOVA Table ANOVA for selected factorial model
Analysis of variance table [Partial sum of squares - Type III]
Sum of Mean F p-value
Source Squares df Square Value Prob > F
Model 13656 6 2276 3.49 0.012 significant A-Material Type 15.94 1 15.93 0.024 0.877 B-Temperature 17.65 1 17.64 0.027 0.871 C-Heat Treatment 2816 1 2816 4.321 0.048 E - Pre Stress 8233 1 8233 12.63 0.0015 AB 1321 1 1321 2.03 0.167 BE 1250 1 1250 1.92 0.178 Residual 16295 25 651
Lack of Fit 2001 9 222 0.248 0.98 not significant
Pure Error 14293 16 893
Cor Total 29951 31
The results indicate that the model itself was significant with a p-value of 0.012 and the lack of fit was not significant with a p-value of 0.980, this is indicative of a good model. There were only two effects that proved to be significant with a confidence interval of 0.05: heat treatment and pre-stress. Not shown in the table is the R2 and adjusted R2 values that were calculated for the model. These values are 0.456 and 0.325 respectively. This indicates that the model is statistically significant, however highlights the fact that further work must be done to develop a more accurate model.
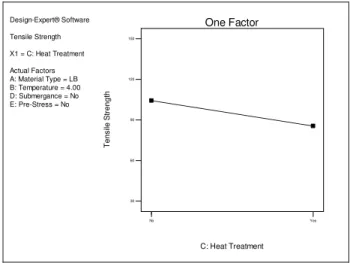
Design-Expert® Software Tensile Strength X1 = C: Heat Treatment Actual Factors A: Material Type = LB B: Temperature = 4.00 D: Submergance = No E: Pre-Stress = No C: Heat Treatment T e ns ile S tre ngt h One Factor No Yes 30 60 90 120 150
Figure 3 - Effect of Heat Treatment on Tensile Strength
Design-Expert® Software Tensile Strength Design Points E1 No E2 Yes X1 = B: Temperature X2 = E: Pre-Stress Actual Factors A: Material Type = LB C: Heat Treatment = No D: Submergance = No E: Pre-Stress -10.00 -3.00 4.00 11.00 18.00 Interaction B: Temperature T e ns ile S tre ngt h 30 63.9154 97.8308 131.746 165.662
Figure 4: Interaction effect of Pre-Stress and Temperature on Tensile Strength
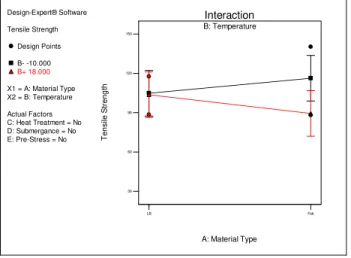
5 Design-Expert® Software Tensile Strength Design Points B- -10.000 B+ 18.000 X1 = A: Material Type X2 = B: Temperature Actual Factors C: Heat Treatment = No D: Submergance = No E: Pre-Stress = No B: Temperature LB Fab Interaction A: Material Type T e ns ile S tre ngt h 30 60 90 120 150
Figure 5: Interaction Effect of Temperature and Materials Type on Tensile Strength
Results collected through the used of Design Expert show that tensile strength was decreased when a specimen was exposed to the heat treatment (C). This is displayed in Figure 3, shown above. The interaction plots presented above, Figure 4 and Figure 5, show the interaction between pre-stress and temperature (BE) and temperature and material type (AB), respectively. Figure 4 shows that tensile strength is consistent across the temperature range if the specimen has not been exposed to pre-stress. However, it shows an increase in tensile strength as the temperature increases, if the specimen has been exposed to pre-stress. Figure 5 shows that temperature has little effect on the standard lifeboat panel’s tensile strength. The same figure indicates an increase in tensile strength with a decrease in temperature if the panel is made to replicate the original lifeboat laminate.
Destructive Impact Panel Testing
The impact panel test results were also analyzed using the software package Design Expert. The results of both the impact energy and maximum applied load are presented below. The analysis of both responses followed the same procedure as the tensile test approach.
Impact Energy
The key factors affecting the impact energy were thickness (A), materials (C) and construction technique (D) as well as the interaction between thickness and materials (AC). This result is presented in the form of an ANOVA table, shown below in Table 4.
Table 4 - Impact Energy ANOVA Table
Sum of Mean F p-value
Source Squares df Square Value Prob > F
Model 1089351 4 272337.7 13 0.0004 significant A-Thickness 713141 1 713141.08 34.05 0.0001 C-Materials 83062 1 83062.98 3.97 0.0718 D-Constructi 96328 1 96328.84 4.6 0.0552 AC 196817 1 196817.3 9.4 0.0107 Residual 230389 11 20944.51 Cor Total 1319741 15
ANOVA for selected factorial model
Analysis of variance table [Partial sum of squares - Type III]
The table shows that the model is significant and that the factors identified are significant with a confidence interval of 5%. Not shown
in the table is the R2 and adjusted R2 values that were calculated for the model. These values are 0.82 and 0.76 respectively. This indicates that the model is statistically significant.
The results of the impact energy analysis, shown in Figure 6 and Figure 7 indicate that the significant factors are laminate thickness, material type and construction technique. Additionally, the analysis showed that there was a strong interaction between thickness and material type. In general it was found that the impact energy was highest for thicker panels for both E-Glass panels and E-Glass & Aramid Panels. It should be noted however, that thicker panels that contain Aramid have lower impact energy than those that are E-Glass only. Finally, it must be mentioned that panels constructed using the hand layup method had slightly higher impact energy than those that were vacuum bagged.
Design-Expert® Software Impact Energy
C1 E-Glass
C2 E-Glass with Kevlar
X1 = A: Thickness X2 = C: Materials Actual Factors B: Temperature = 11.00 D: Construction Technique = Average
C: Materials 10.00 11.50 13.00 14.50 16.00 Interaction A: Thickness Im pa ct E ne rg y 300 575 850 1125 1400
Figure 6 - Impact Energy Model - Thickness and Material Effects
Design-Expert® Software Impact Energy X1 = D: Construction Technique Actual Factors A: Thickness = 13.00 B: Temperature = 11.00 C: Materials = E-Glass D: Construction Technique Im pa ct E ne rg y One Factor
Hand Layup Vacuum Bag 300
575 850 1125 1400
Figure 7 - Impact Energy Model - Construction Technique Effect
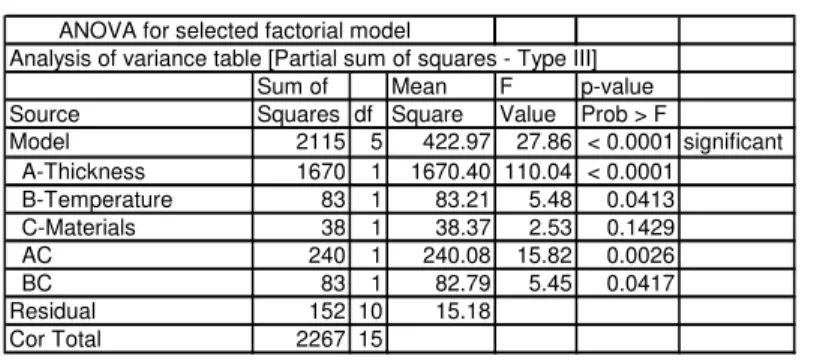
Applied Load
The key factors that were identified as affecting the maximum applied load through the experimental analysis were panel thickness, factor A, temperature, factor B, and materials, factor C. Additionally, the plot shows that there is an interaction between B and C and A and C. This result is presented in the form of an ANOVA table, shown below in Table 5. This table shows that the model developed is significant, based on a 5% confidence interval. Additionally, it shows that the identified factors are all significant based on the same confidence interval. The R2
6 and Adjusted R2 values for the model are 0.93 and 0.90 respectively. This is indicative of a statistically significant model.
Table 5 - Maximum Applied Energy ANOVA Table
Sum of Mean F p-value
Source Squares df Square Value Prob > F
Model 2115 5 422.97 27.86 < 0.0001 significant A-Thickness 1670 1 1670.40 110.04 < 0.0001 B-Temperature 83 1 83.21 5.48 0.0413 C-Materials 38 1 38.37 2.53 0.1429 AC 240 1 240.08 15.82 0.0026 BC 83 1 82.79 5.45 0.0417 Residual 152 10 15.18 Cor Total 2267 15
ANOVA for selected factorial model
7 The plots developed in the analysis are presented in Figure 8 and Figure 9. In general, as thickness is increased so is the maximum applied load. However, an interesting note is that for panels that are 10mm thick, if Aramid is in the panel the panel has a higher maximum applied load.
Design-Expert® Software Maximum Applied Load
C1 E-Glass
C2 E-Glass with Kevlar
X1 = B: Temperature X2 = C: Materials Actual Factors A: Thickness = 13.00
D: Construction Technique = Hand Layup
C: Materials 6.00 8.50 11.00 13.50 16.00 Interaction B: Temperature M a xi m u m A pp lied Load 34 44.5 55 65.5 76
Figure 8- Applied Energy - Temperature and Material Effects
Design-Expert® Software Maximum Applied Load
C1 E-Glass
C2 E-Glass with Kevlar
X1 = A: Thickness X2 = C: Materials Actual Factors B: Temperature = 11.00
D: Construction Technique = Hand Layup
C: Materials 10.00 11.50 13.00 14.50 16.00 Interaction A: Thickness M a xi m u m A pp lied Lo ad 34 44.5 55 65.5 76
Figure 9 - Applied Load - Thickness and Material Effects If the panel is 16mm thick and there is Aramid in the laminate, the maximum applied load is significantly reduced. Also noteworthy is the fact that in general, the maximum applied load is highest for low temperature conditions. Furthermore, if the laminate contains Aramid and is at a low temperature the maximum applied load is higher than if the laminate is only E-glass. At the higher temperature this effect is significantly less obvious.
RECOMMENDATIONS
Recommendations have been made based on the analysis of tensile and impact experiments. The recommendations are reviewed below.
Tensile Testing
Tensile test analyses lead to a number of findings that could improve the outcome of future laminate tensile testing. To begin, the submergence time was short (7 hours). The time should be lengthened in future tests to determine if a longer submergence would significantly affect laminate tensile strength.
Another recommendation relates to the clamping of specimens during testing. Some specimens tested encountered slip between the tensile machine clamps. As the force was applied some specimens gradually slipped out of the clamps. This could be seen as the test was occurring since the force displacement graph would cut off. When this occurred the specimen had to be re-clamped and retested. The initial force could have affected the maximum stress it could withstand upon retesting. Future tests could prevent this issue by sanding specimen edges, making them rougher and less susceptible to slip.
Destructive Impact Panel Testing
Panel testing involving chilled specimens should be conducted in a cold room. This will ensure a constant and consistent cold temperature for all specimens as well as ensuring that there is only a limited temperature gradient within the specimen. This should lead to less error in the results.
It would have been desirable to be able to complete a set of replicate runs for the experiment. These would have allowed for an error analysis to be completed as well as giving the data more certainty.
It should be noted that because this was a preliminary study of the impact resistance of a fiberglass plate, care must be taken in extending the results acquired and presented in this paper to true design problems. The testing focused on four panel constructions primarily constructed with E-Glass, and some reinforced with Aramid. Testing presented in this paper represents the testing that was completed. With that said, it is recommended that future work be completed to determine the effect of Aramid when located at both the extreme fibers, as was tested in this program, and at the neutral axis, proposed for future testing.
Future tests
Future tests conducted on replicated laminate should allow for adequate cure time as recommended in Gurit (2007). This will ensure that the specimens are fully cured and at optimal strength prior to testing. Additionally, future testing should examine a larger temperature range. If lifeboats are to operate in both a temperate and arctic environment, testing will need to consider a minimum range of 30oC to – 40oC. Testing conducted to date has focused primarily on establishing the primary factors that affect the responses that have been measured. Future testing may wish to focus more directly on developing a detailed analysis of the responses that are significant. This would require the addition of center points and axial points in the experimental design. Doing this would result in the ability to extend the developed model beyond the current linear model that is presented within the paper. In addition to this, there are still a number of variables that could be tested. These factors could include exploring cored panels, post curing panels, and using different types of resin. Furthermore, as fiberglass laminates are a highly customizable in their design it would be advantageous to determine whether different fiber types, and fiber orientations would have a significant effect on the panels impact resistance.
It is clear that lifeboats will need to be built with increased strength properties, but it is also clear that an effort will need to be made to maintain a light structure. Weight is a sensitive issue because these small craft spend most of their lives being carried by larger vessels, and
8 minimizing the overall weight improves the efficiency of the whole system.
CONCLUSIONS
The tensile tests concluded that pre-stress & temperature, material type & temperature and heat treatment significantly affect the strength of laminate material. The tensile tests were successful in determining the tensile strength of lifeboat laminate and assessing significant factors. A positive finding was that replicated laminate behaved similar to lifeboat laminate in terms of tensile strength. This allows for future testing to be performed on replicated material that is cheaper and more accessible than actual lifeboat laminate.
The destructive impact testing concluded that laminate thickness, material and construction technique had a significant effect on the impact energy of the test samples. Additionally, the experiment showed that temperature, material type and laminate thickness had a significant effect on the applied load. Two important findings indicated that there was not an appreciable increase in strength when a panel is cured under vacuum and that panel strength increased as the panel temperature decreased.
The results of this analysis could be applied to the structural design of any small laminate craft operating in harsh conditions. A relevant application is the design of a structurally enhanced lifeboat capable of operation in ice. With that said, it should be noted that the results presented in this paper are applicable only to the laminates that were
tested. This is primarily due to the highly variable strength of composites, as they depend highly on the composite’s design, and the preliminary nature of the study itself. Further research, as discussed above, will help to develop a knowledge base that can be broadly applied to specific design problems.
ACKNOWLEDGEMENTS
The financial support provided by the Institute for Ocean Technology (IOT), Memorial University of Newfoundland (MUN) and Natural Resources Canada’s Program of Energy Research and Development (PERD) is greatly appreciated.
REFERENCES
American Society for Testing and Materials (ASTM), “Standard Test Method for Tension-Tension Fatigue of Polymer Matrix Composite Materials”, D3479 / D 3479M, 1996.
International Organization for Standardization (ISO), “Plastics – Determination of puncture impact behaviour of rigid plastics”, 6603-2, 2000.
Gurit - SP High Modulus, “Composite Materials Handbook – Marine”, Gurit (UK) Limited, United Kingdom, 2007.
Montgomery, D.C, “Design and Analysis of Experiments”, 6th Edition, John Wiley & Sons Incorporated, United States of America, 2005.